MCE for Age Groups and PM2.5 Exposure
Studies have shown that people with COVID-19 who live in regions with higher levels of air pollution, especially PM2.5, are more likely to die from the disease (Wu et al., 2020). Therefore, we considered long-term exposure to high levels of PM2.5 as another factor in the MCE analysis.
We first created a finer grained surface to show different risk levels with exposure to PM2.5 on a local scale. The major transportation routes included highways and major bus routes were selected from the transportation network data, this layer was then converted into a raster surface.
By using this raster surface, we created a Euclidean Distance surface. Raster calculator was used to normalize the distance surface, and the expression we used was as follow:
( (max value of distance surface – [distance surface] ) / max value of distance surface ) ) *10
The output surface represented the residents’ exposure to PM2.5. It ranged from 0 to 10 and 10 was the closest value to the main road.
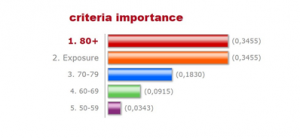
To determine the weight of this factor, we referred to the research from Harvard University (Wu et al., 2020), which tells for every 1um/m3 increase in PM2.5 concentration, covid19 mortality increased by 15% (95% confidence interval). Official data shows that from 2009 to 2014, the average concentration of PM2.5 increased by about 1 um/m3 (Government of Canada, 2016) .Therefore, we assume that at least 15% of the deaths of covid19 in vancouver are caused by this increase. The weight of each factor was then recalculated, and the result is shown as below. The final weighted map was also created using Weighted Sum.
* There was uncertainty involved in this step. We assumed that all the roads are weighted equally. A more nuanced representation can be done by using different weights for the different types of roads.