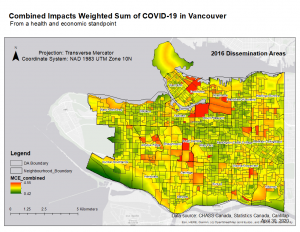
This final combined impacts map examines variables from a health and economics standpoint. From the health perspective, it includes age and PM2.5 exposure, weighted by % mortality rate. From the economic perspective, it’s split into individual and commercial viewpoints. From the individual side, variables such as those retired, spending 30% of their income or more on shelter costs and those who have sales and/or service occupations are included. The commercial properties are added including restaurants, bars, etc.
The top MCE values are highlighted in red, with community names present on the map. There are many red DAs near Downtown, South Cambie, and between Mount-Pleasant and Strathcona. This means that these areas are the most likely to be the hardest hit after accounting for all the above mentioned variables.
The greenest areas are near southern dunbar-Southlands, with most of the map having average MCE value. This showcases a much more significant contrast between the higher and middle tier values as shown in the map. This brings to focus areas that may require extra examination when providing COVID-19 relief in both a health and economic viewpoint.