Category Archives: Results

Results: Physically at-risk

MCE for Age Groups

The first weighted MCE results we did visualize DAs that are more physically at-risk by looking at the mortality rate of people of different ages after infection with the virus. The population was divided into four groups aged 50-59, 60-69, 70-79 and over 80. According to New York Health (Worldometer, 2000), the age group over 80 years old was considered most likely to die from COVID-19. In decreasing order, it was followed by 70-79, 60-69, and 50-59. AHP calculator, therefore, weighed each of the factors based on the mortality rate of each age group.

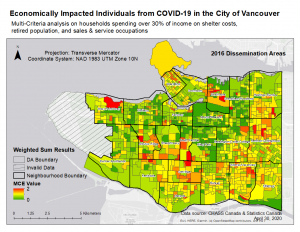
The results of this MCE were shown in the first map. The MCE values of each factor range from 0 to 10. In the text, we referred to red areas on the map as very high, which means that the risk of death of COVID-19 was very high, while the yellow and green areas are medium and very low, respectively.

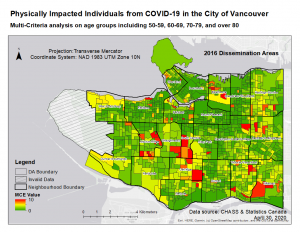
According to the MCE model, the physically high-risk areas are identified, and they are mainly located in central Vancouver. The very high values of MCE represent that people in these DAs are more likely to die from COVID-19, which is determined by demographic characteristics — for example, a high proportion of the elderly. These DAs are particularly concentrated in communities such as South Cambie and Shaughnessy. A second area at risk was identified in the southeast, where communities like Killarney contain DAs with very high MCE values. A third region which has identical DAs with high MCE value is in the northeast of Vancouver. The DA in Strathcona has a particularly high MCE value compared with its surrounding DAs. By looking at the open street map, we found a very large care house (Villa Cathay care Home) in this DA, which may be the reason for the high MCE value.

The DAs identified as medium risk (orange and yellow) by the MCE model were mostly located in regions around high-risk DAs. They are clustered in communities including Oakridge, Renfrew-Collingwood and Killarney. We noticed that West Point Grey and Dunbar-Southlands also have quite a few DAs ranked as medium risk. The low-risk DAs cover most of Vancouver. Downtown, Mount Pleasant and Grandview-Woodland seem to be the most resistant neighbourhoods to COVID-19.

MCE for Age Groups and PM2.5 Exposure

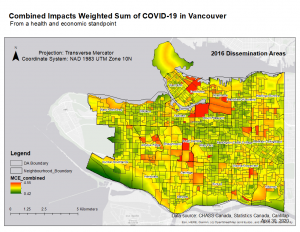
Since the above weighted MCE analysis only takes into account the risk of death from COVID-19 for different ages, we therefore carried out a more complex MCE analysis that included residents’ exposure to PM2.5 (the map below). In the second MCE model, seniors over 80 and exposure to an increase of 1ug/m3 PM2.5 contributed to the highest mortality rate, and thus DAs with more seniors over 80 as well as having long-term exposure to an increasing PM2.5 concentration would be identified as high risk. The order of the remaining factors is the same as that of the first MCE pattern.

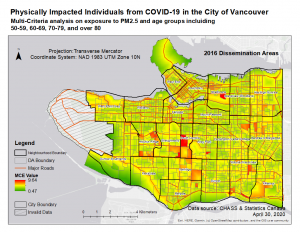
In contrast to the first MCE model, the second model shows that the majority of DAs in Vancouver are identified as medium risk. In addition, there is more variation in each DA, as we can observe that areas closer to the main traffic route show higher risks than areas farther away from the main traffic route.

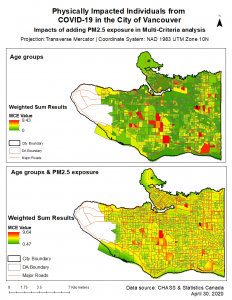
The last map compares the results of the two MCE models mentioned above. It is interesting to note that in the second MCE model, fewer DAs are identified as high risks, such as the DA on the southeast corner, which was listed as high risk in the first MCE model, and is now in the middle to low-risk range. In other words, the mortality risk of COVID-19 in this DA was reduced, and PM2.5 exposure should be an important factor leading to this result. On the other hand, two areas, South Cambie and Strathcona are still considered at very high risk.

Results: Individuals economically at-risk

This MCE shows regions where the location quotients were above 1 or more in all 3 variables: populations that are retired, have sales and/or service occupations and spend 30% or more of their income on shelter costs. High MCE values are highlighted in red dissemination areas, with some accumulation near strathcona, north of West Point Grey and near Arbutus-Ridge to Oakridge. By pinpointing these areas, policy targeted towards alleviating individual economic burdens can be targeted to DAs that are most likely to be the most impacted. The lowest MCE values seem to be near Mount Pleasant, with the most accumulated areas colored in green, meaning these areas have the least vulnerable individuals in terms of an economic standpoint.

Results: Commercial industries at-risk

During the COVID-19 lockdown period, many businesses are negatively affected. According to Statistics Canada, biggest declines were in wholesale and retail in BC, followed by accommodation, restaurant and food services industry Other industries, such as culture and entertainment, have also seen significant declines (Crawford, 2020). Based on this, five business sectors most likely to be closed during the lockdown were identified, including restaurants, accommodation, retail, and two entertainment businesses, namely cinemas and ski centres. These high-risk business sectors correspond to the high-risk occupations discussed in the previous section.

The first map shows the total number of identified commercial industries within each DA. By simply adding the at-risk industries together, we can observe from the map that both the DAs near the Downtown area and the DAs located in the northeast Downtown have a relatively large number of businesses, indicating that these areas are more affected by the lockdown of COVID-19. I also added a layer that shows where all the accommodations are in Vancouver because this is the sector that indicates the highest intensity in a certain area. We can see that most of the accommodations, such as hotels, are gathered in Downtown.

Based on the map above, a heatmap was created showing the hot spot analysis results of the at-risk businesses in Vancouver during the lockdown. The first hit spot is located Downtown and west of Mount Pleasant. It covers a relatively large area with 99% confidence, which means that a large number of the commercial industries that we identified are concentrated in this area, and therefore it is more vulnerable to the lockdown because they involve public-facing activities and therefore are more likely to be closed.

The second hot spot is found in central Vancouver, especially the Shaughnessy community. This area also shows a cluster of businesses that are negatively affected by the COVID-19, but not as strong as the first hotspots.

There is only one pronounced cold spot being pointed out, which is located in the western downtown, and this community may therefore be considered resistant to disease outbreaks. It is actually interesting to find out that the spatial clustering of at-risk businesses has such a significant difference.

Results: Combined impacts

This final combined impacts map examines variables from a health and economics standpoint. From the health perspective, it includes age and PM2.5 exposure, weighted by % mortality rate. From the economic perspective, it’s split into individual and commercial viewpoints. From the individual side, variables such as those retired, spending 30% of their income or more on shelter costs and those who have sales and/or service occupations are included. The commercial properties are added including restaurants, bars, etc.

The top MCE values are highlighted in red, with community names present on the map. There are many red DAs near Downtown, South Cambie, and between Mount-Pleasant and Strathcona. This means that these areas are the most likely to be the hardest hit after accounting for all the above mentioned variables.

The greenest areas are near southern dunbar-Southlands, with most of the map having average MCE value. This showcases a much more significant contrast between the higher and middle tier values as shown in the map. This brings to focus areas that may require extra examination when providing COVID-19 relief in both a health and economic viewpoint.

Results: Exploration on occupations

The first map shown for this section shows hotspot maps of areas where there was high LQ for occupations that were defined as most-impacted or most likely impacted. We see very obvious spatial relationships, with the most impacted areas being near East Vancouver, and the most resilient areas near West Vancouver.

The second map examines resilient occupations with a hotspot map to show areas of high LQ. The red regions symbolize DAs with more residents having resilient occupations than other DAs. We see that there is high accumulation of red regions near Shaughnessy and between Renfrew-Collingwood and Victoria-Fraserview. These communities would have the least negative impacts as there is higher relative % of resistant occupations. Vice versa, we see blue areas near Downtown to West End Vancouver, as well as some areas near Kitsilano and Grandview Woodland. These areas, in terms of resistant occupations, would specialize the least in this area.

The third map here compares the resilient and negatively-affected occupation data. We see that there are a few similarities in areas that are both resilient and negatively affected (ex. Near Victoria-Fraserview) as well as areas that are both non-resilient and negatively affected and vice versa. Due to this, we decided to do an overlay map to show regions that are either both non-resilient and negatively affected, or resilient and not negatively affected.

The fourth map shows the results of this overlay, with the red meaning that across both maps areas like Strathcona and Grandview-Woodland are negatively affected in terms of occupational data. Similarly, the green areas near Shaughnessy, West Point-Grey and dunbar-Southlands show more resilient areas. Compared to the accumulated MCE map, regions near Strathcona appear to be commonly associated with significant negative impacts and regions near Dunbar-Southlands having the least.

Lastly, a diversity index (DI) was done across the four categories of occupations in order to see our diverse a DA is. Hypothetically, the more diverse a DA is the more able it is able to withstand COVID-19 related variables. We can see that the most diverse areas are near Kensington-Cedar Cottage and Renfrew-Collingwood, as well as the least diverse areas near Mount Pleasant, Downtown and Strathcona. Although the DI does not provide information on if the COVID-19 impacts would be negative or positive, it does mean that the blue shaded regions are the most likely regions to feel any impact if any, and the red regions the least. This is because if one occupation is hit hard and if the DA is diverse, it would be able to withstand the negative consequences from the other occupations that may not experience it.