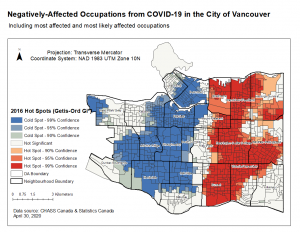
The first map shown for this section shows hotspot maps of areas where there was high LQ for occupations that were defined as most-impacted or most likely impacted. We see very obvious spatial relationships, with the most impacted areas being near East Vancouver, and the most resilient areas near West Vancouver.
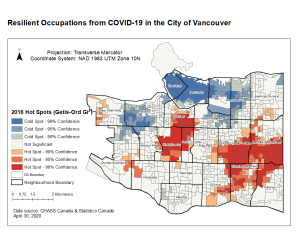
The second map examines resilient occupations with a hotspot map to show areas of high LQ. The red regions symbolize DAs with more residents having resilient occupations than other DAs. We see that there is high accumulation of red regions near Shaughnessy and between Renfrew-Collingwood and Victoria-Fraserview. These communities would have the least negative impacts as there is higher relative % of resistant occupations. Vice versa, we see blue areas near Downtown to West End Vancouver, as well as some areas near Kitsilano and Grandview Woodland. These areas, in terms of resistant occupations, would specialize the least in this area. 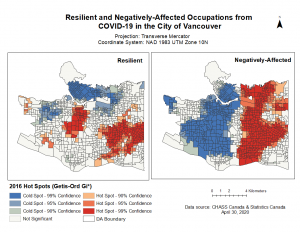
The third map here compares the resilient and negatively-affected occupation data. We see that there are a few similarities in areas that are both resilient and negatively affected (ex. Near Victoria-Fraserview) as well as areas that are both non-resilient and negatively affected and vice versa. Due to this, we decided to do an overlay map to show regions that are either both non-resilient and negatively affected, or resilient and not negatively affected.
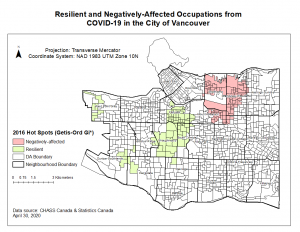
The fourth map shows the results of this overlay, with the red meaning that across both maps areas like Strathcona and Grandview-Woodland are negatively affected in terms of occupational data. Similarly, the green areas near Shaughnessy, West Point-Grey and dunbar-Southlands show more resilient areas. Compared to the accumulated MCE map, regions near Strathcona appear to be commonly associated with significant negative impacts and regions near Dunbar-Southlands having the least.
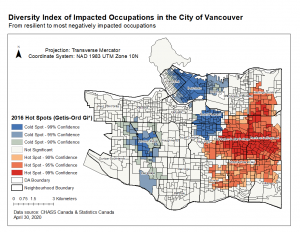
Lastly, a diversity index (DI) was done across the four categories of occupations in order to see our diverse a DA is. Hypothetically, the more diverse a DA is the more able it is able to withstand COVID-19 related variables. We can see that the most diverse areas are near Kensington-Cedar Cottage and Renfrew-Collingwood, as well as the least diverse areas near Mount Pleasant, Downtown and Strathcona. Although the DI does not provide information on if the COVID-19 impacts would be negative or positive, it does mean that the blue shaded regions are the most likely regions to feel any impact if any, and the red regions the least. This is because if one occupation is hit hard and if the DA is diverse, it would be able to withstand the negative consequences from the other occupations that may not experience it.