The second step we wanted to examine was to identify individuals who would be economically most at risk from the COVID-19 lockdown. This was identified in three aspects: those spending 30% of their income or more on shelter costs, those who are retired (ie. aged 65+) and those who belong to occupations where there are high numbers of employees being laid off or not paid.
Data was provided by CHASS for all of the above variables by dissemination area in Greater Vancouver for 2016. Occupations identified under CHASS were:
- Management occupations
- Business, finance and administration occupations
- Natural and applied sciences and related occupations
- Health occupations
- Occupation in education, law and social, community and government services
- Occupations in art, culture, recreation and sport
- Sales and service occupations
- Trades, transport and equipment operators and related occupations
- Natural resources, agriculture and related production occupations
- Occupations in manufacturing and utilities
The top occupations lost according to Statistics Canada are those within the accommodation, restaurant and food services industry (2). Other occupations, including information, culture, recreation, business, finance, building and support were also hit. By examining the metadata file that CHASS organized each occupation under, we decided to include “sales and service occupations” as most if not all occupations listed were identified to be the most hit. Other fields were not included for the final analysis as occupations listed had some that were not hit by COVID-19 or it’s unknown if people were continuing to be paid or not.
Location quotients (LQ) were calculated for each variable using the following formula:
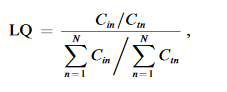
Where the numerator represents the regional specialization and the denominator is the total Vancouver specialization. LQ was then normalized, where values between 0 and 1 inclusive were given a value or 0 while all other values remained the same.
The file was then merged with the dissemination areas provided by Statistics Canada, and each variable layer was converted to raster format. A weighted sum (MCE) was done, with equal weights of 0.33 for each variable. Weights were chosen to be equal as we assumed overall economic impact would be similar across each group.