Results: Individuals economically at-risk

This MCE shows regions where the location quotients were above 1 or more in all 3 variables: populations that are retired, have sales and/or service occupations and spend 30% or more of their income on shelter costs. High MCE values are highlighted in red dissemination areas, with some accumulation near strathcona, north of West Point Grey and near Arbutus-Ridge to Oakridge. By pinpointing these areas, policy targeted towards alleviating individual economic burdens can be targeted to DAs that are most likely to be the most impacted. The lowest MCE values seem to be near Mount Pleasant, with the most accumulated areas colored in green, meaning these areas have the least vulnerable individuals in terms of an economic standpoint.

Results: Commercial industries at-risk

During the COVID-19 lockdown period, many businesses are negatively affected. According to Statistics Canada, biggest declines were in wholesale and retail in BC, followed by accommodation, restaurant and food services industry Other industries, such as culture and entertainment, have also seen significant declines (Crawford, 2020). Based on this, five business sectors most likely to be closed during the lockdown were identified, including restaurants, accommodation, retail, and two entertainment businesses, namely cinemas and ski centres. These high-risk business sectors correspond to the high-risk occupations discussed in the previous section.

The first map shows the total number of identified commercial industries within each DA. By simply adding the at-risk industries together, we can observe from the map that both the DAs near the Downtown area and the DAs located in the northeast Downtown have a relatively large number of businesses, indicating that these areas are more affected by the lockdown of COVID-19. I also added a layer that shows where all the accommodations are in Vancouver because this is the sector that indicates the highest intensity in a certain area. We can see that most of the accommodations, such as hotels, are gathered in Downtown.

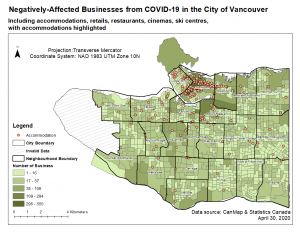
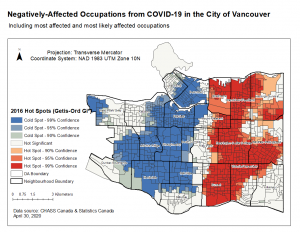
Based on the map above, a heatmap was created showing the hot spot analysis results of the at-risk businesses in Vancouver during the lockdown. The first hit spot is located Downtown and west of Mount Pleasant. It covers a relatively large area with 99% confidence, which means that a large number of the commercial industries that we identified are concentrated in this area, and therefore it is more vulnerable to the lockdown because they involve public-facing activities and therefore are more likely to be closed.

The second hot spot is found in central Vancouver, especially the Shaughnessy community. This area also shows a cluster of businesses that are negatively affected by the COVID-19, but not as strong as the first hotspots.

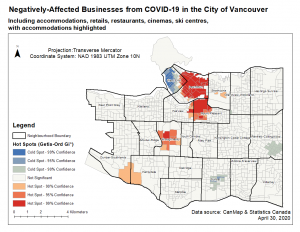
There is only one pronounced cold spot being pointed out, which is located in the western downtown, and this community may therefore be considered resistant to disease outbreaks. It is actually interesting to find out that the spatial clustering of at-risk businesses has such a significant difference.

Results: Combined impacts

This final combined impacts map examines variables from a health and economics standpoint. From the health perspective, it includes age and PM2.5 exposure, weighted by % mortality rate. From the economic perspective, it’s split into individual and commercial viewpoints. From the individual side, variables such as those retired, spending 30% of their income or more on shelter costs and those who have sales and/or service occupations are included. The commercial properties are added including restaurants, bars, etc.

The top MCE values are highlighted in red, with community names present on the map. There are many red DAs near Downtown, South Cambie, and between Mount-Pleasant and Strathcona. This means that these areas are the most likely to be the hardest hit after accounting for all the above mentioned variables.

The greenest areas are near southern dunbar-Southlands, with most of the map having average MCE value. This showcases a much more significant contrast between the higher and middle tier values as shown in the map. This brings to focus areas that may require extra examination when providing COVID-19 relief in both a health and economic viewpoint.

Results: Exploration on occupations

The first map shown for this section shows hotspot maps of areas where there was high LQ for occupations that were defined as most-impacted or most likely impacted. We see very obvious spatial relationships, with the most impacted areas being near East Vancouver, and the most resilient areas near West Vancouver.

The second map examines resilient occupations with a hotspot map to show areas of high LQ. The red regions symbolize DAs with more residents having resilient occupations than other DAs. We see that there is high accumulation of red regions near Shaughnessy and between Renfrew-Collingwood and Victoria-Fraserview. These communities would have the least negative impacts as there is higher relative % of resistant occupations. Vice versa, we see blue areas near Downtown to West End Vancouver, as well as some areas near Kitsilano and Grandview Woodland. These areas, in terms of resistant occupations, would specialize the least in this area.

The third map here compares the resilient and negatively-affected occupation data. We see that there are a few similarities in areas that are both resilient and negatively affected (ex. Near Victoria-Fraserview) as well as areas that are both non-resilient and negatively affected and vice versa. Due to this, we decided to do an overlay map to show regions that are either both non-resilient and negatively affected, or resilient and not negatively affected.

The fourth map shows the results of this overlay, with the red meaning that across both maps areas like Strathcona and Grandview-Woodland are negatively affected in terms of occupational data. Similarly, the green areas near Shaughnessy, West Point-Grey and dunbar-Southlands show more resilient areas. Compared to the accumulated MCE map, regions near Strathcona appear to be commonly associated with significant negative impacts and regions near Dunbar-Southlands having the least.

Lastly, a diversity index (DI) was done across the four categories of occupations in order to see our diverse a DA is. Hypothetically, the more diverse a DA is the more able it is able to withstand COVID-19 related variables. We can see that the most diverse areas are near Kensington-Cedar Cottage and Renfrew-Collingwood, as well as the least diverse areas near Mount Pleasant, Downtown and Strathcona. Although the DI does not provide information on if the COVID-19 impacts would be negative or positive, it does mean that the blue shaded regions are the most likely regions to feel any impact if any, and the red regions the least. This is because if one occupation is hit hard and if the DA is diverse, it would be able to withstand the negative consequences from the other occupations that may not experience it.

Strengths

Our study examines the impacts of COVID-19 from not only a health perspective, but also economically from an individual to commercial standpoint.

Additionally, from the health perspective, weights to the MCE were attributed by mortality rate, including also exposure to PM2.5 which previous studies have found to correlate with increased COVID-19 related deaths.

Limitations

There are limitations to this study that need to be recognized. Firstly, the occupations are categorized by CHASS, and a wide array of occupations may fall under one category. Some occupations within the category may not be affected by coronavirus, but some may. The end result would be that there would be no significant impact. The results of most of the occupation-related data depends on how CHASS categorized the jobs, as well as how they measured employment rate especially for those who are self-employed.

Secondly, for the commercial industry areas at risk, there are multiple points where some areas may be publicly owned. This made it difficult to include these areas, such as private schools, so we decided to omit them. This may lead to a few errors in our analysis as we wanted to focus solely on commercial business areas. Additionally, being able to know which exact points are closed and to what extent they are economically impacted is difficult to measure.

Thirdly, we did not have access to pre-existing health conditions per DA such as those who are immunocompromised or have underlying heart conditions. These medical conditions have been shown to contribute to higher risk of severe illness from COVID-19 hence should be considered for a thorough health impacts analysis(CDC, 2019). Additionally, data of known COVID-19 cases would increase health risks due to community spread. Known cases that are publicly available are only by region which made it difficult to use for our final study (BC Government, 2020).

Additionally, for all of our MCE’s, if the weights that we apply to each layer is changed, there could be slight variations to the final product. In addition, a sensitivity analysis should be conducted to examine if a different normalization approach was used, how that would affect the results. Although we conducted both an equally-weighted analysis and weighted MCE based on AHP results for identifying physically at-risk regions and compared the difference by sight observation, a more sophisticated study requires precise comparisons.

Future directions

In order to combat the issue of change in weights, a sensitivity analysis should be done for each MCE layer in order to identify potential changes in the final map product if weights are changed. If there is possibility to, addition of COVID-19 presence cases would benefit the health populations at-risk layer, as well as addition of population density. An MCE for the occupation exploration could be done as well, weighted by their % job loss to identify the highest regions of occupation loss.

Conclusion

Overall, the maps provided insight on various factors and how COVID-19 may be impacting each one. Although we examined this issue through various techniques, some common results occurred in both the MCE and occupation exploration analysis. There seems to be more negative impacts near regions like Strathcona  with more resilient areas near Dunbar-Southlands. Although there are many limitations to this study, including the absence of COVID-19 case data and categorization of occupations and industries, insight on geospatial patterns through both an economic and health perspective and provide benefits for policy and mitigating negative impacts of the coronavirus. This can help with providing targeted help to specific regions that may require more help than others due to the specialization or other variables that the DA has.

Data sources

  • CHASS data by DA including age, occupation and income spent on housing here.
  • DA border file provided by Statistics Canada here.
  • CanMap businesses data here.
  • Restaurants, bars and other businesses provided by Statistics Canada here.
  • Postal code boundaries provided by Statistics Canada here.
  • Translink transit GIS data used for estimating PM2.5 location provided by UBC Abacus here.

References

B.C. COVID-19 response update. (March 23, 2020). Retrieved from https://news.gov.bc.ca/releases/2020HLTH0102-000540

Bharti, B. (2020, May 1). Where we stand in Canada: Reopenings by province and territory from coronavirus lockdown. Retrieved from https://nationalpost.com/news/canada/reopening-canada-provinces-ontario-quebec-saskatchewan-alberta

CDC. (2020, April 15). People Who Are at Higher Risk for Severe Illness. Retrieved from https://www.cdc.gov/coronavirus/2019-ncov/need-extra-precautions/people-at-higher-risk.html

Centre of Disease Control. (2020). About COVID-19. Retrieved from http://www.bccdc.ca/health-info/diseases-conditions/covid-19/about-covid-19

COVID-19 (Coronavirus) Business Communications and Support Office. (2020). City of Vancouver. Retrieved from https://vancouver.ca//home-property-development/covid-19-coronavirus-support-for-local-businesses.aspx#redirect

Crawford, T. (2020, April 9). COVID-19: B.C. loses more than 132,000 jobs in March. Retrieved from https://vancouversun.com/news/covid-19-b-c-loses-more-than-132000-jobs-in-march/

Evans, P. (2020, April 9). Canada has already lost more than a million jobs to COVID-19 and the worst is yet to come | CBC News. Retrieved from https://www.cbc.ca/news/business/canada-jobs-march-covid-19-1.5527359

Government BC. (2020, April 24). List of COVID-19 Essential Services. Retrieved from https://www2.gov.bc.ca/gov/content/safety/emergency-preparedness-response-recovery/covid-19-provincial-support/essential-services-covid-19

International comparison of urban air quality. (2016). Government of Canada. Retrieved from:

https://www.canada.ca/en/environment-climate-change/services/environmental-indicators/international-comparison-urban-air-quality.html#r1

National Geographic. (2020, May 1). Mapping the global spread of the coronavirus. Retrieved from https://www.nationalgeographic.com/science/2020/03/mapping-coronavirus-infections-across-the-globe/

Statistics Canada. (2020, April 9). Add/Remove data. Retrieved from https://www150.statcan.gc.ca/t1/tbl1/en/cv.action?pid=1410031001#timeframe

Wu, X; Nethery, R; Sabath, M; Braun, D; Dominici, F. (April 5, 2020). Exposure to air pollution and COVID-19 mortality in the United States. Retrieved from: https://projects.iq.harvard.edu/files/covid-pm/files/pm_and_covid_mortality.pdf