
Hi Everyone,
Found this really interesting infographic on Smartphone Apps and their integration into education. Thought this was especially relevant since we are now moving into using IPads into the classroom, mobile apps for Game based learning and numerous other apps that can be used with an educational spin or relevance. With the growing number of uses of Apps we are moving towards helping our students use Apps for educational purposes.
It is interesting to note that only in 2012, within the U.S. more than 25 million apps were downloaded so within the time frame of two additional years the growth in that number would be exponential. There is also a growing number of students who use apps to study and learn curriculum material via their smartphones. This also lends to the idea of medical schools now using apps within their curriculum and related to cloud based learning that group 9 addressed with their project in relation to medical relevancy.
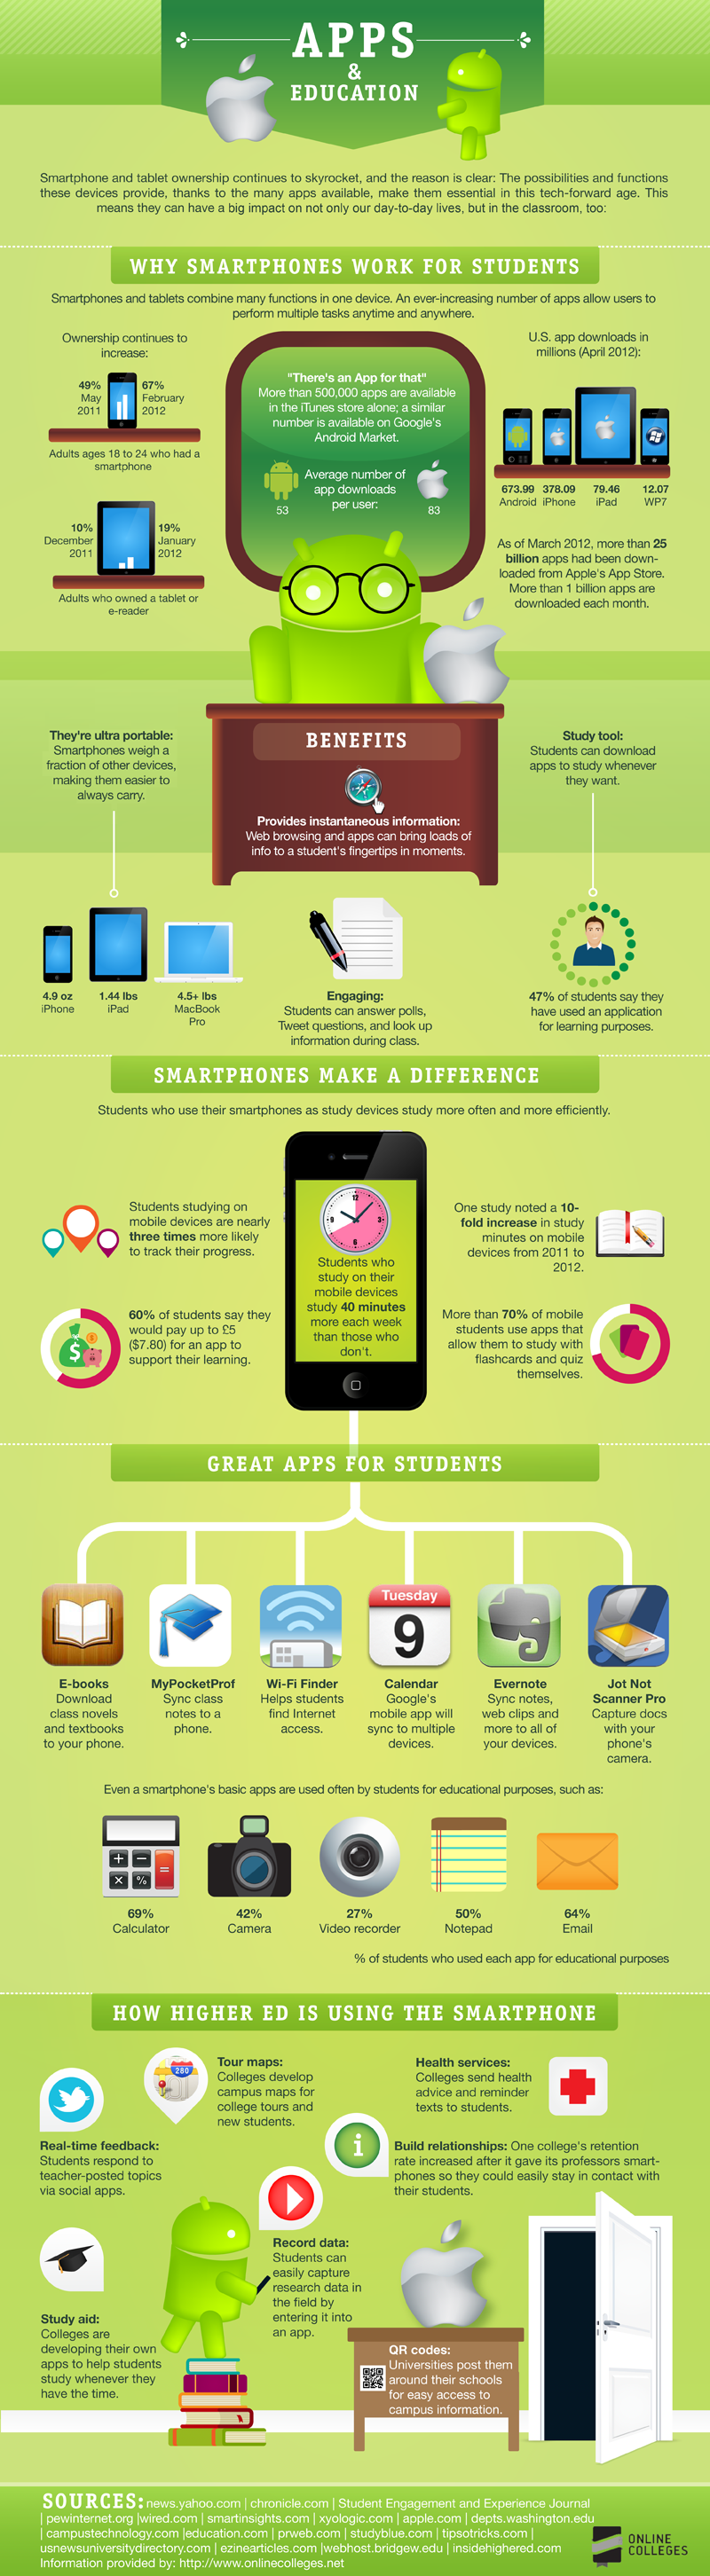
Provided by onlinecolleges.net Infographic on use of smartphone apps
Thanks for posting this. I saw a few similar versions of emphasizing the role of smartphones as BYOT/BYOD devices for education. It is good infographic, though the ownership data stats are from 2011/2012, and seem bit outdated from today’s perspective. In a year or two, many things change/update on the device technology/app horizon. Anyway, the infographic is quite useful in picturing the potential of smartphones in education.
Regards,
Milorad
Hi Milorad,
Thank you for your comment and thoughts. Yes, there are many other infographics on this particular topic. I’d agree that the statistics are a bit outdated but demonstrates the growing use of BYOT/BYOD within our educational contexts. I am sure that the stats have grown exponentially in the past two years especially now since I understand from classmates many schools and districts are using iPads within their classrooms and we are all implementing the use of apps in some form of educational purpose. Visually, I find infographics a great way to understand statistical data since I am more of a visual learner.
Cheers,
Leah