Data sources
The data used for this analysis came from 4 different sources:
-
- Data BC – for base info such as roads and park boundaries.
- BC Parks – for statistics of BC provincial parks in the KO region
- Parks Canada – for statistics of national parks in the KO region
- Plugshare – for the locations of existing EV charging stations
Data preparation
The data from Data BC was readily downloadable in shape files, however the data from the other sources was not. Before beginning analysis, a significant amount of time was spent converting the available data into useable formats.
The BC Parks report was published online as a PDF document, and the table of statistics was not in one file. This data was copied over to an Excel worksheet and edited to remove irrelevant information.
The Parks Canada data was posted on various pages of their website, and was summarized in the same Excel worksheet as the BC parks report data.
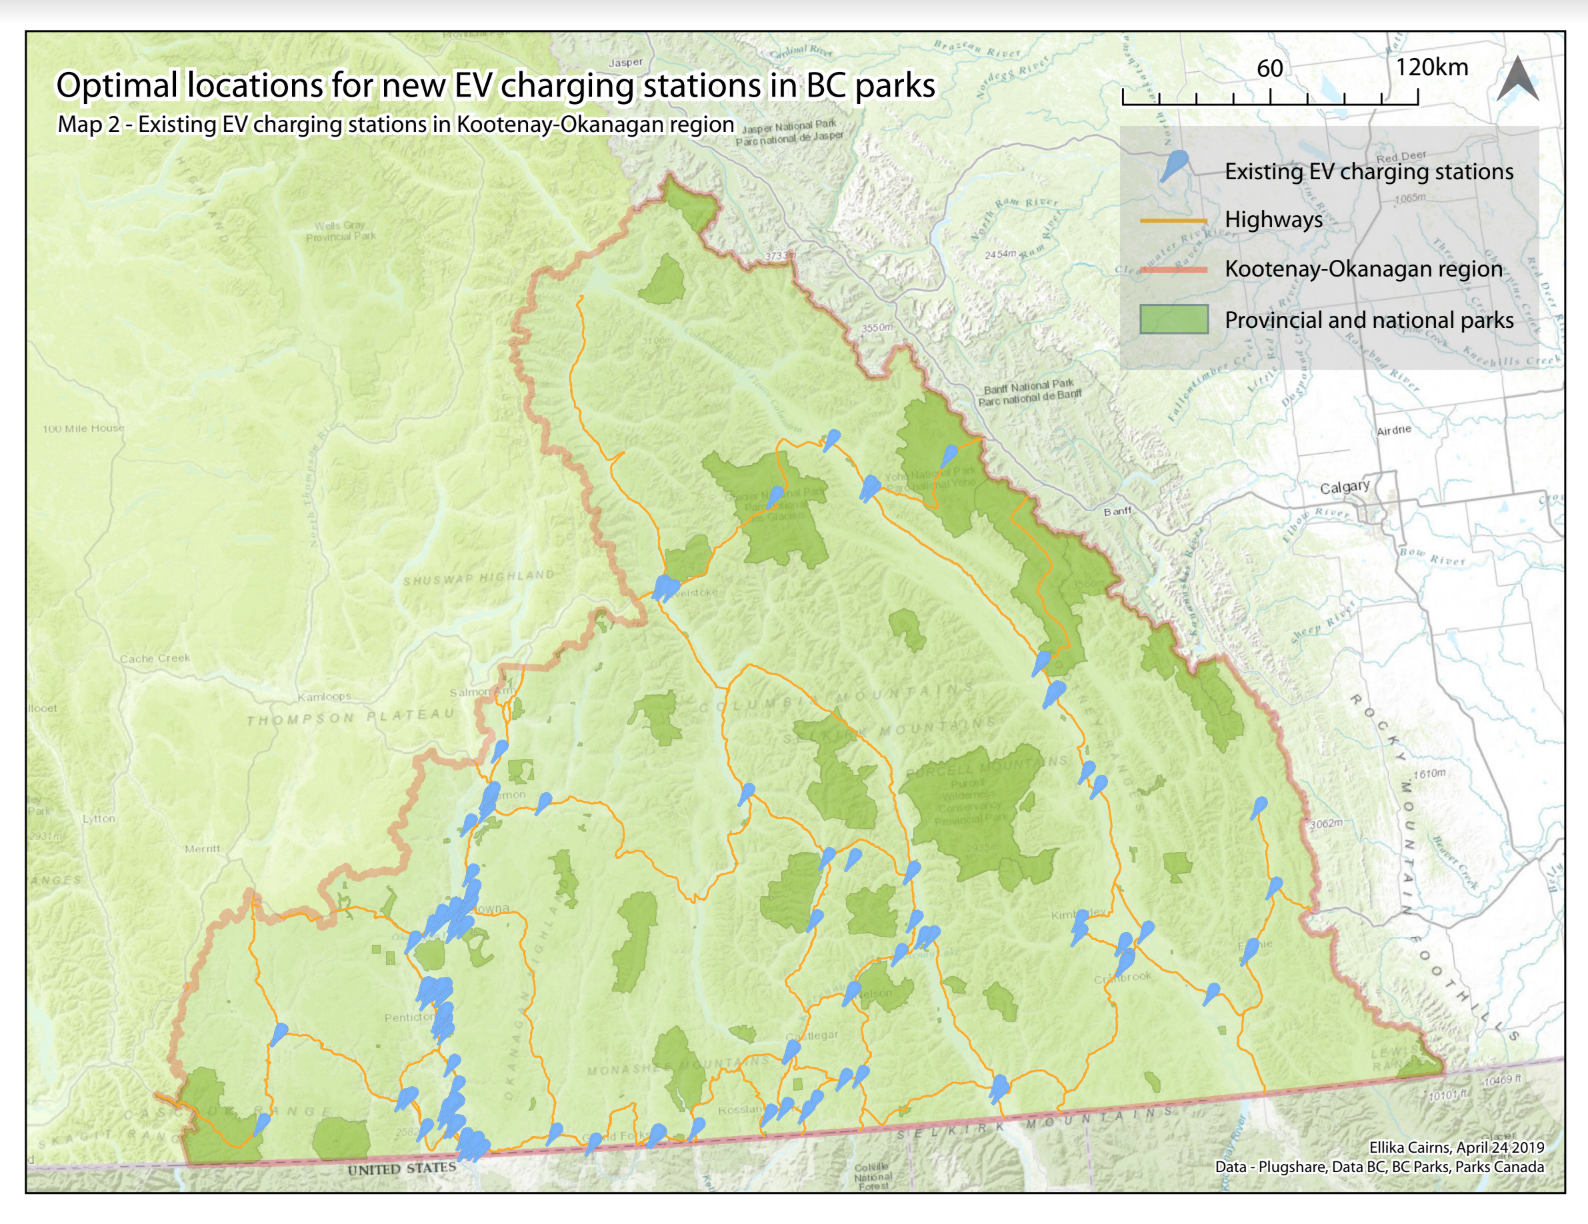
The Plugshare data was only available as points on their interactive online map, and not downloadable. Therefore I plotted each of the individual 191 locations of existing EV charging stations on my own Google Map, which was then downloadable as a KML file. This file was then converted into a shape file, which could be uploaded to ArcMap. These points have been indicated on Map 2, below:
Data cleaning
Once all the information was entered in an Excel worksheet and ArcMap, there was some data cleaning that had to be done.
First, there were two parks from the shape file used in ArcMap that were divided into smaller sub-sites, however the BC Parks report did not make this distinction. For these sites, the parks in ArcMap were joined together to match the BC Parks report.
Some data on revenue was also either recorded as zero or was just missing from the BC Parks report. In the case of zero revenue, this was due to the park only being open for day-use and not camping, and therefore it appears that BC Parks does not collect any fees for the day-use of these parks . There was also missing data from park usage. It was not explained in the report, but after researching these parks, it appears likely the revenue parks are not monitored due to their small size. These parks had to be excluded from analysis due to the lack of information.
Several parks were also only accessible by boat, and therefore not relevant to this analysis. These were taken out of the worksheet (ex. Drewry Point Park or Okanagan Mountain Park). Unfortunately BC parks did not note whether parks were only accessible by foot in their report, and therefore there may be some error in this project due to this factor.
Formal references
Government of BC. Data BC. Accessed Apr 16 2019 via data.gov.bc.ca
BC Parks. Government of BC “BC Parks 2015/16 Statistics Report” Reports and Surveys (2016) via env.gov.bc.ca/bcparks
Parks Canada. Government of Canada. “Parks Canada Agency Reports” Reports (2016) via pc.gc.ca
Recargo. PlugShare. Accessed Apr 16 2019 via plugshare.com