Lab 2
Introduction to Geographically Weighted Regression
In this lab, we explored geographically weighted regression (GWR) and ordinary least squares modelling. The following is a brief summary of the lab and my results.
Overview
Geographically-weighted regression (GWR) modelling is a type of statistical analysis that attempts to take the variability of spatial relationships across a study region into account (Castree et al., 2013). It can be a powerful tool, employed in a variety of different contexts. This paper introduces GWR models by briefly outlining how they work and the results they provide. Then, a lab report of a GWR modelling analysis is detailed to exemplify specific application GWR in geographical studies. The lab report summaries the process, results, and conclusions of an analysis of the relationship between a child’s social score and several variables related to the individual child and their larger neighborhood. This paper concludes with a discussion of the numerous other contexts of geographical studies that GWR modelling can be used in, indicating specific examples of peer-reviewed research.
Results
The results of this analysis indicated that children’s social score had a significant relationship with several variables, particularly gender, language abilities, and average income. It was shown that children who were male, had higher language abilities, and lived in neighborhoods with higher than average income levels had higher social scores. Thus, the most socially disadvantaged children were determined to be female, had lower language abilities, and lived in neighborhoods with lower than average income. Since gender had such a strong significance on children’s social scores, it is recommended that schools, community program directors, city officials design social activities that specifically target young girls. Activities that increase their language abilities may be quite beneficial. Furthermore, assuring that access to these social activities, schools, and community centres is evenly distributed across the city and does not greatly fluctuate based on average neighborhood income is important.
The grouping analysis showed that there was a significant contrast in groups based on characteristics of enumeration units from the east and west sides of Metro Vancouver. Group 1 dominated the east side, while Group 4 dominated the west. Group 1 had characteristics of lower than median income, higher than median rates of families that had lone parents, higher than median rates of families that were 4 or more people, and higher than median rates of families that spent more than 30 hours on childcare. Group 4 had characteristics of higher than median income, lower than median rates of families that had lone parents, lower than median rates of families that were 4 or more people, and lower than median rates of families that spent more than 30 hours on childcare. Essentially, Group 1 and 4 had opposite characteristics. In visual comparison of Figures 6-8 against Figure 5, the patterns observed for high or low values of gender, language abilities, and average income across Metro Vancouver did not appear to match up significantly strongly with any individual group. However, since Group 1 contains characteristics that likely more negatively impact children’s social scores and is so strongly prevalent in specific neighborhoods, it is recommended that efforts to improve social scores are focused on the eastern side of the study area.
Furthermore, the results of the OLS and GWR models showed better explanation in the eastern side of the study area, which indicates that the analysis of results and recommendations for improving social scores in these areas are likely more valid for this region. It also means that determining an overall trend and recommendation for the entire Metro Vancouver region is difficult, since the models functioned significantly better in these specific areas, and not as well on the western side of the study region. Nonetheless, it was generally clear that children’s social scores are spatially variable, and non-stationary. Thus, using a GWR model in this analysis was useful and provided fairly significant results.
Maps
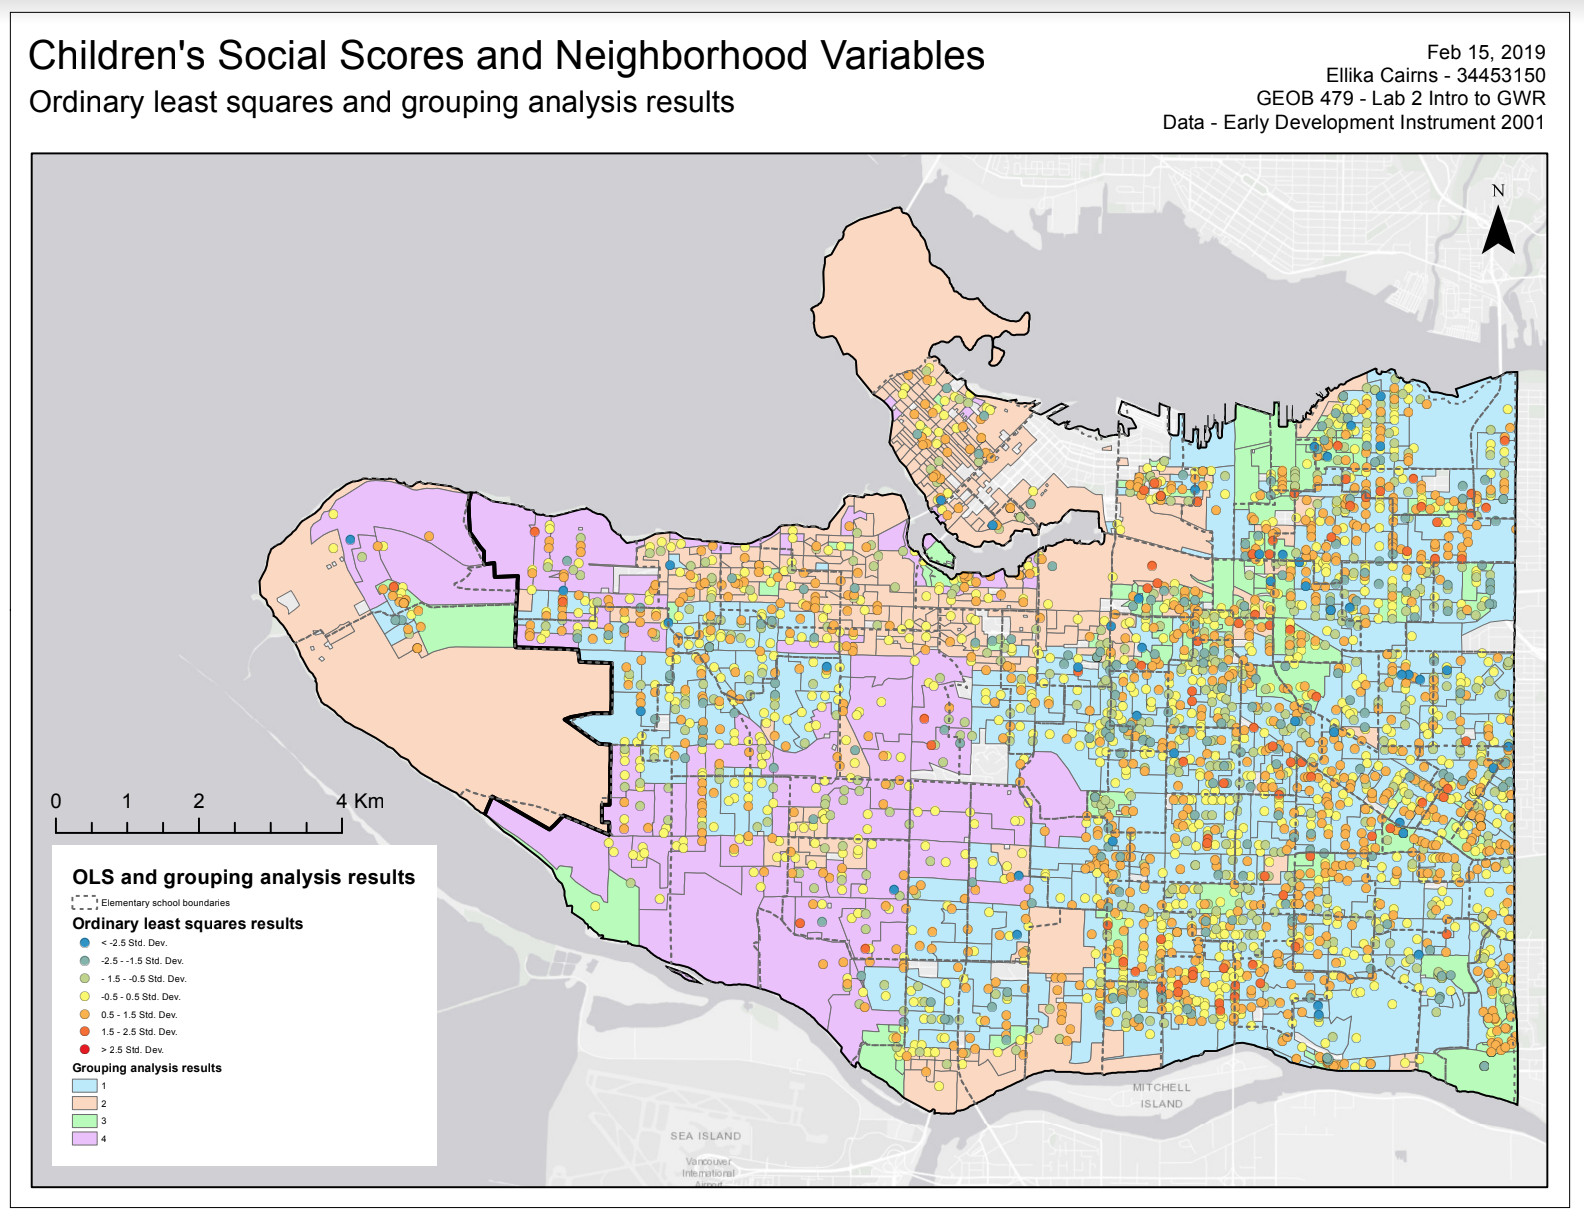
Ordinary least squares and grouping analysis results
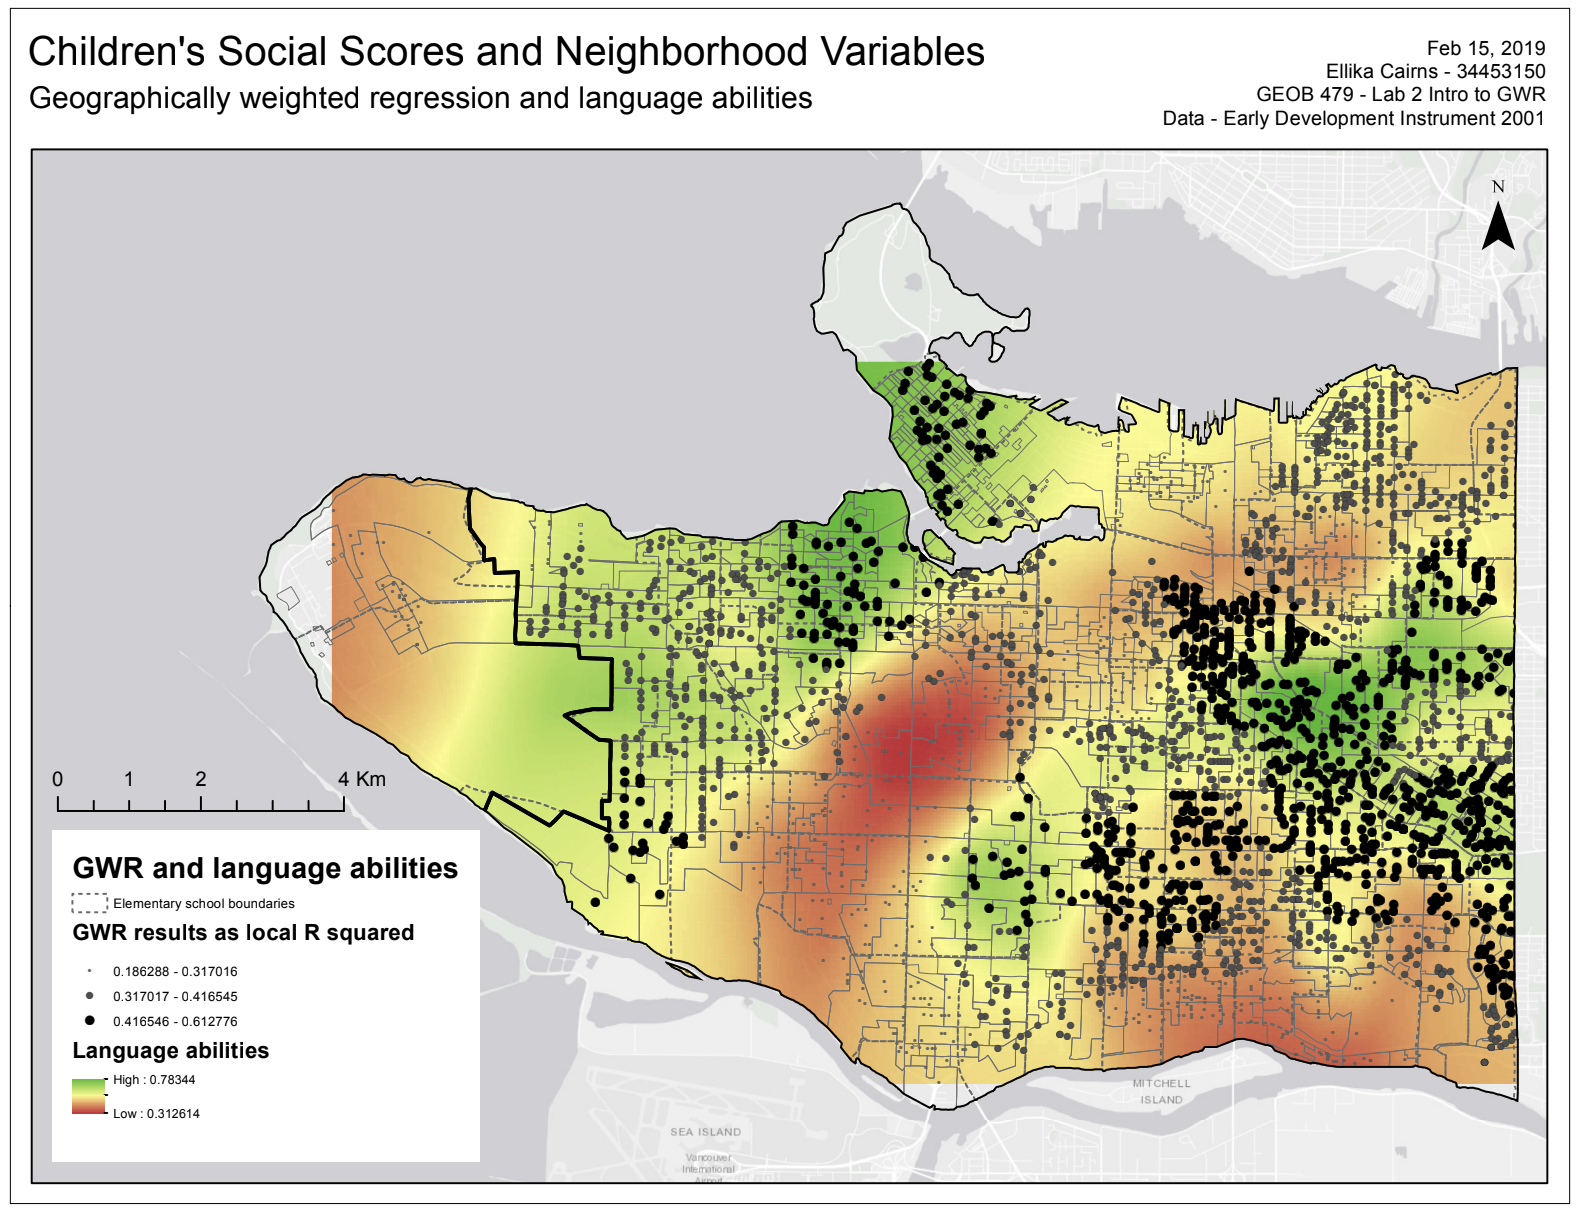
Geographically weighted regression and language abilities
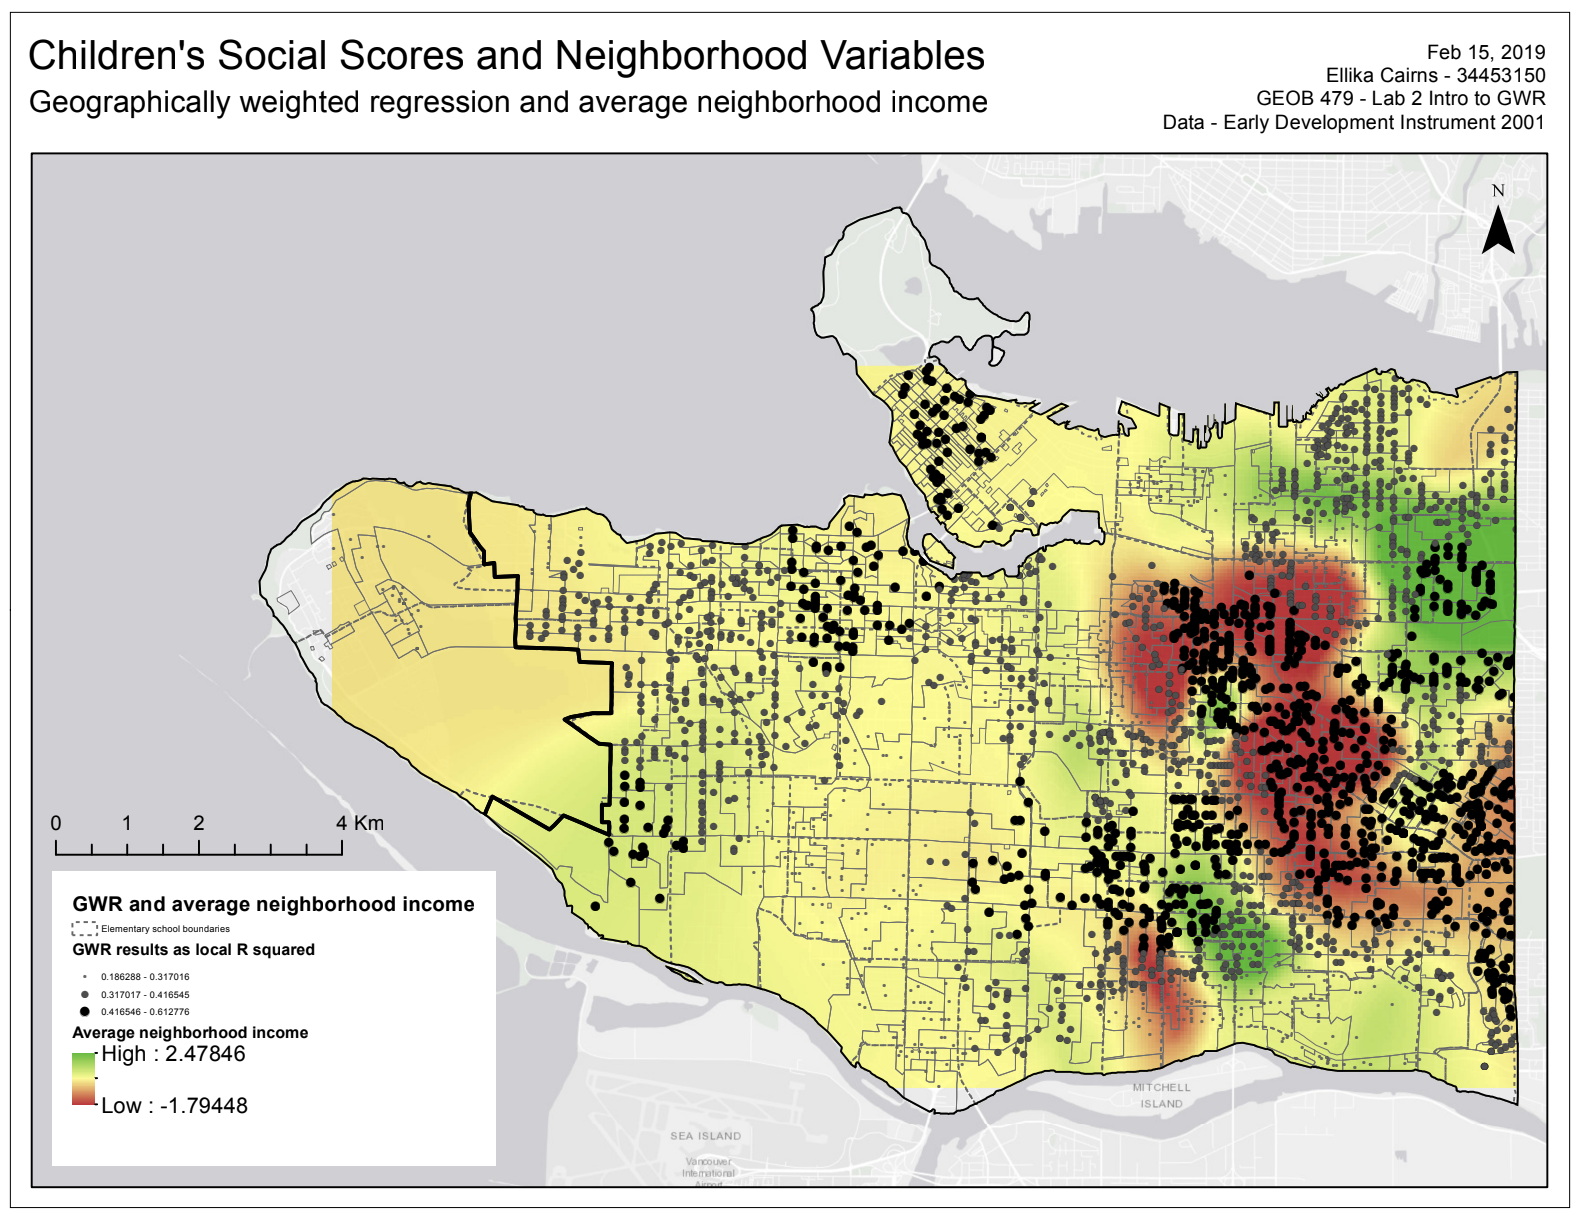
Geographically weighted regression and average neighborhood income
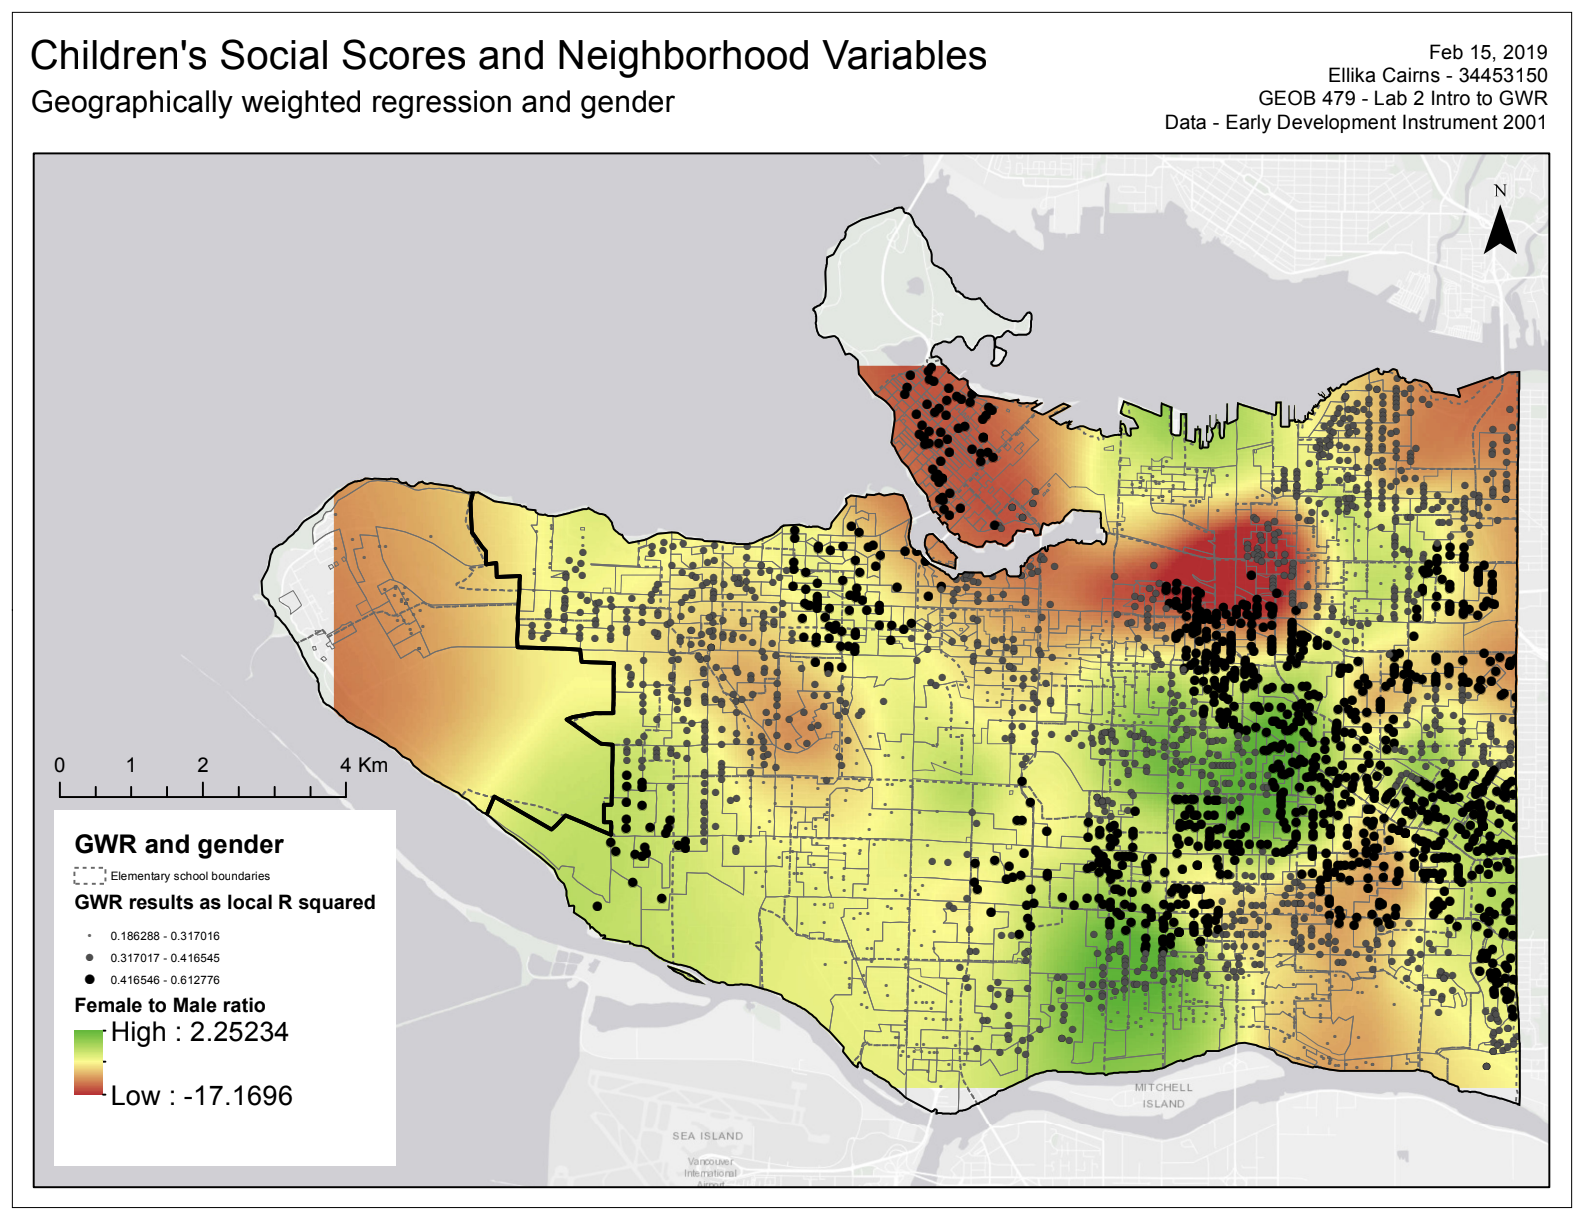
Geographically weighted regression and gender
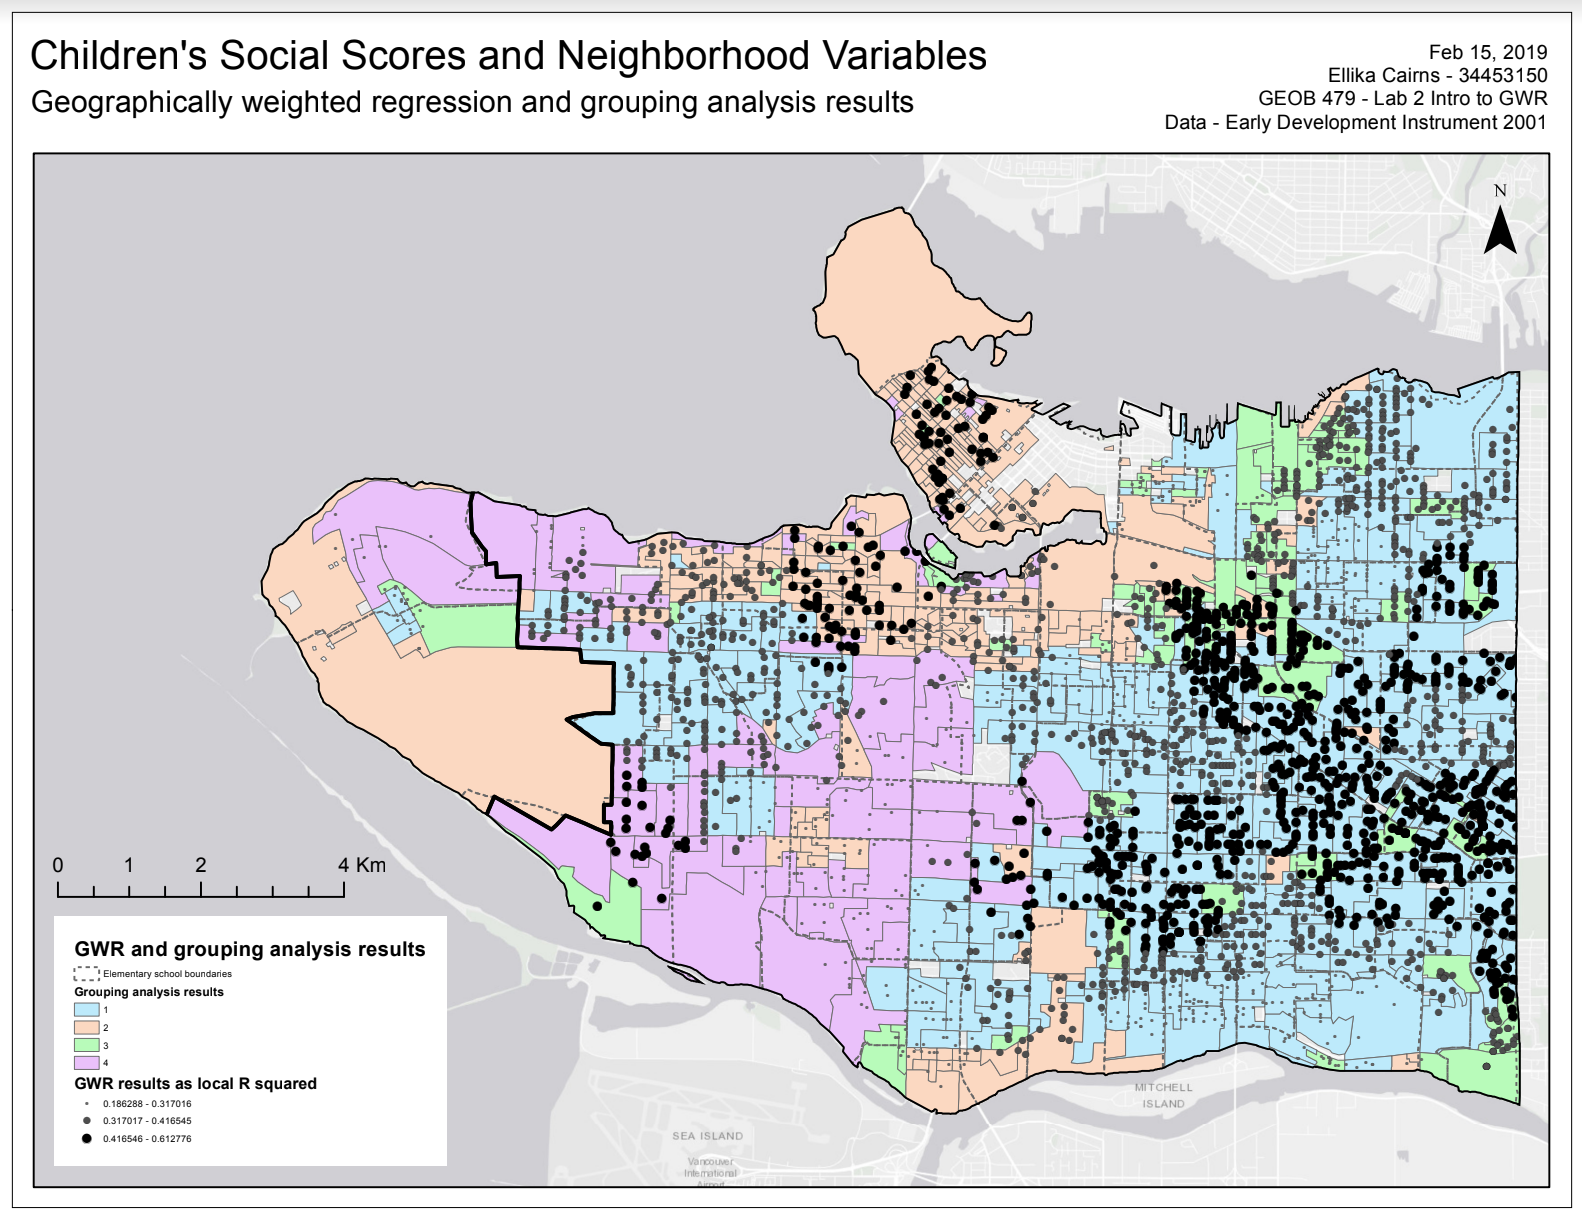
Geographically weighted regression and grouping analysis results