Lab 1
Exploring Fragstats
For this lab we used Fragstats metrics to explore how the landscape around Edmonton has changed over time (1966 to 1976). The following is a summary of the lab, a discussion of my results, and important maps / tables.
Overview
This report was conducted to provide the City of Edmonton with information to be used as a reflection on the influence of past urban planning and development decisions, as well as to highlight the importance of prioritizing outdoor recreation areas and natural habitat in future decisions. The report consisted of a statistical analysis of Edmonton’s land use over a period of ten years, from 1966 to 1976. The results showed that the city of Edmonton experienced fairly rapid urban development, which may have contributed to habitat fragmentation for animal and plant species, as well as reduced ease of accessibility to outdoor recreation areas for residents. Recommendations for future sustainable planning include to prioritize habitat connectivity and implement public infrastructure to increase accessibility across the city as it becomes more urbanized.
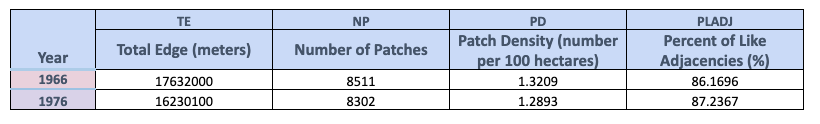
Results
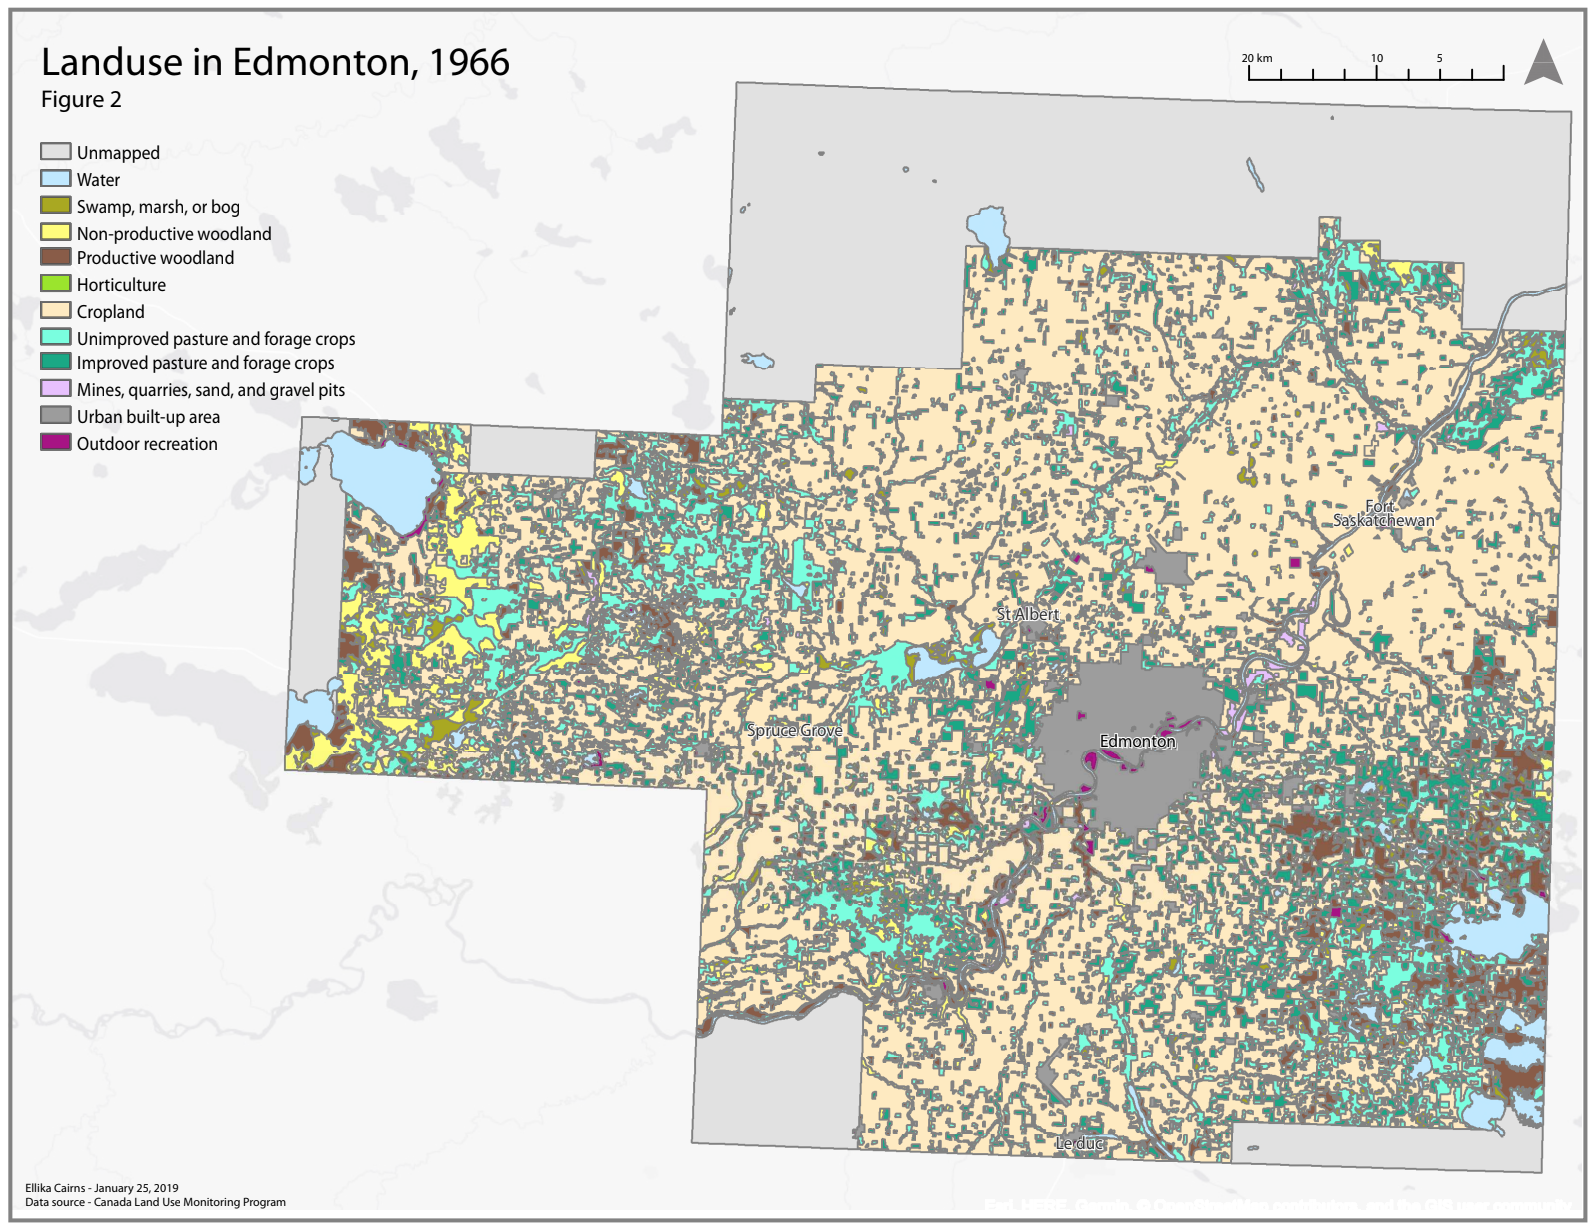
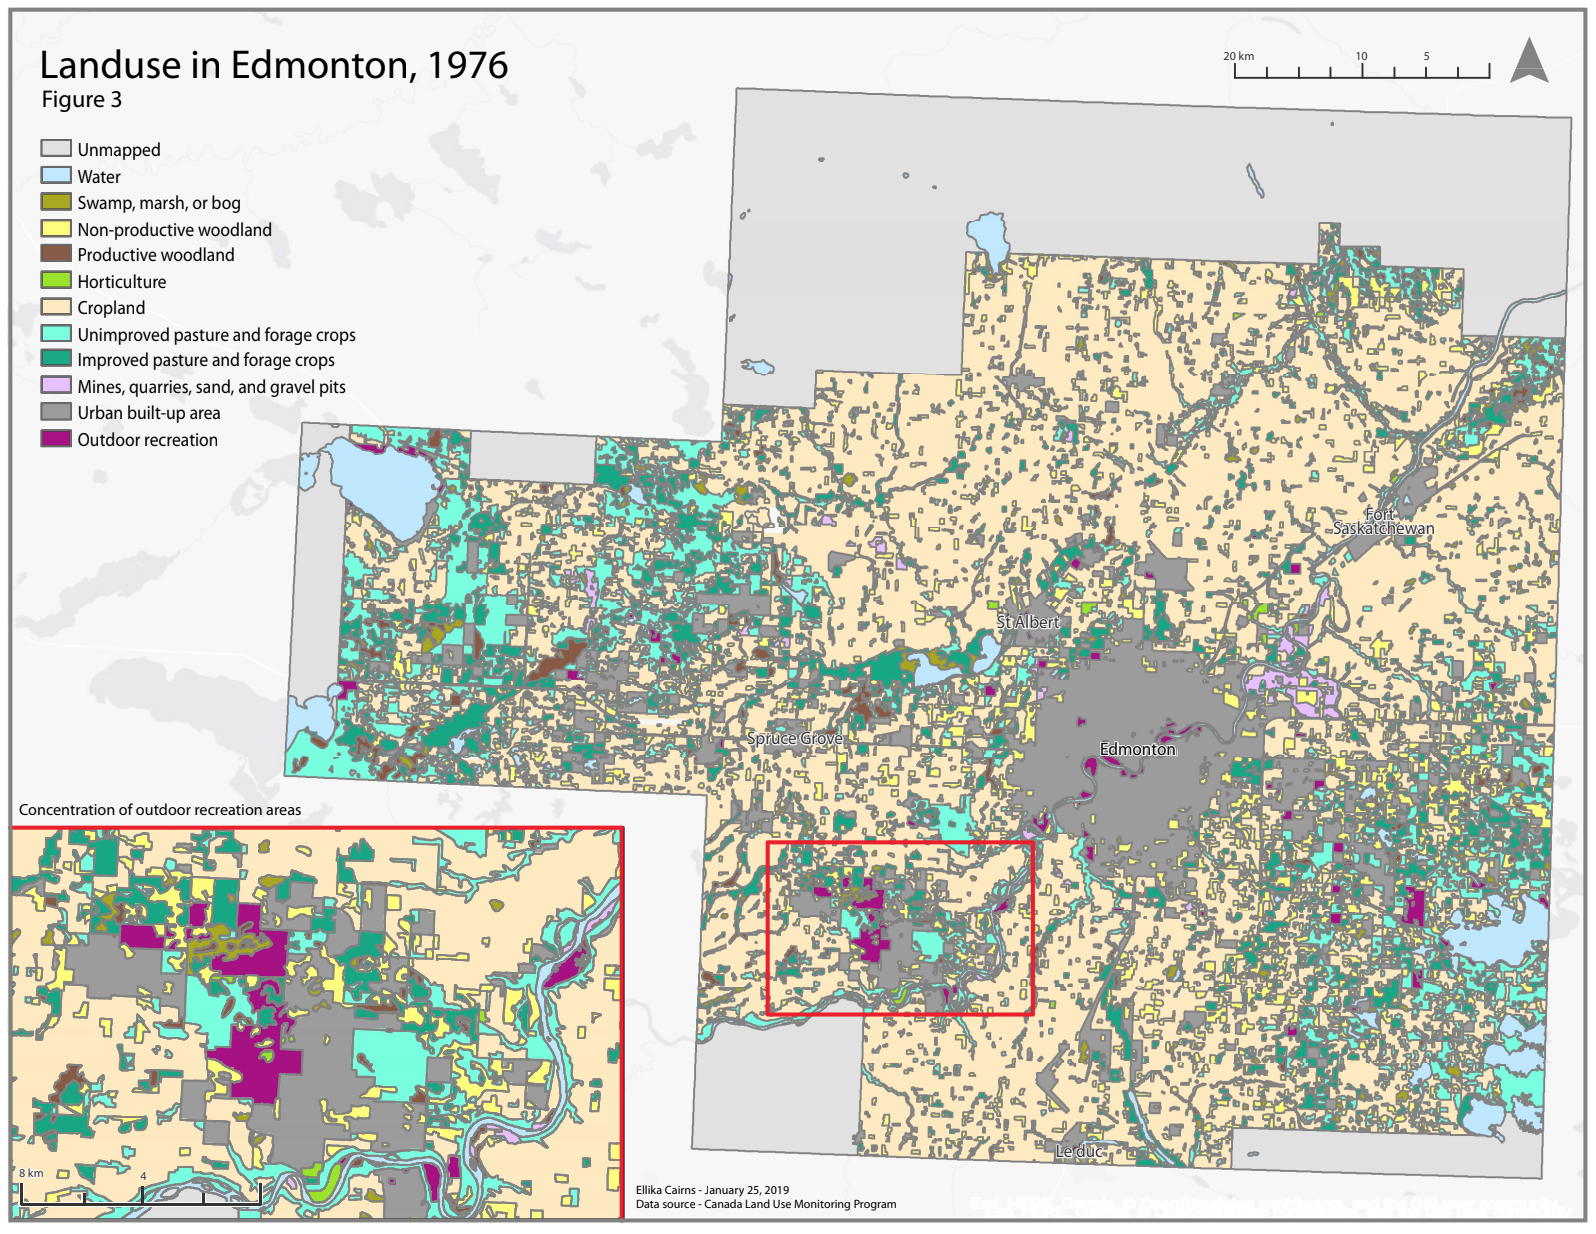
The changes in land use type observed in the results of this analysis from 1966 to 1976 in Edmonton strongly imply a growing urban population and a focus on urban infrastructure development. The total of urban built-up area increased by 180.64% from 1966 (with 19 596 hectares) to 1976 (with 54 995 hectares).
The changes in outdoor recreation from 1966 (1735 hectares) to 1976 (4582 hectares) demonstrated a 164.09% increase. This was a positive sign that the City of Edmonton has incorporated sustainable urban development in their planning and decision making processes. However, the total number of patches of outdoor recreation areas decreased from 80 to 44 over this time period, which indicated that though there may be larger parks or beaches areas, there are fewer of them in total. Furthermore, when the spatial distribution of the outdoor recreation areas on the 1976 map was analyzed (Figure 2), it could be seen that this land use type was concentrated in certain areas and not others (see inset map in Figure 2). The Transition Matrix showed changes in outdoor recreation areas were predominantly from a conversion to urban built-up areas (14.10%), which was expected but increased concern for the quality of natural habitat.
The largest relative land use change observed from 1966 to 1976 was of ‘horticulture’. The total area of horticulture grew by 3160.87% from 1966 (with 23 hectares) to 1976 (with 750 hectares). Though this is a large relative increase, the absolute total area only increased by 697 hectares, making it less notable than the other land use changes. It may have been due to an increase in horticulture interest of the residents of Edmonton, development of several large poultry farms, or a result of governmental policy changes that promoted the practice.
Also notable from the results of this report is the 132.41% increase in the total area of non-productive woodland, from 19 086 hectares in 1966 to 44 358 hectares in 1976. The total number of patches also increased by 319.73%, from 517 in 1966 to 2170 in 1976. This was unexpected in conjunction with the increase in urban development during this time period, since it was predicted that “non-productive” land would be converted to more urban, economically “productive” land uses, and therefore would have had a reduction in total area. However, in analyzing the changes in the spatial distribution of the non-productive woodland on the maps, it can be seen that the patches of non-productive woodland dramatically changed location, became much more spread out across the city, and scattered amongst urban built-up areas. This was reflected in the change in connectance index, from 0.4251 in 1966 to 0.1537 in 1976, which indicated that though the total area and number of patches increased, their connectance decreased. The Transition Matrix indicated that the majority of the converted non-productive woodland was from productive woodland. The conversion to scrub land from more productive woodland indicated a decrease in habitat quality, although further investigation is needed to determine the habitat quality of the scrub areas.
The other land use types that changed fairly significantly from 1966 to 1976 were “mines, quarries, sand, and gravel pits” (85.37% increase), “productive woodland” (74.28% decrease), and “swamp marsh or bog” (45.08% decrease). These are indicative of urbanization, since there is an increase in industrial areas and decrease in natural habitat. The changes in “improved pasture and forage crops” (3.41% decrease), “cropland” (7.57% decrease), and water areas (0.07% increase) over this time period were fairly insignificant for the purpose of this report.
Maps
Tables
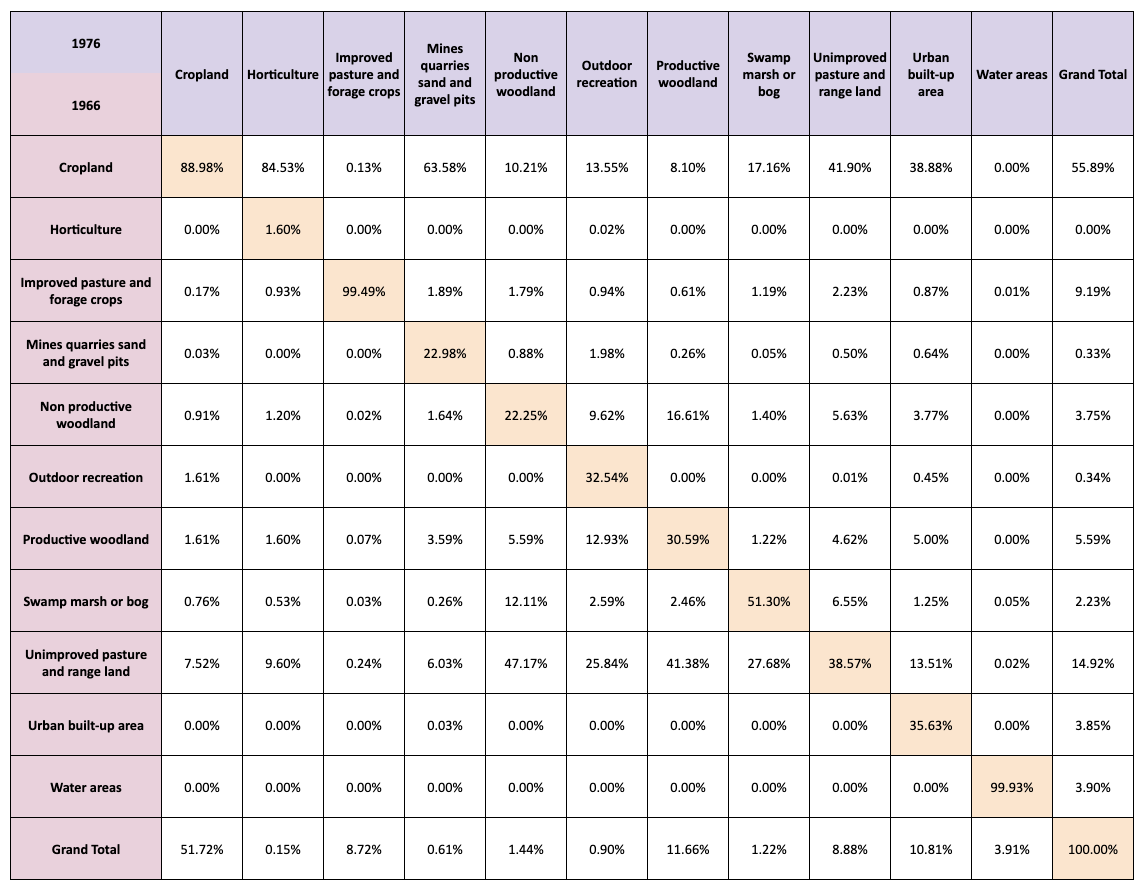
Transition matrix
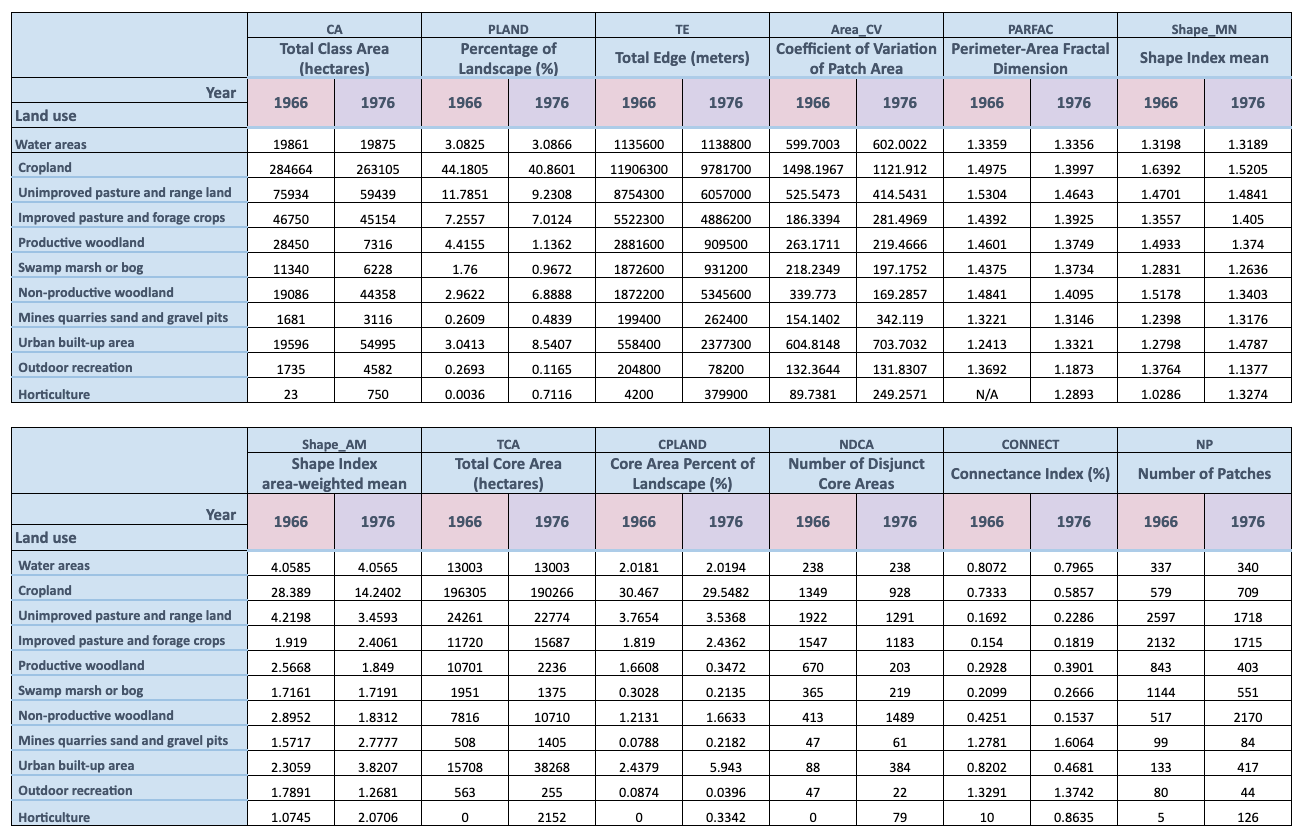
Changes in class level
Changes in landscape