Maps & figures
The following is a list of all the tables, figures, and maps related to this project. Links to the relevant maps are provided during methodology and discussion of results. This page is for reference only.
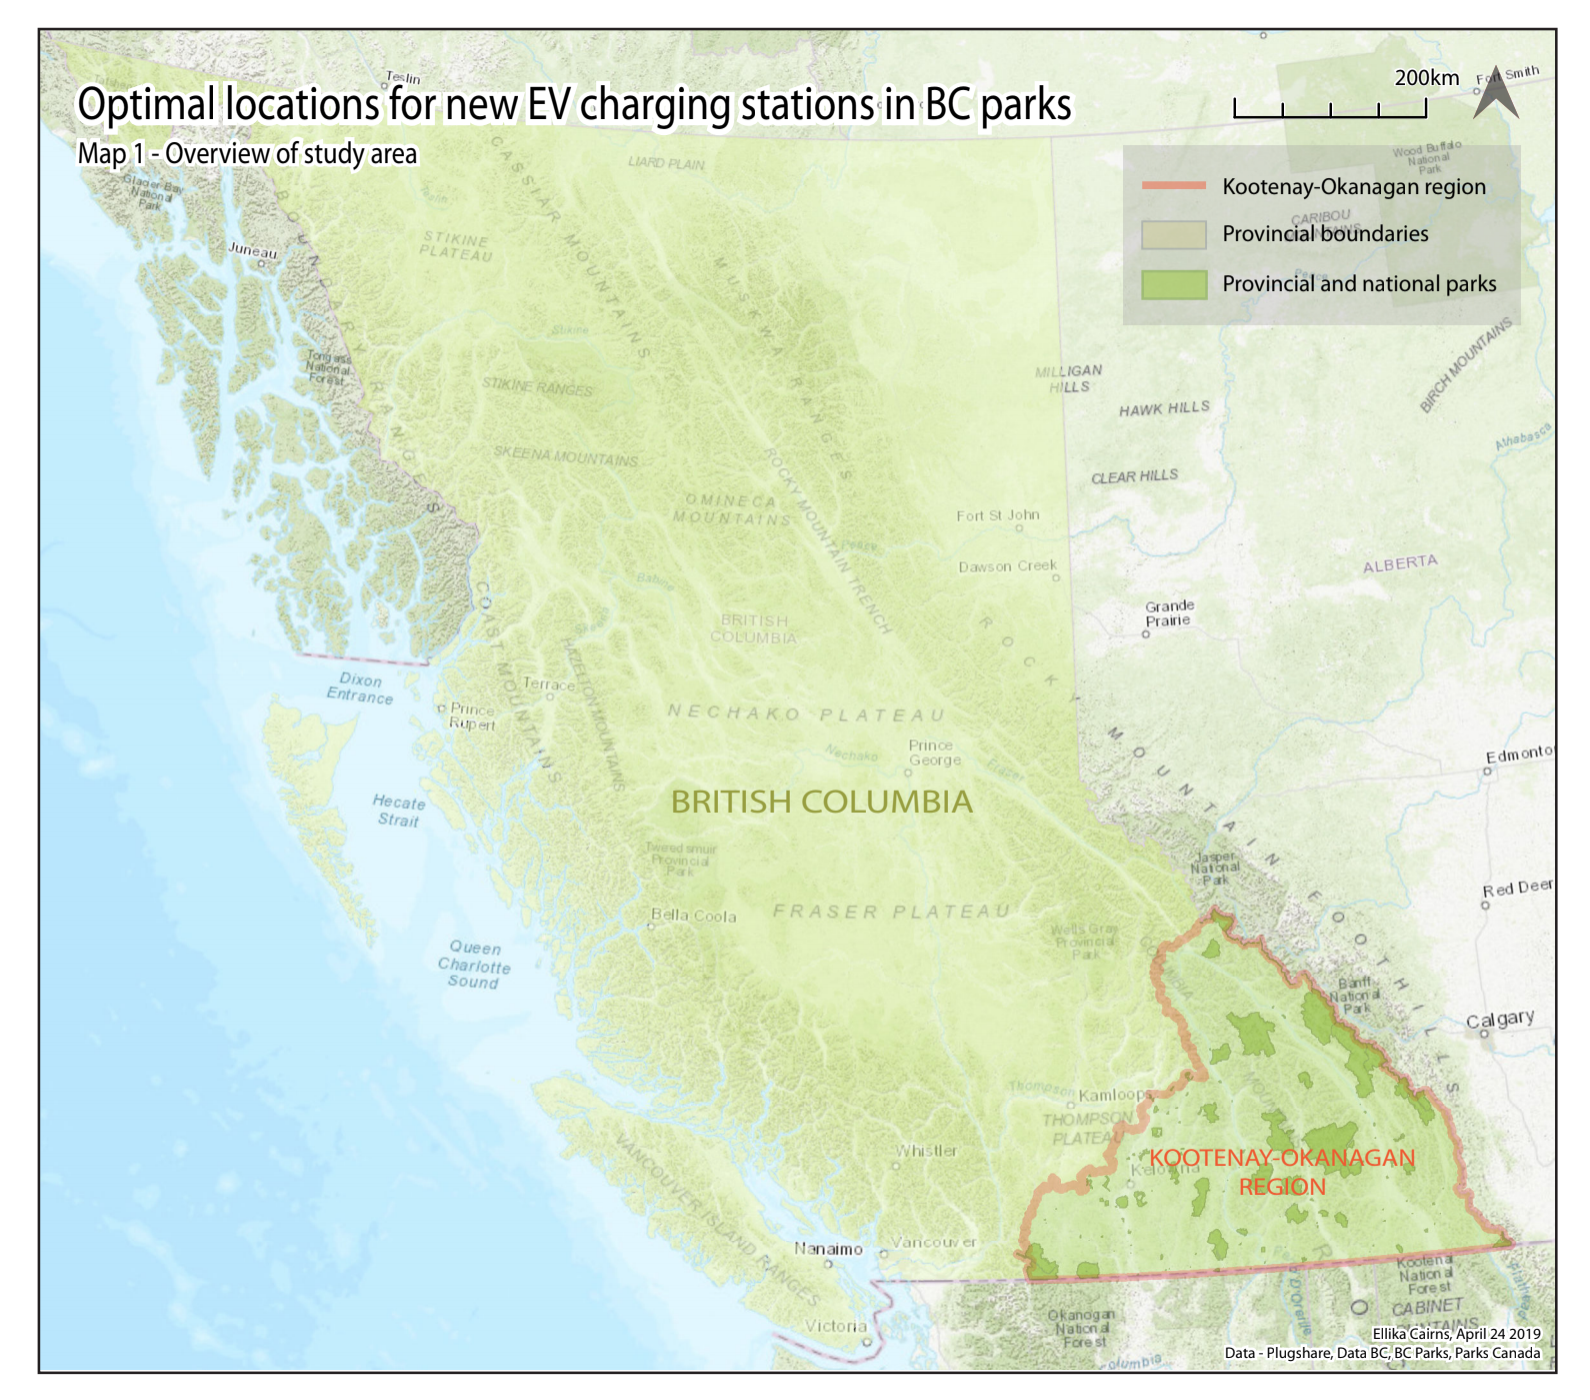
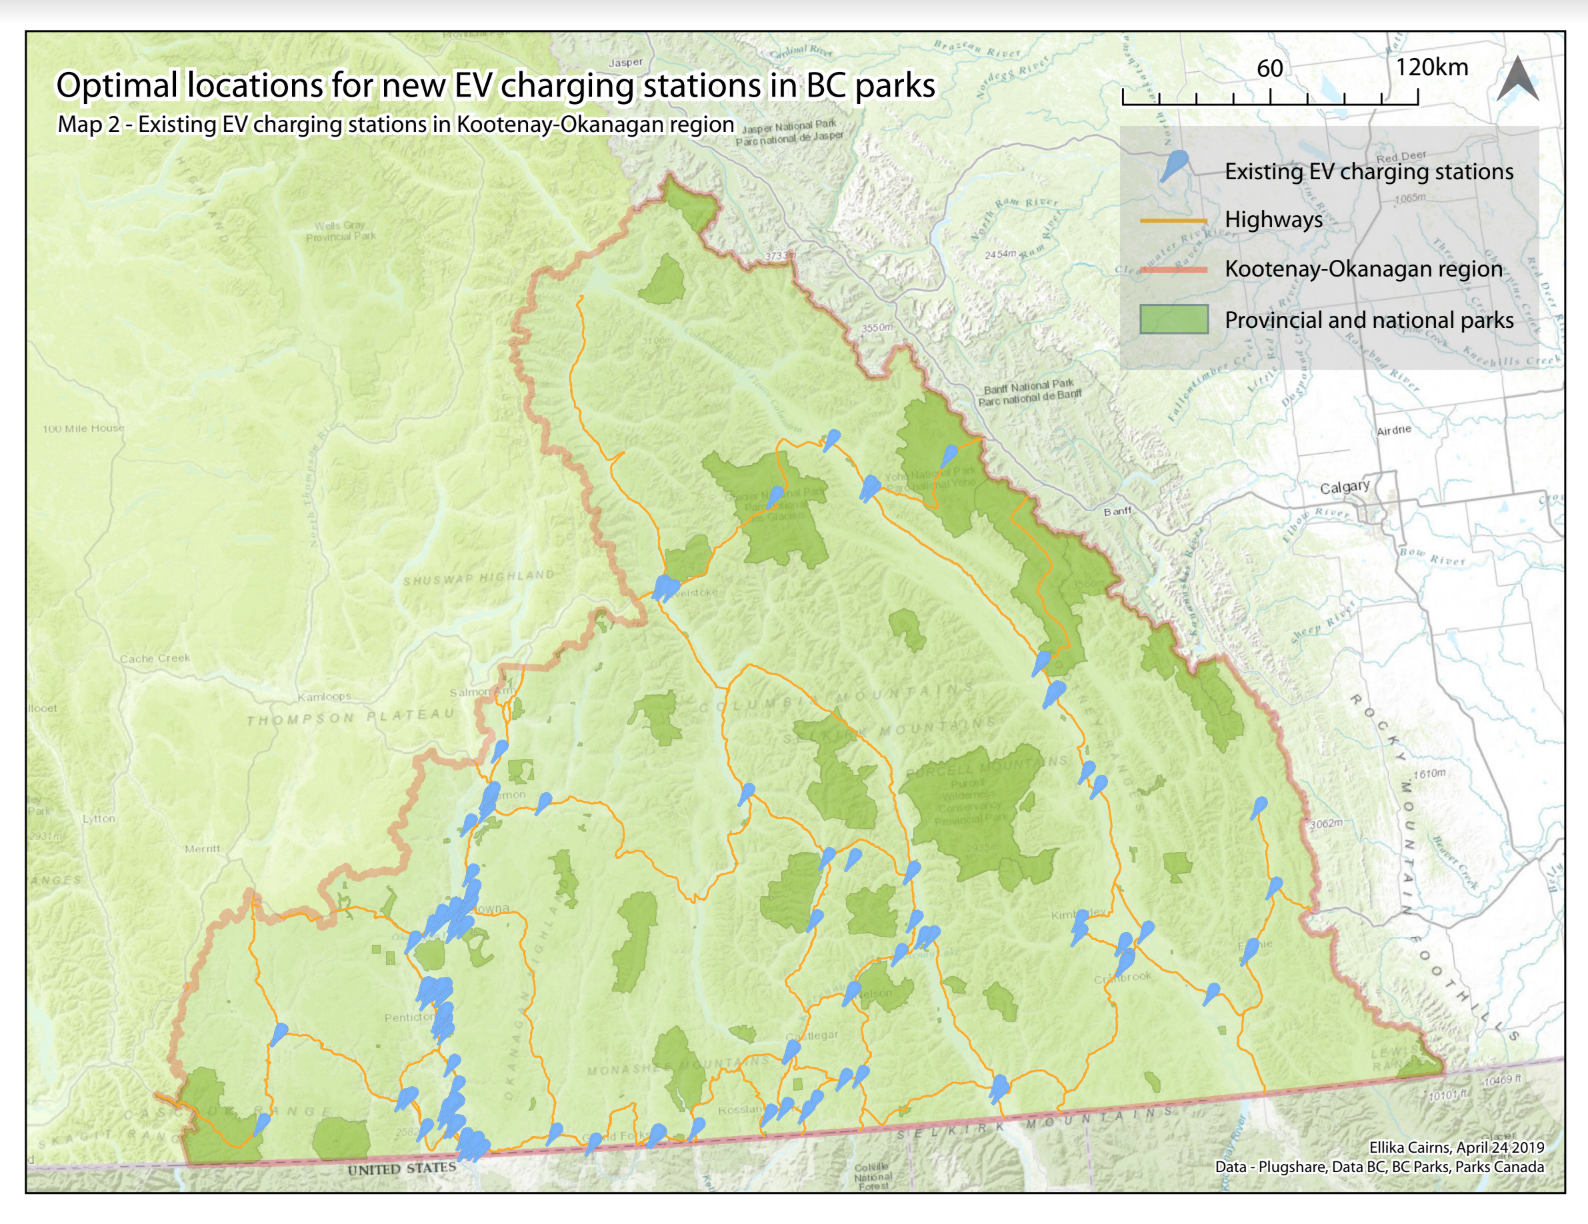
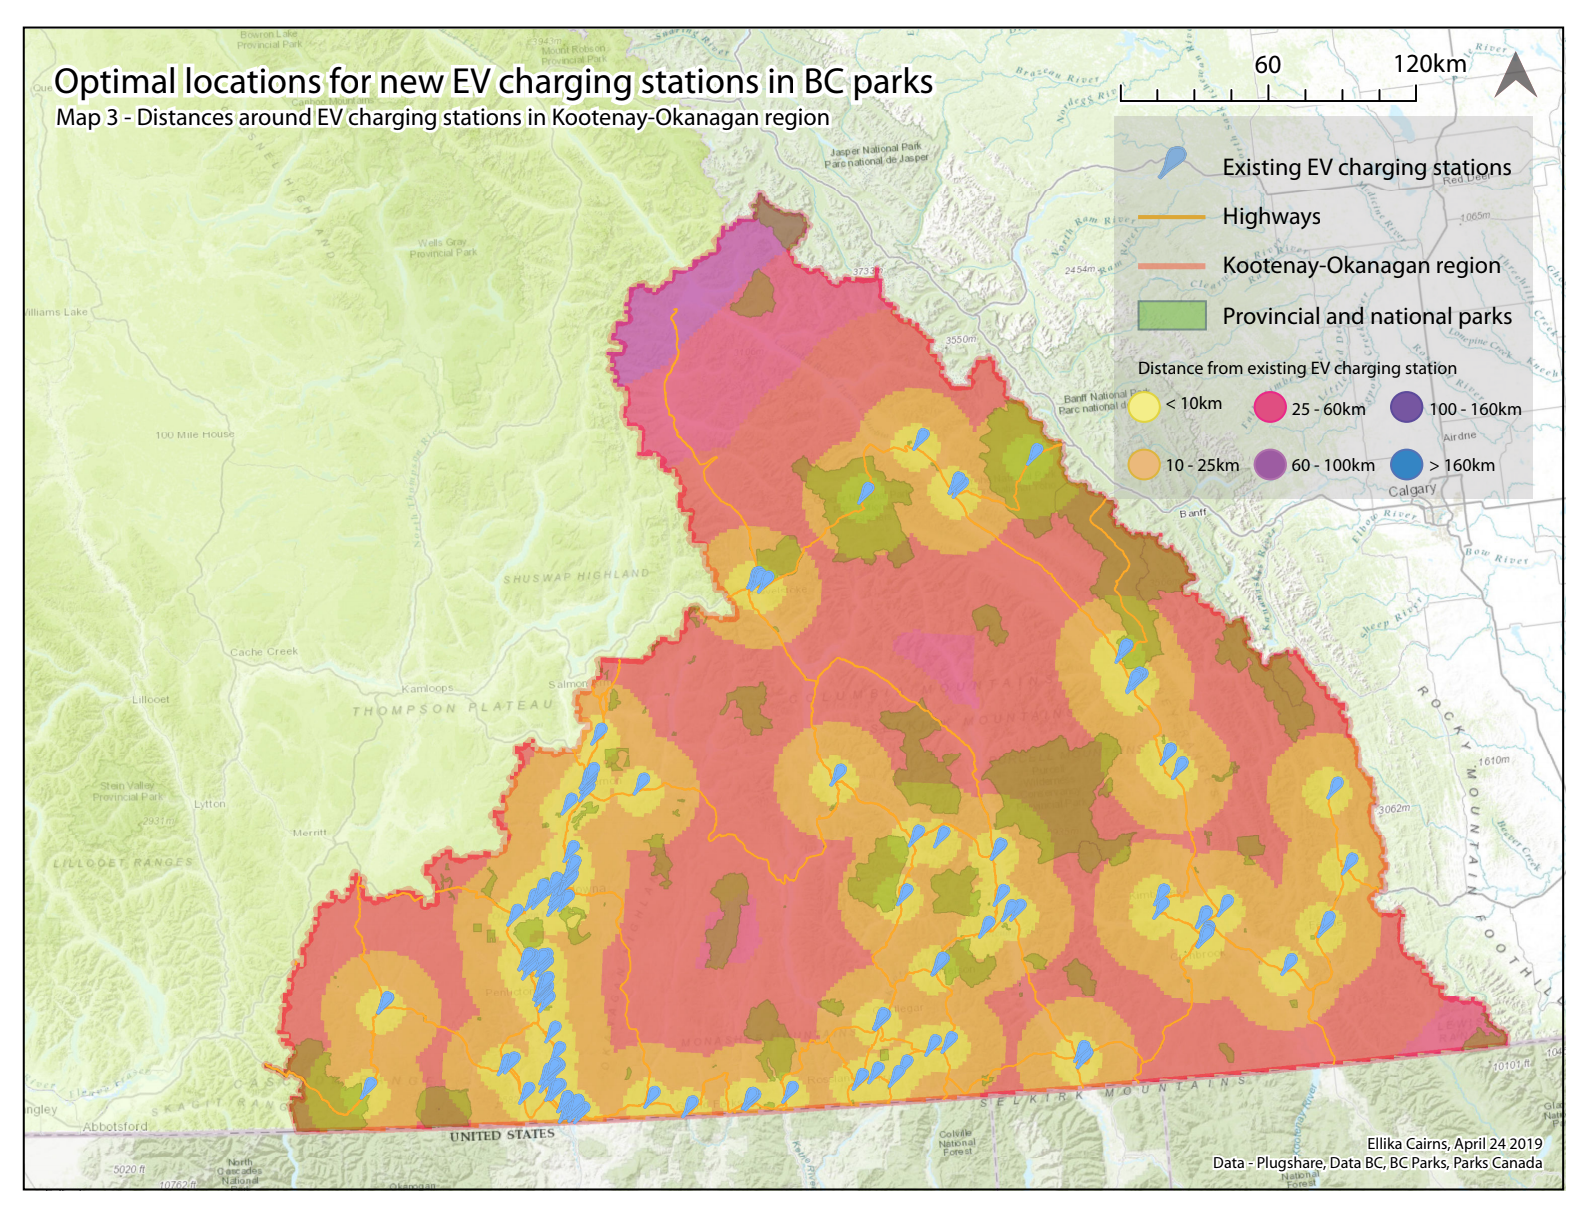
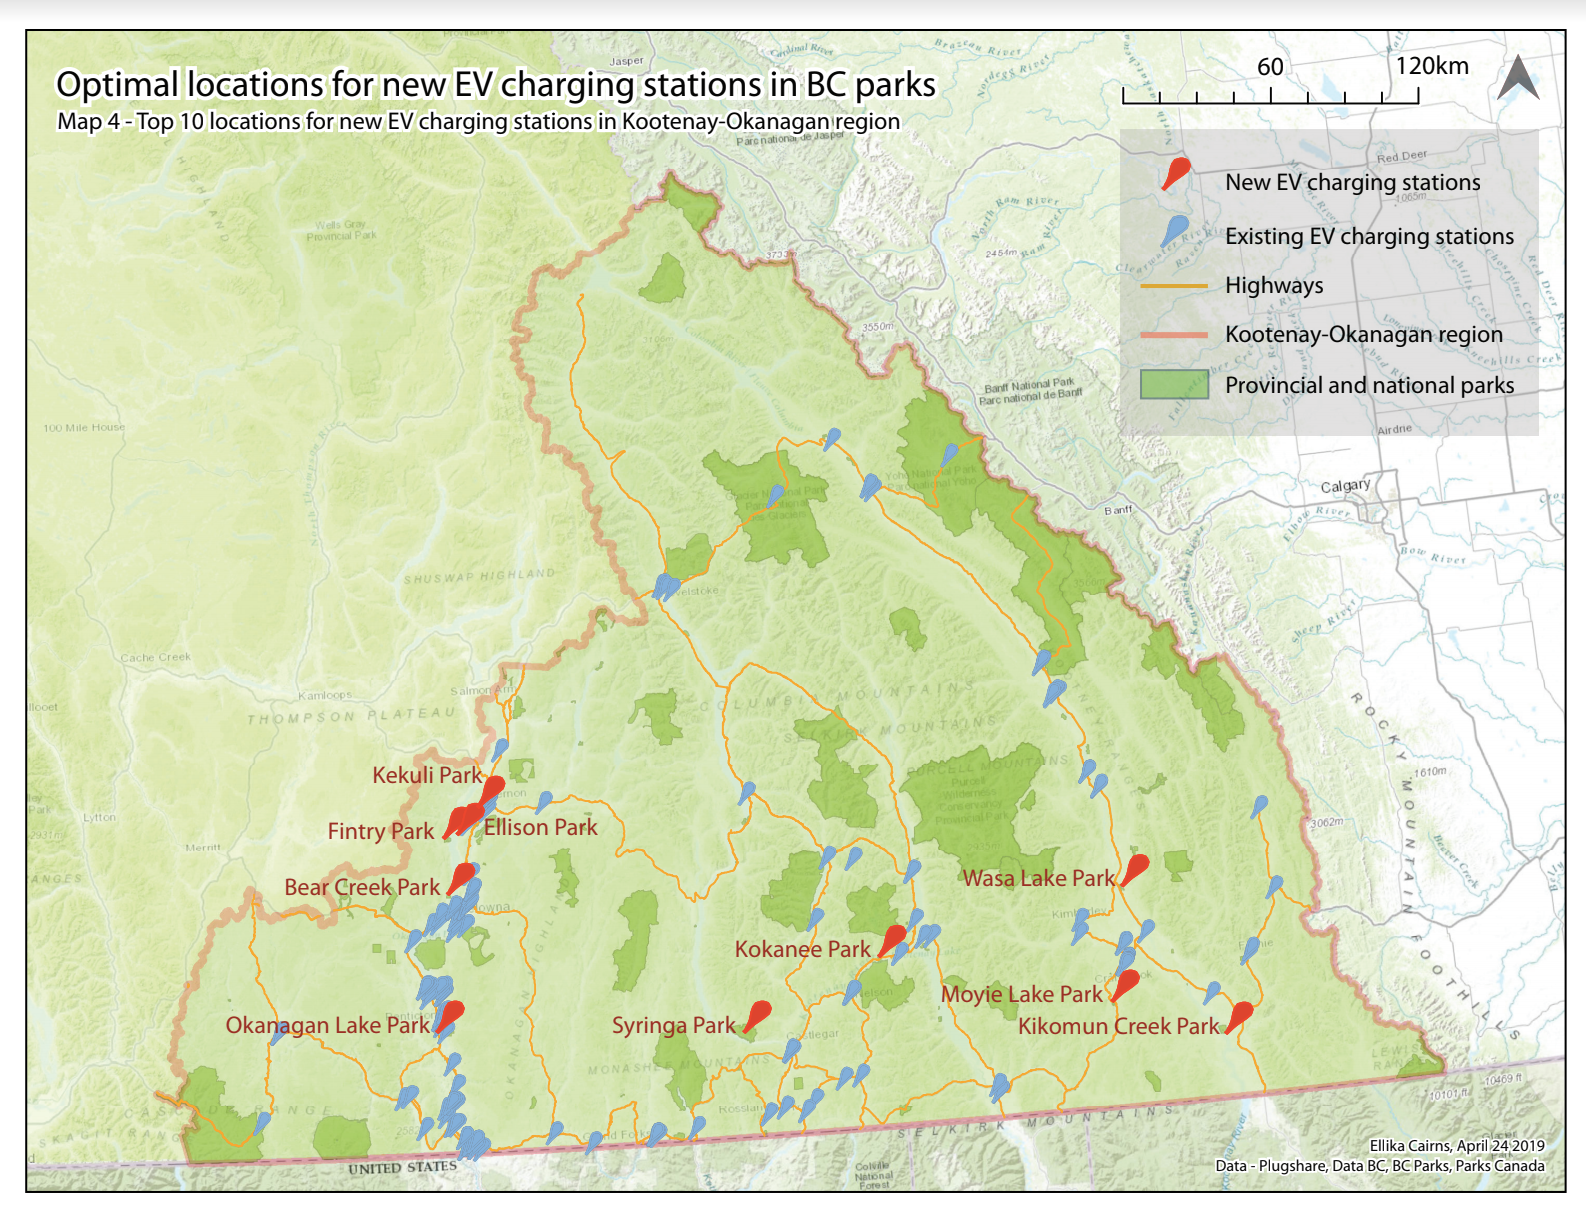
Maps
Tables
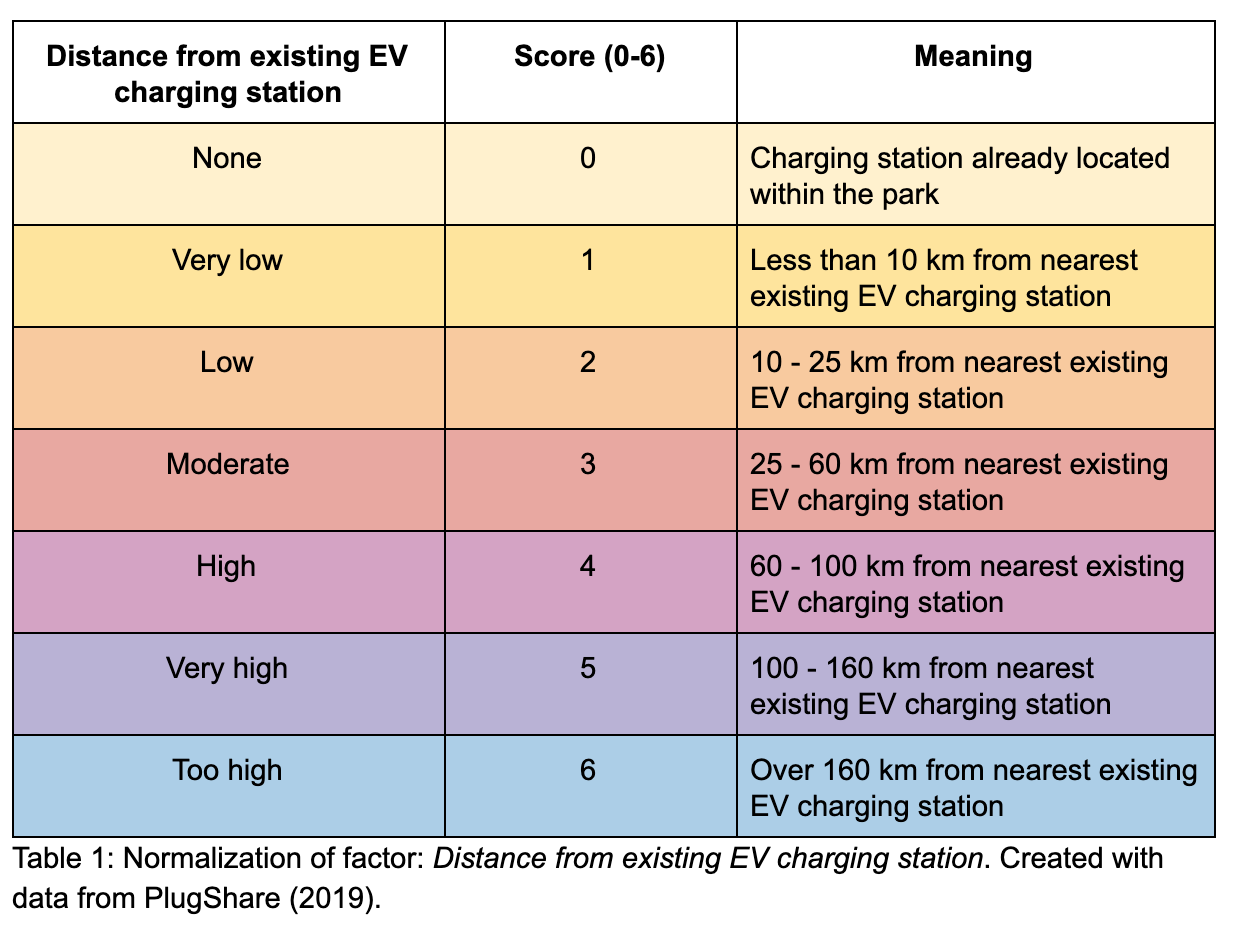
Distance from existing EV charging station
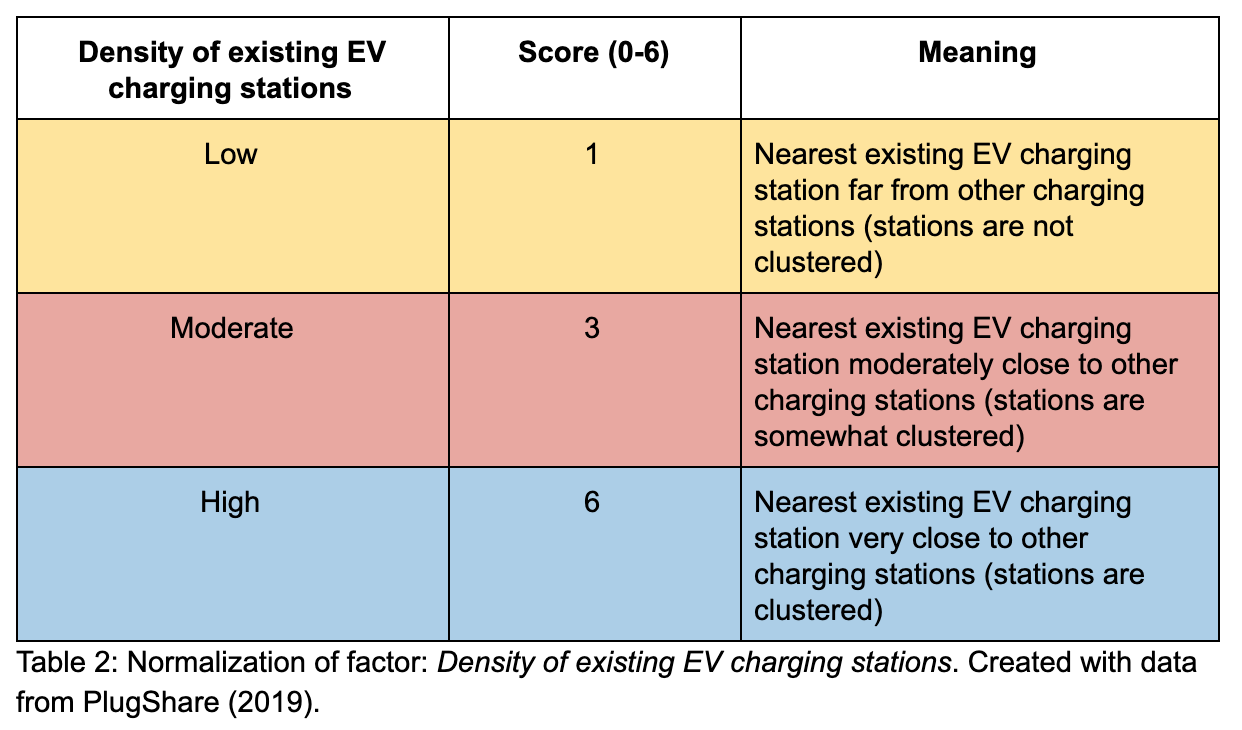
Density of existing EV charging stations
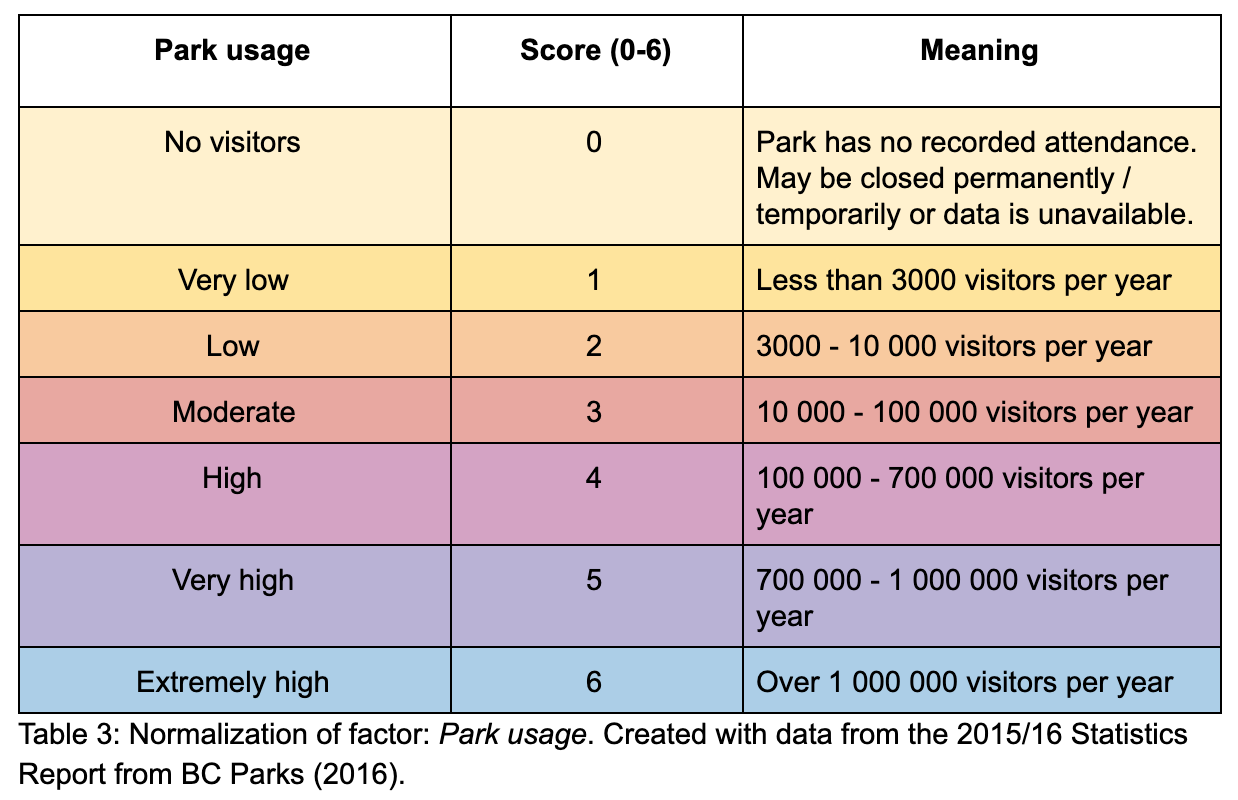
Park usage
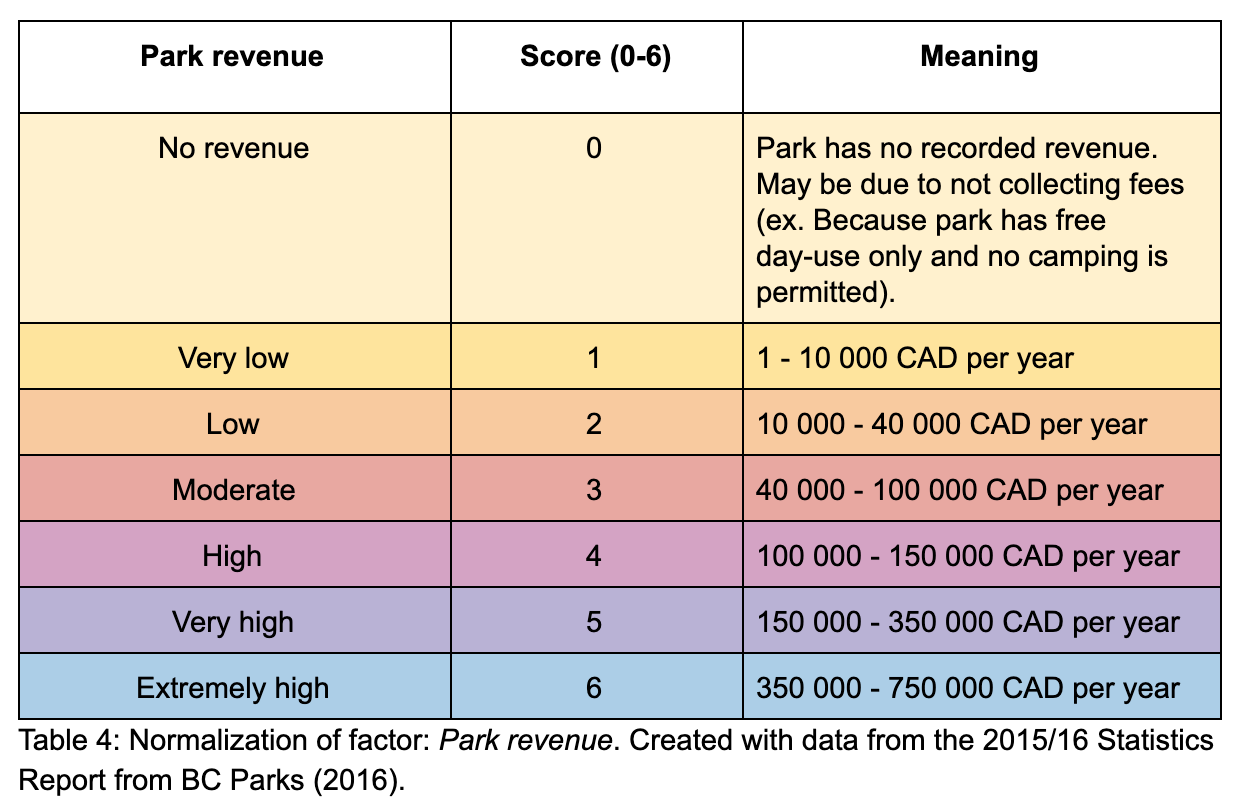
Park revenue
Tables 5.1-5.4: Results from the normalization for all factors. Seperated for legibility / clarity.
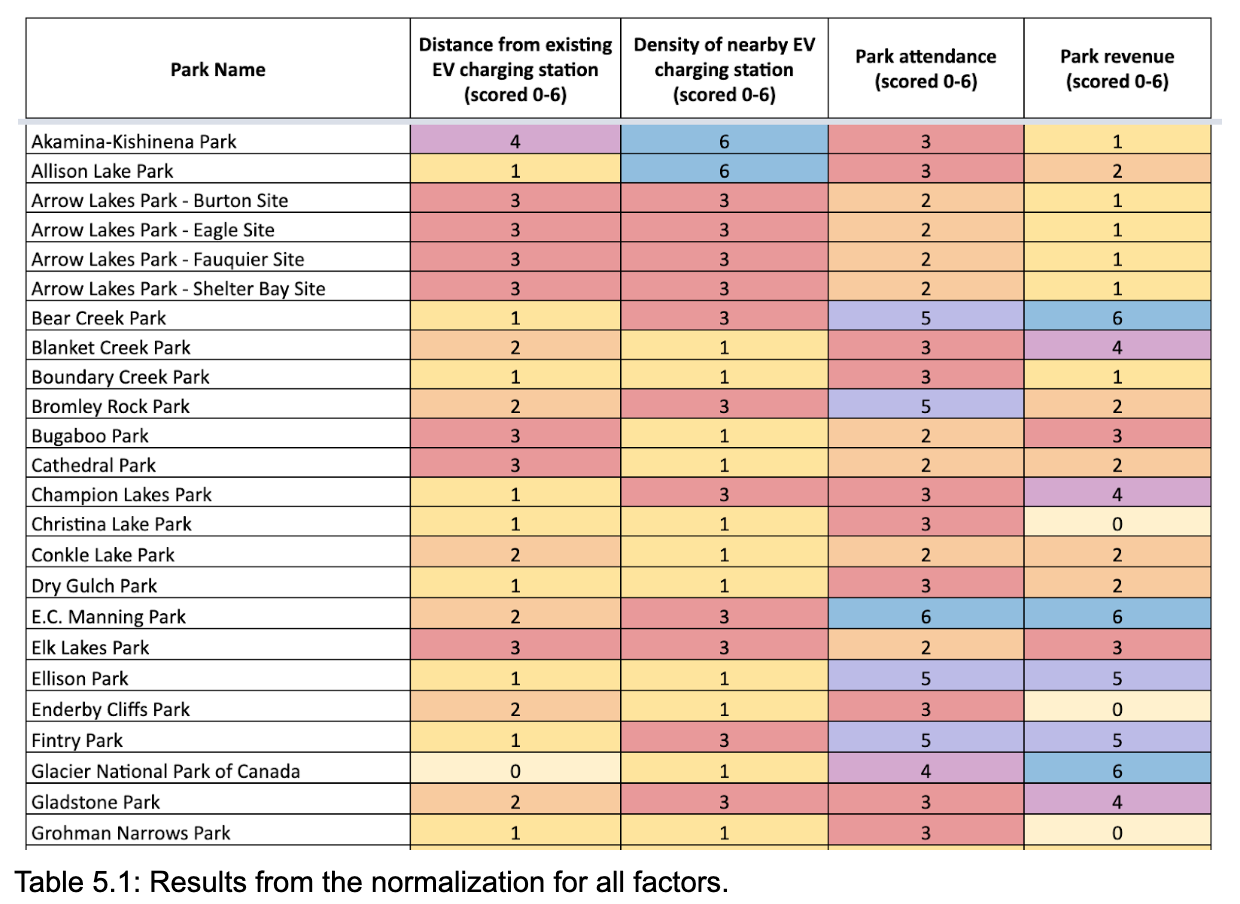
Results from the normalization for all factors.
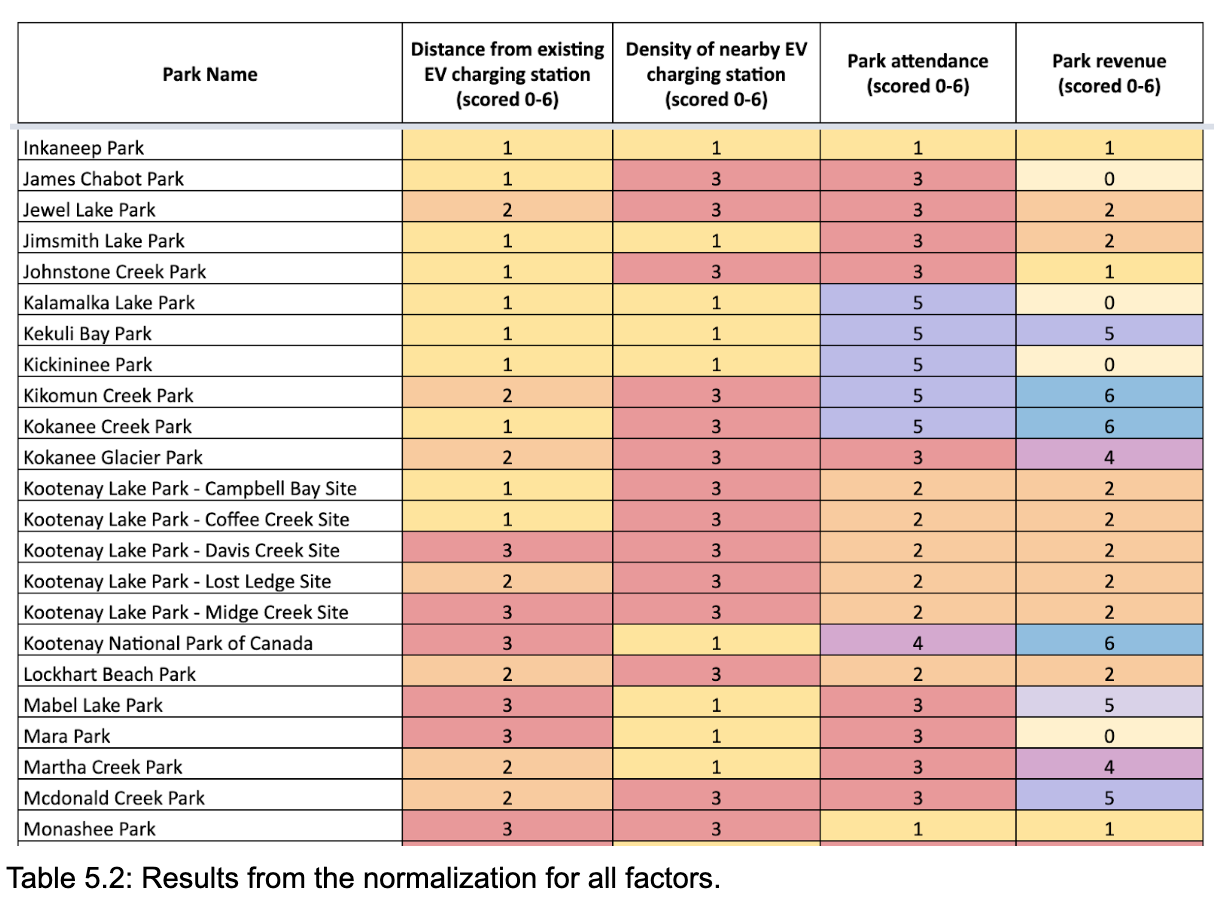
Results from the normalization for all factors.
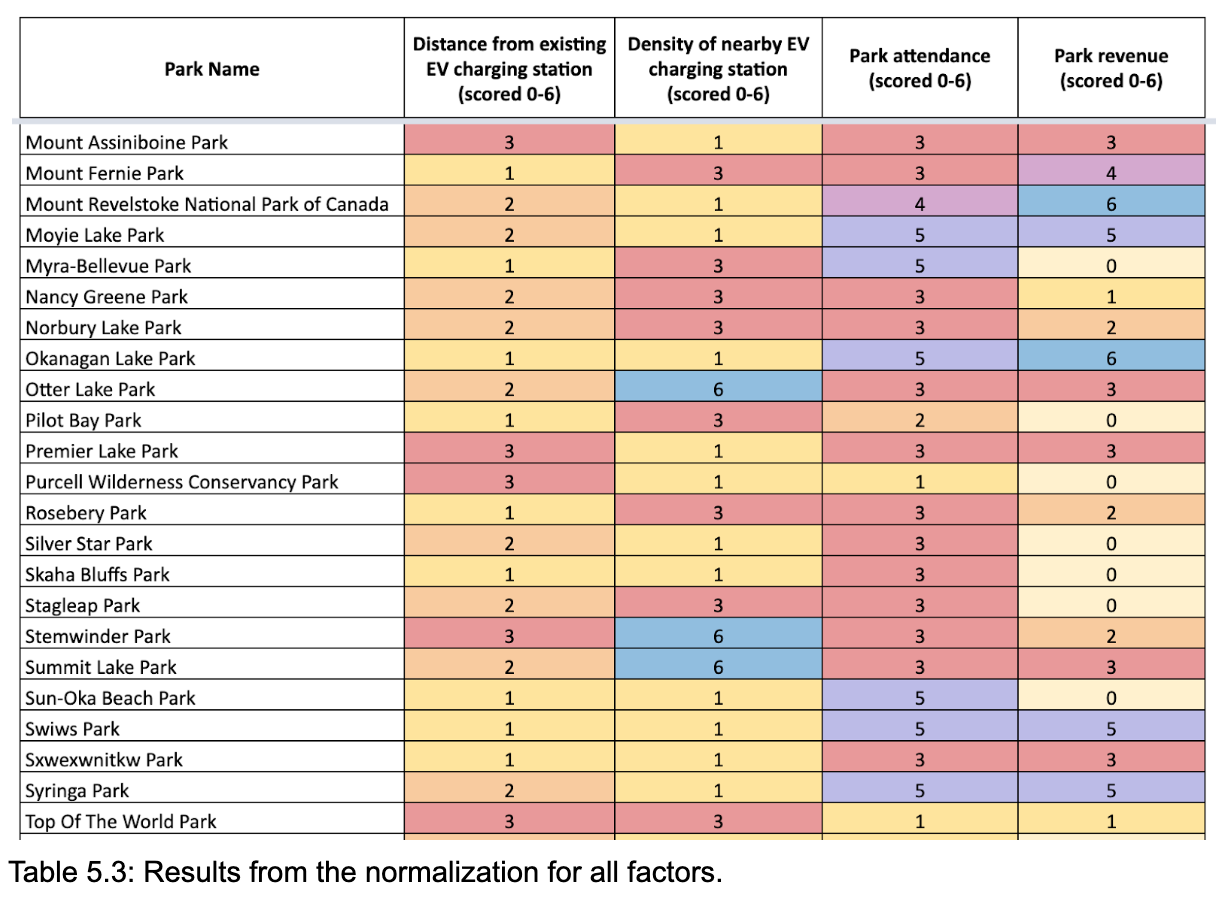
Results from the normalization for all factors.
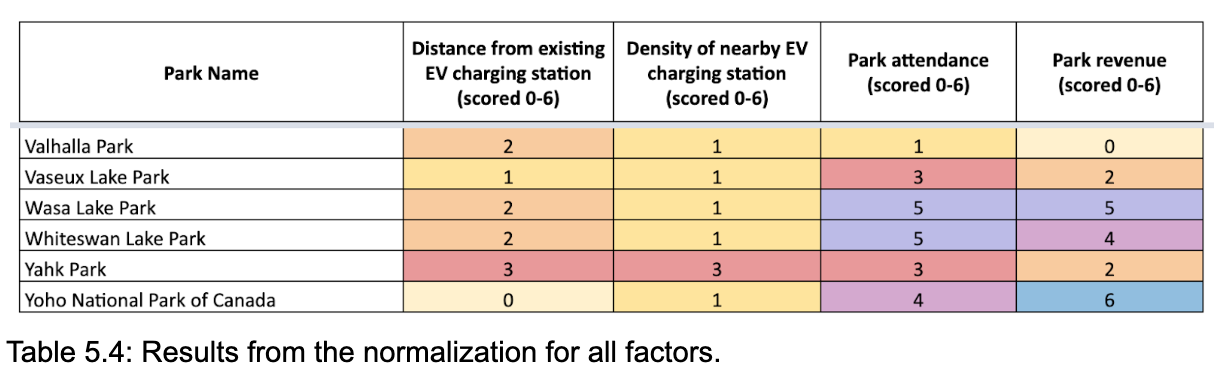
Results from the normalization for all factors.
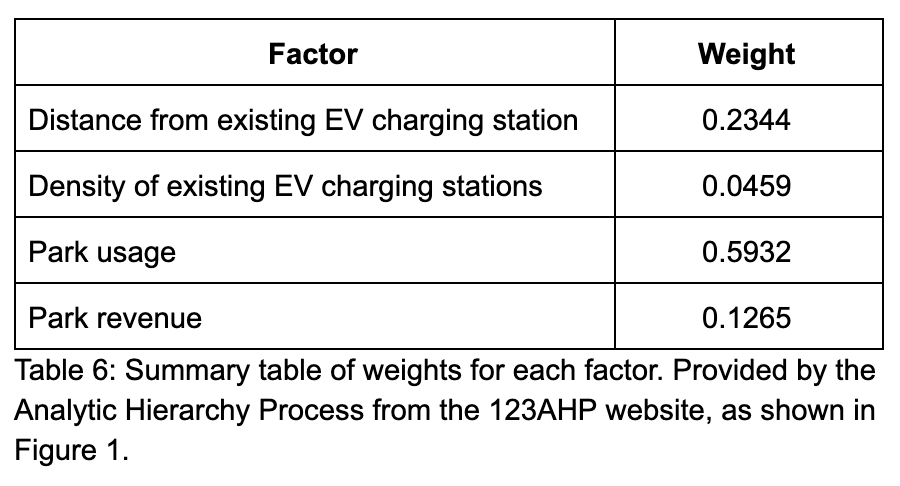
Weights for each factor
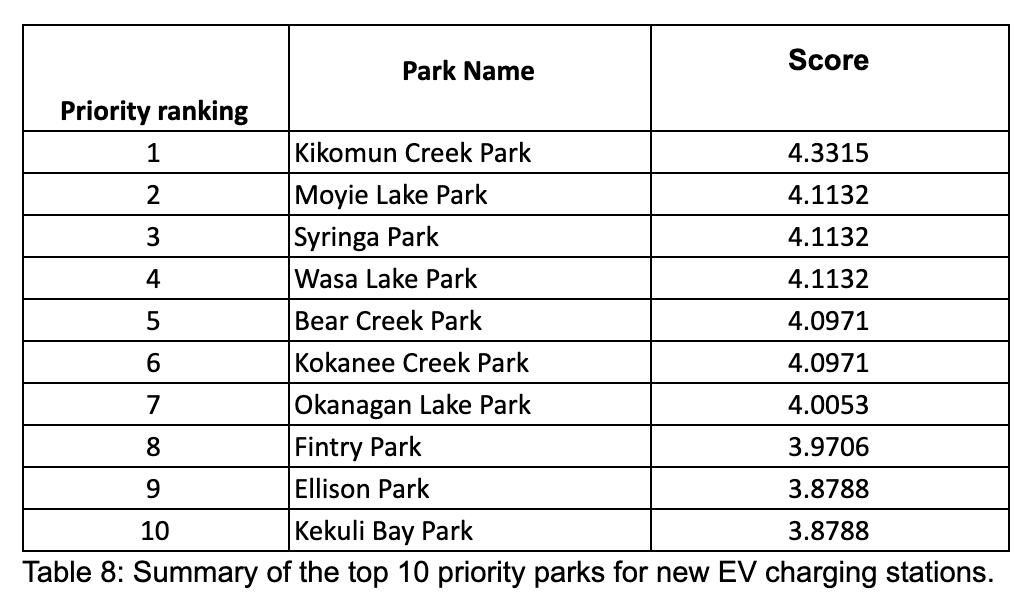
Summary of the top 10 priority parks for new EV charging stations
Tables 7.1 – 7.3: Final results after the AHP and weighting of the factors. Seperated for legibility / clarity.
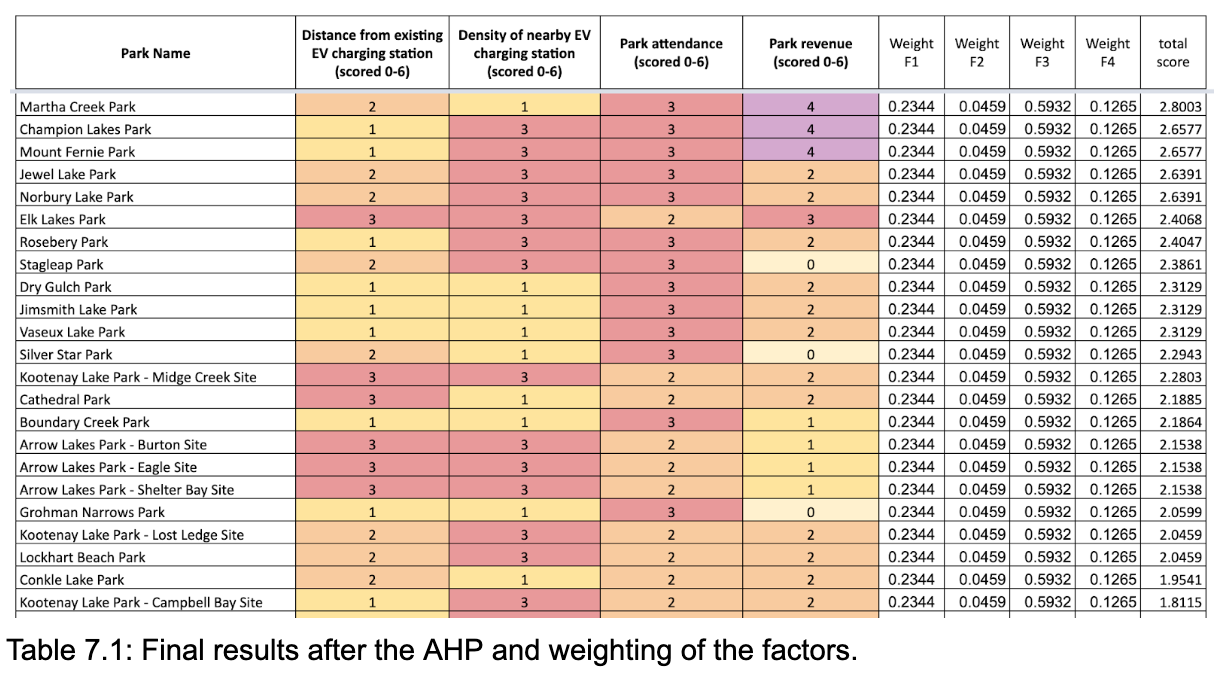
Final results after the AHP and weighting of the factors.
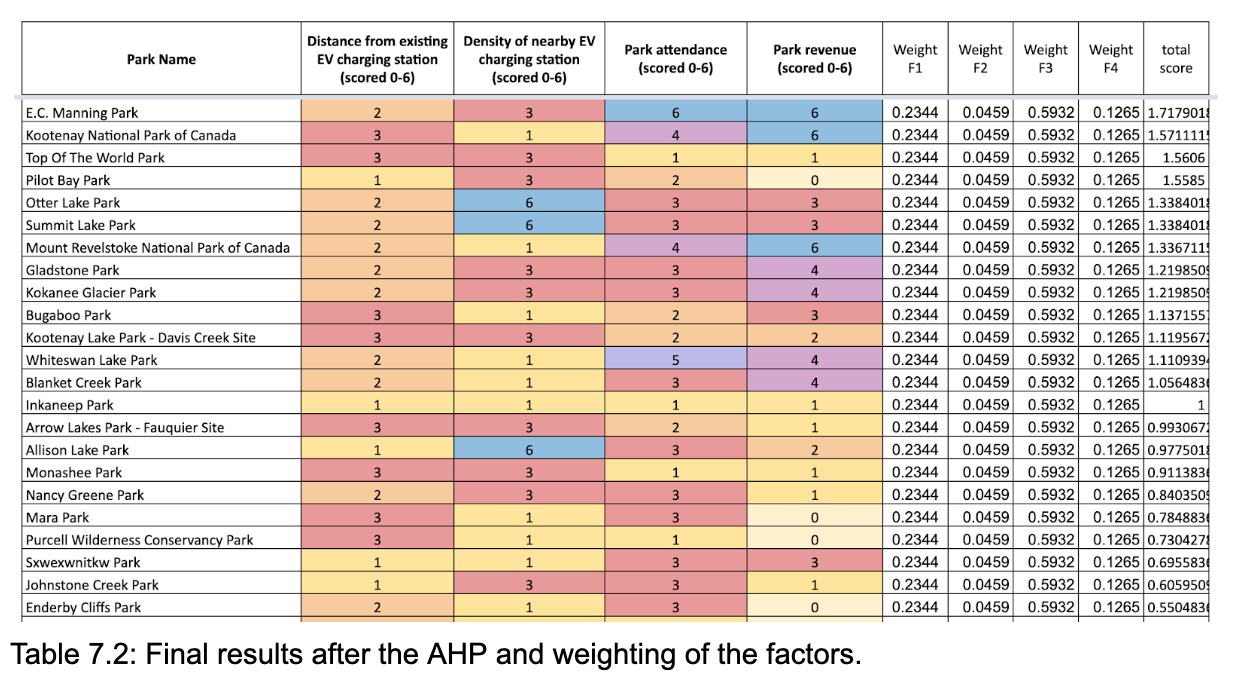
Final results after the AHP and weighting of the factors.
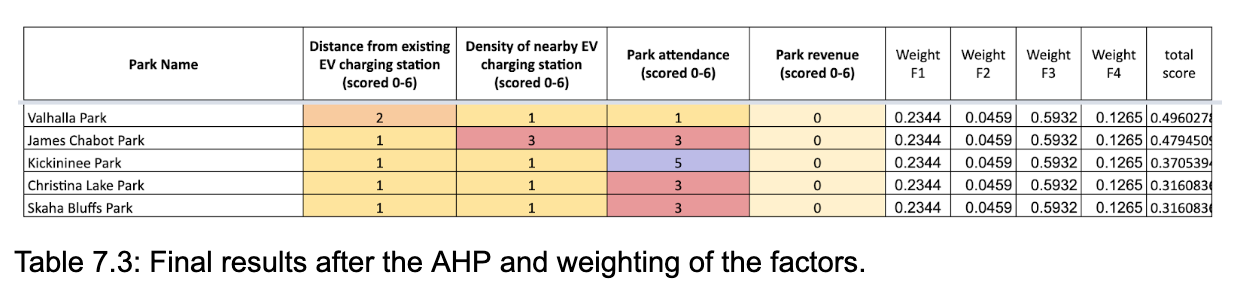
Final results after the AHP and weighting of the factors.
Figures
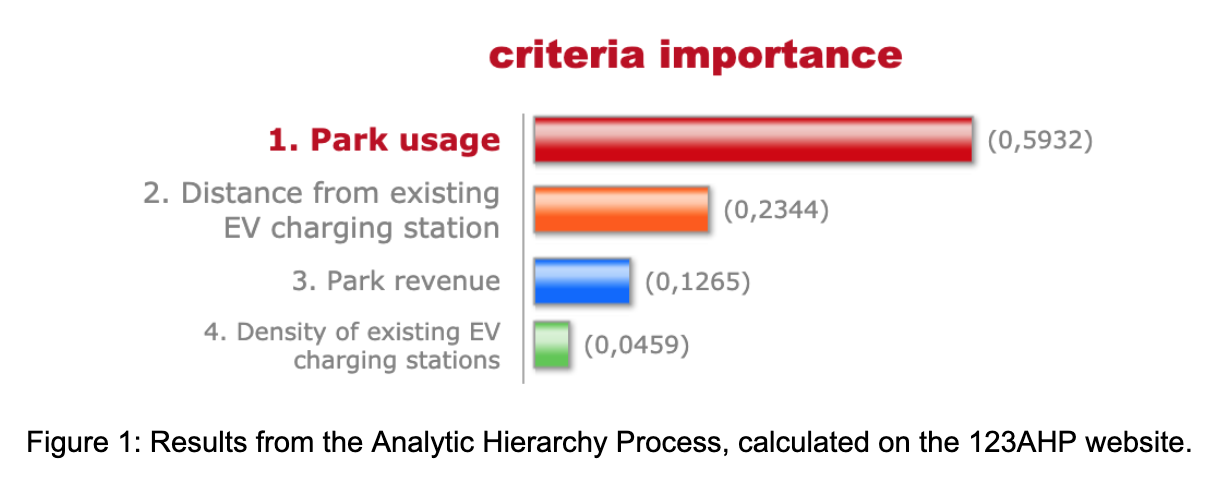
Results from the Analytic Hierarchy Process