Methodology
After conducting my literature review and sourcing / preparing my data, I then began my analysis. As discussed in my literature review, I chose to base my analysis in GIS methodologies. More specifically, a Multi-Criteria Evaluation (MCE) using an Analytical Hierarchy Process (AHP) to weight the criteria.
Factors
- Distance from an existing public EV charging station
- Density of existing EV charging stations
- Park usage
- Park revenue
There are several other factors that I could have included in my analysis, however due to the limited data available and capacity of this project I only chose to consider these. Changes in elevation may have been beneficial to consider, since an EV (or any vehicle) takes more energy to drive up a steep hill. Therefore, if a park was located in a place where vehicles would have to drive up steep slopes or mountains to get to it, an EV charging station may be more useful to have within the park. However, since most EVs also charge going downhill, this factor is difficult to evaluate within the scope of this project.
Other factors, such as amounts of EVs owned by residents near the parks and different maximum ranges of various types of vehicles, could have been considered as well, but were not included due to various limitations of this project.
Normalization
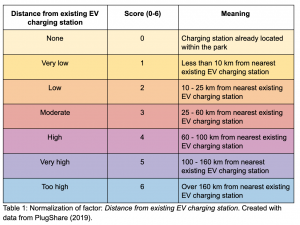
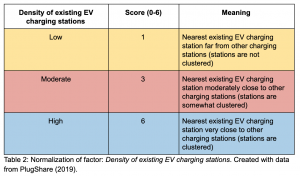
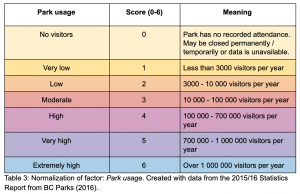
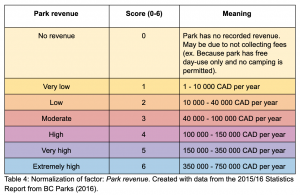
In order to compare the factors, the data had to first be normalized. This was done on a scale of 0-6, and is summarized in the following tables, with the meaning for each value on the scale also defined:
Distance from an existing public EV charging station
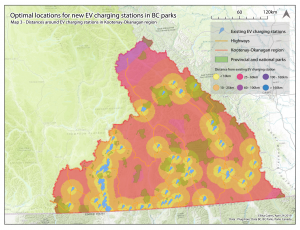
The distance from the existing EV charging stations was calculated using the Euclidean Distance tool in ArcMap. Each park was given a score based on the distance to the closest station. When there were multiple stations nearby, the nearest was used to provide the score. The distance categories for each score were based off the literature review, with any value greater than 160km being too far. In this analysis, no park was greater than 100km away. This is shown below, in Map 3:
Density of existing EV charging stations
The density of nearby EV charging stations was calculated using a kernal density tool in ArcMap. If the nearest charging station to a park was close to several other stations, they were considered to be clustered. This would mean that in the case that the closest station was occupied, the driver could easily get to another station.
Park usage
The park usage was divided into categories based on natural breaks in the data from the BC Parks report. This factor is very important, since it is likely that the more popular a park is, the greater the demand for EV charging stations.
Park revenue
The park revenue was also divided into categories based on natural breaks in the data from the BC Parks report. This factor indicates whether the park would be able to bring in enough revenue for building and maintenance costs of the potential EV charging station.
Weighting the Factors
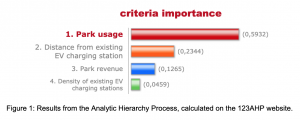
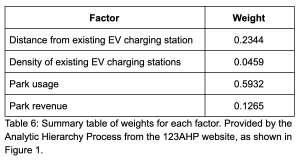
After determining and normalizing the factors, they were then evaluated in an Analytical Hierarchy Process, using the 123AHP website. The following figure and tableshows the results from the website:
Using these weights, the total score for each park could then be calculated. A higher score meant that placing a new EV charging station would be more beneficial, and a lower score meant that there was less need. These final results are in the Results & discussion section.
