
As we are discussing the implications of technology on science teaching, I would like to describe briefly my experiences with using data collection and analysis technology, such as LoggerPro in my classes (www.vernier.com). This technology can help you change how you teach science and what you students learn in your science classes. I started using this technology (sensors for data collection and the software to analyze the data) while I was teaching at Rutgers University in 2001. There we used motion detectors, force probes, a force plate, current and voltmeters, magnetic field sensor, Geiger counters, temperature probes, etc. We used the sensors during the labs (every student group had one set of sensors). Later on, I started using the sensors during lectures (at UBC 0 since 2004). The philosophy behind it was the Interactive Lecture Demonstrations proposed by Sokoloff, Laws and Thornton (see: Activity-Based Physics – http://physics.dickinson.edu/~abp_web/abp_homepage.html ) . The idea was to provide the students with the tools that enable them to test their understanding of physics concepts. Coupled with the electronic-response system technology (clickers), we were able to bring a real physics demo to the lecture and ask the students to PREDICT measurable outcomes of this demo. Then the technology was used to TEST students’ predictions. Later one, we started uploading the data collected in class on the web and asking the students to analyze these data at home. So we expanded the Interactive Lecture Demos to Interactive Lecture Experiments. This way, the students had a chance to experience what science is all about and not just be given ready to use recipes for problem solving. Notice, the license for LoggerPro software was very inexpensive, so each one of our students could install the software on their personal computers. I believe that the LoggerPro technology affected profoundly how we taught physics, or to be more precise, how the students were learning it. We started hearing more and more questions like “What if we conduct such and such experiment, what would the measurement be?” or “If our hypothesis about X is right, then if we do such and such measurement, we should be able to measure such and such outcome”… This was a very exciting development and the students. In addition, seeing the graphs appearing in front of your eyes while you are doing an experiment is a very powerful experience in its own right. Please remember that sensor-based pedagogy is not limited to Physics. You can use these sensors in any science course you teach.
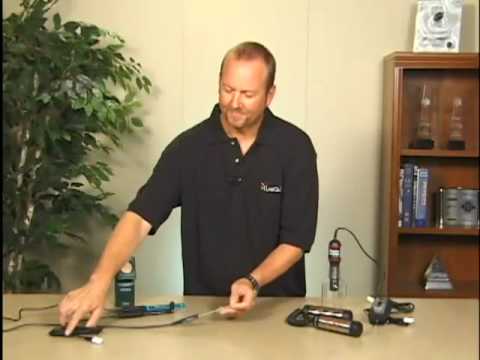
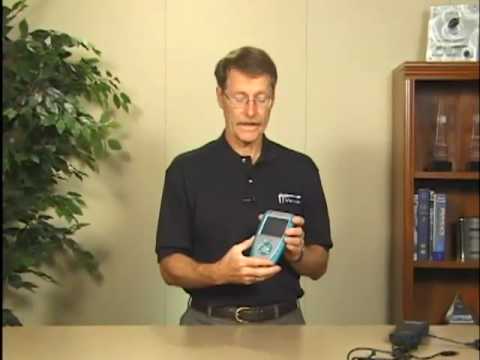
There is a large number of publications in the filed, including our own. Many of them can be found from Vernier’s web site, or just do a search for “Interactive Lecture Demonstrations” or “Real Time Physics” (from physics you will be able to go to other disciplines). Let me just bring a short video link to Vernier sensors here:
Another very interesting link to Data-Rich Labs is: http://www.denofinquiry.com/index.php It has excellent ideas for labs for introductory physics. They might be applicable for your Advanced Placement (Physics 12) classes as well as to the lower level physics courses.
In one of the following posts I will describe how we use Video Analysis – another very exciting feature of the Logger Pro software that will help your students link physics to everyday life.