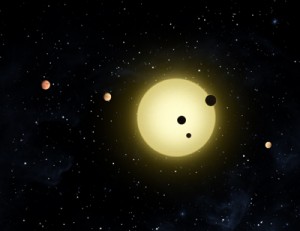
Before we find life beyond our Solar System, we must find places to look: extrasolar planets, that is, planets beyond (“extra-“) our own Solar System. We have already found 100’s of them — check PlanetQuest for the latest tally. A growing number of discoveries are being made by the NASA spacecraft Kepler which uses the “transit method” to detect planets. When a planet passes directly between us and its sun, that is, the planet transits the star, there is a periodic dip in the brightness of star as the planet blocks some starlight from reaching us. By decoding the star’s light curve, we can uncover some of the characteristics of the planet: its orbital period and diameter and, if we know the mass of the star, the extrasolar planet’s orbital radius. If we know the size of the planet, its orbit and the mass of the star, we can determine if the extrasolar planet is in the habitable zone, the “Goldilocks” region around the star that is not too cold (and water is frozen) and not too hot (as water is vapourized.) Around distant stars, just as it is on Mars, Europa, and Enceladus and here on Earth, our search for life is really a search for liquid water.
The search for life beyond our Solar System is topic that appears in every introductory astronomy (“Astro 101”) course. School teachers and science museum presenters might cover it, too.
Extrasolar Planets Lab Activity
This activity is designed for a 50-minute lab with groups of 40 or fewer students, supervised by 1 or 2 teaching assistants. By the end of the activity, students should be able to
- illustrate how planets are detected using the transit method and extract characteristics of the planet from the star’s light curve
- compare extrasolar planets to our own
The activity is built around observing a globe lamp “star” being transited by stryofoam “planets” using a LoggerPro/Vernier light sensor.
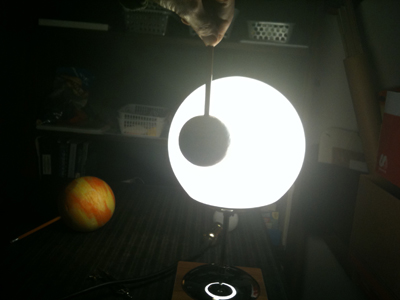
A small styrofoam ball, held on a pencil, passing in front of a globe lamp, modeling a small planet transiting the star. The other planet lying in the background has exactly twice the diameter.
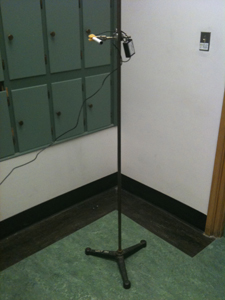
Vernier light sensor and Go!Link on equipment stand.
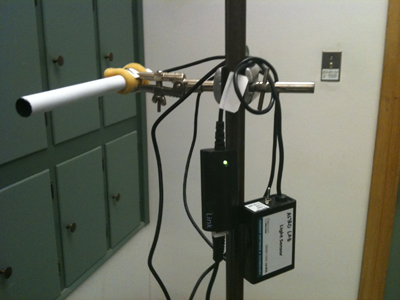
The Vernier light sensor is inside white tube (a rolled-up piece of paper, coloured black inside, to reduce the amount of scattered light hitting the sensor.)
Materials:
- hand-outs / worksheets for students [ExtrasolarPlanetsASP2011][PDF]
- Figure for worksheets [Kepler11_NASA.eps]
- LoggerPro file LightCurve.cmbl for displaying output from the light sensor
- Light curve for HD 209458 [HD209458lightcurve_MOST.ps] The gap on Day 11, by the way, is when the satellite unexpectedly when off-line for a few hours.We printed, cut into 2 long strips and laminated this light curve into a 2′ wide by 20′ long poster that we hang in the hallway outside the lab. (PostScript is a vector graphic, recall, so it’s (still) beautiful when blown up.) The data come from my colleague Jaymie Matthews, PI for MOST, who confirmed to me it’s fine to release the data if you want to make your own poster or explore the data:
- .dat datafile (10 Mb)
- Fortran plot.f and makefile for the light curve poster written by former-TA @mgendre
- ApJ reference for HD 209458b
- An instructor / teaching assistant guide gives all the details for setting up the equipment and guiding the students through the activity. This version was presented at ASP2011. The guide also contains answers to the questions on the student worksheets so it is available on this password protected page. Send me a message to newbury@phas.ubc.ca for a password.
In-class Demo or Science Center Presentations
For Astro101 courses without a lab, we also have a version of this extrasolar planets activity that runs as an in-class demo. It could easily be adapted to a presentation at a science center or a public outreach event.
We set up the same equipment — globe light, styrofoam planets, Vernier light sensor linked via a Go!Link to a computer running LoggerPro — at the front of the room. The LoggerPro output is projected onto the screen so the audience can simultaneously see both the equipment and the LoggerPro output. Each students receives a handout [pptx][pdf]
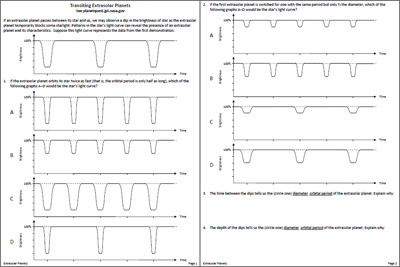
A student volunteer comes up and makes a few orbits of the star using the big planet. With this practice, we get the volunteer (“John”) to make a few nice, steady orbits. Then we ask the class to make a prediction:
Have a look at your worksheet. Suppose the orbits John just made are represented by the light curve at the top. Now John is going to make the planet orbit twice as fast, that is, with half the period. What will the new curve look like? Pick one of the graphs A–D in Question 1.
We use clickers in our Astro 101 courses, so after a moment or two to think, we collect the students predictions. Here’s what they predicted:
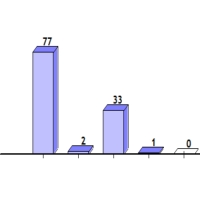
Students' predictions. The histograms (l-to-r) are votes for graphs A, B, C, D (no choice E) in Question 1 of the handout, shown in the graphic above.
The students had no problem recognizing there would be twice as many dips in the light curve but nearly 1/3 of them did not anticipate the dip being narrower like it is in the correct choice A because the planet transits the star in only half the time.
With the prediction made, the volunteer John goes ahead and makes the quick orbits. The prediction forces the students to focus on the critical features of the graph — the period of the dips and their width.
Now for the small planet:
John, would you grab the small planet, please? Thanks. John is going to try this small planet. It’s diameter is one half of the first planet. He’s going back to the original, slower orbit. Which light curve in Question 2, A, B, C or D, do you think it will make?
Again, after a moment to think, we get them to click in their predictions:
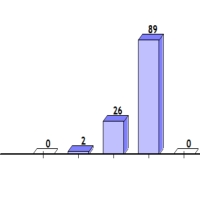
Students' predictions for light curves A, B, C, D in Question 2 of the handout (right-hand page of handout graphic above.)
Cool! More than 75% of the students picked the incorrect graph, D, which shows dips half as deep. Only 25% recognized that a planet with 1/2 the diameter has 1/4 the area, so it blocks only 1/4 as much light as the big planet. We see the same misconception in the 50-minute astro lab, too.
John goes ahead and makes the orbits. The dips are definitely shallower. How much less, though? With the LoggerPro software, you hit STOP to freeze the output and make some measurements. Hmm, wait a minute, did we measure the depth of the dip with the big planet? No, that was about period. Ask the volunteer to pick up both planets and make 2 big and 2 little transits. Then you can freeze the LoggerPro output and measure the depth of the dips. Sure enough, the big dip is 4 times deeper. So cool!
There are lots of directions to go from here: orbital radius via Kepler’s Laws and the habitable zone, exploring the MOST data,…
Assessment
After writing (and re-writing and tweaking and re-writing and…) the lab activity, we watched and assessed the students. They typically have no trouble seeing the relationship between the spacing of the light curve dips and the period of the planet. It’s so intuitive, after all. However, as the clicker predictions show, few of them recognize the squared relationship between the depth of the dip and the diameter of the planet. We felt that was important so we hammer it home in the lab and in-class demo, making measurement of the dips to uncover the pattern.
The last question on Page 4 of the lab hand-outs [LaTeX][PDF] is a nice one because it requires students to identify both the period and size of the extrasolar planets.
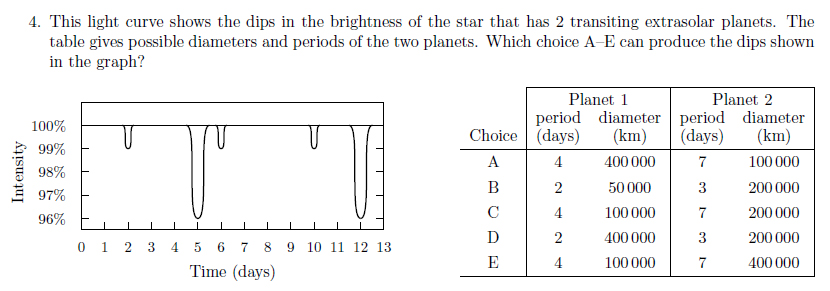
Students must identify both the period and diameter of extrasolar planets to correctly answer this question.. Choices C and E distinguish between dip depth going as area or diameter of the extrasolar planets. (C is correct.)
A misconception about transiting extrasolar planets
It’s not life-threatening and it’s not as important as the “seasons = distance” misconception, but we are often teaching a misconception when we talk about transiting extrasolar planets. Nearly every one of our Astro 101 students believes you can see a little black spot on the face of the star. That’s not (currently) the case — all we see is a dip in the star’s light curve, and we interpret that dip, in words and pictures, as a little black spot on the star. You can read my post about it.
Extension: eclipsing binary stars
If you talk about the light curves from eclipsing binary stars, do you use the “Binary Stars” Lecture Tutorial by Prather et al. Or the great Eclipsing Binary Simulator in the NAAP collection? The toughest concept to grasp is figuring out the geometry of the two stars, little star in front or little star behind, during the two dips in the light curve. It still makes my brain hurt. Let’s see, when the small star is in front, it blocks the more luminous, big star, so we lose more light, giving the big dip. Um, right?
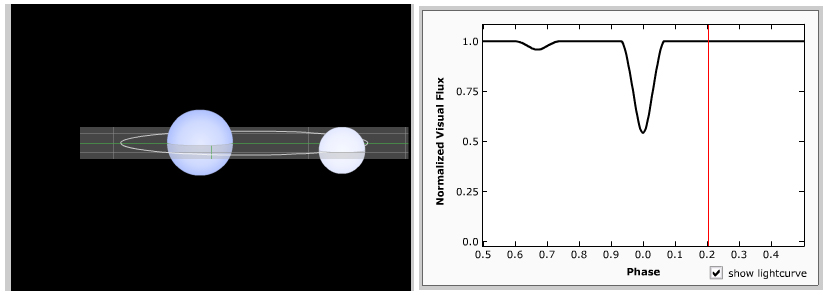
Eclipsing binary stars produces a characteristic 2-dip light curve. Which main sequence star is in front, big or little, during the small dip? (Screenshot adapted from NAAP sim.)
Eclipsing binary stars
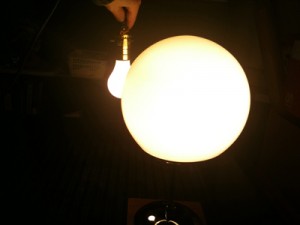
I tried replacing the extrasolar planet with a light bulb, making sure to choose a wattage smaller than the globe lamp so that luminosity increases with size, just like main sequence stars. The LoggerPro read-out is stunning, exactly what we want to see!
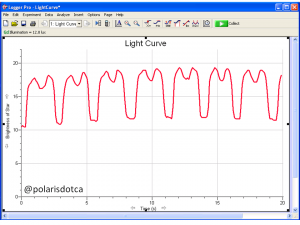
The LoggerPro readings for eclipsing binary stars show the characteristic 2-dip pattern.
Here’s a little something I discovered, though, when trying this out and it was giving me exactly the wrong result. With the light sensor set up 1 metre the bulbs, the eclipse measurements were overwhelmed by the changes in brightness (via the inverse square law) when I moved the small light bulb closer and farther from the sensor as it orbited the globe. Great inverse square law demo but not eclipsing binary stars. If you ever do this, be sure to set up the light sensor far away, 4 or 5 metres, a distance relatively large compared to the orbital radius of the orbiting light bulb.
Credit
Unless credit is given explicitly, all documents, graphics and images are licensed under a  Creative Commons Attribution-NonCommercial-ShareAlike 3.0 Unported License. This work is supported by the Carl Wieman Science Education Initiative.
Your feedback, comments, suggestions
If you use the materials here and find a alternate approach, tweak or extension, please share it by leaving a comment. Thanks!

Just experienced this activity in a workshop at ASP 2011 Meeting in Baltimore. WOW!!! Great job, very engaging for students!
Where can you purchase those globe lamps? I cannot find them!
I found mine, and later, a replacement globe, at Home Depot. Like this one.