A tsunami report in Vancouver
A decade ago, one of the largest earthquakes ever recorded struck off the coast of Indonesia, triggering a tsunami that swept away entire communities around the Indian Ocean.[1] Even today people still cannot forget about that tragedy. Shortly after the Chile earthquake, in north America, many wondered if it would make American cities vulnerable.[2] How about in Canada? This projects is aimed to show a map that highlights the areas in the city that have a greater risk of a possible tsunami.
Click to enlarge
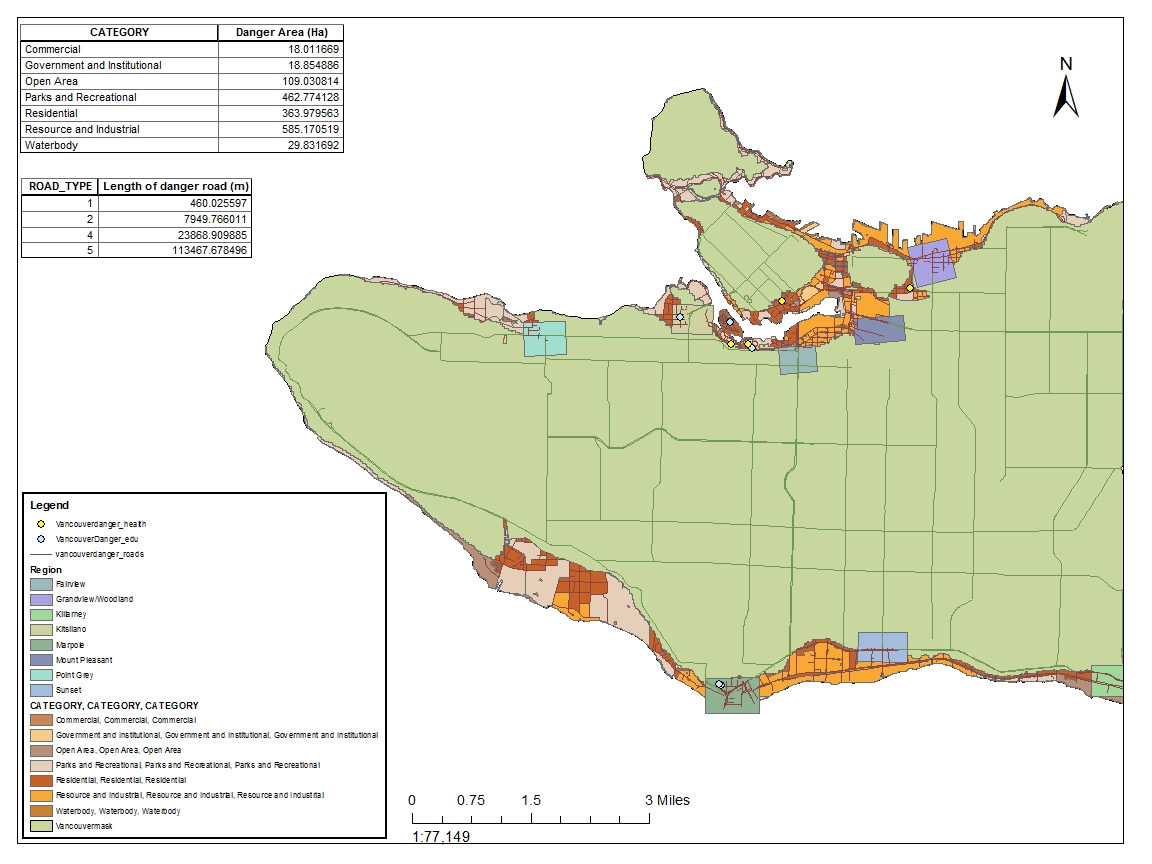
A map showing the danger areas in Vancouver that might be affected by a possible tsunami
Above is a map that shows the danger areas in Vancouver that may be affected by a possible tsunami. As we can see from the map, the False Greek, Grandview/Woodland, Dunbar Southland and Marpole areas are in danger. Although it is unlikely that Vancouver will be affected by a tsunami due to the Vancouver Island on the west works as a barrier, we still need to prepare for the risk; this model can also work for any coastal city in the world.
While a possible tsunami come to Vancouver, there are some healthcare and educational facilities that will be affected, and there are listed below.
| Healthcare in danger zone | Educational Facilities in danger zone |
| False Creek Residence | St. Anthony of Padua |
| Broadway Pentecostal Lodge | Ecole Rose Des Vents |
| Yaletown House society | False Creek Elementary |
| Villa Cathy Care Home | Emily Carr Institute of Art and Design |
| Henry Hudson Elementary |
The percentage of the City of Vancouver’s total area in danger is 12.1% which is not a little area. I found out this percentage by adding up all the in danger area of all categories of land use then divided by the total area of all categories of land use, and finally use the outcome times 100%. Those area information can be found in the attribute table of the layers in the ArcMap.
To find out which healthcare and educational facilities in danger, I used some useful tools in ArcMap toolbox such as the proximity analysis tool select by location. The select by location tool helps us select features in one layer based on their locations relative to features in a different layer.
To conclude, In this project, I learn new skills such as using different tools in the ArcMap to help me distinguish and analysis some data and information. Here are some accomplishment statements:
- Understood the basic concepts of ArcGIS and knew the powerfulness of this software; it can be used to deal with variety of geographic information such as creating maps, analyzing geographic data.
- Gained the skill of performing simple calculations by adding fields to an attribute table and learned the difference between vector data and raster data.
- Used some tools from Toolbox to perform Geographic Analysis to determine potential danger area for possible nature hazards and to extract data affected by possible tsunami.
References and resources:
[1] BBC News http://www.bbc.com/news/world-asia-30034501
[2] By Patrick Frye http://www.inquisitr.com/2429846/american-cities-vulnerable-tsunamis-in-californiaoregon-face-a-cascadia-subduction-zone-mega-earthquake/