Housing affordability
Many Vancouverites are proud of their own city since Vancouver has been considered as one of the best cities to live in the world.[1] However, housing affordability levels in Vancouver are approaching the worst ever recorded in Canada as home sales soar 30 per cent higher than the city’s 10-year average, according to a pair of reports on Canadian housing outlooks.[2] This may become a reason that makes the rank goes down in terms of a city’s livability.
In this project, my goal is to make housing maps for both Vancouver and Montreal and show the housing costs and affordability in these tow cities in order to analysis some basic housing information, compare and contrast.
click it enlarge
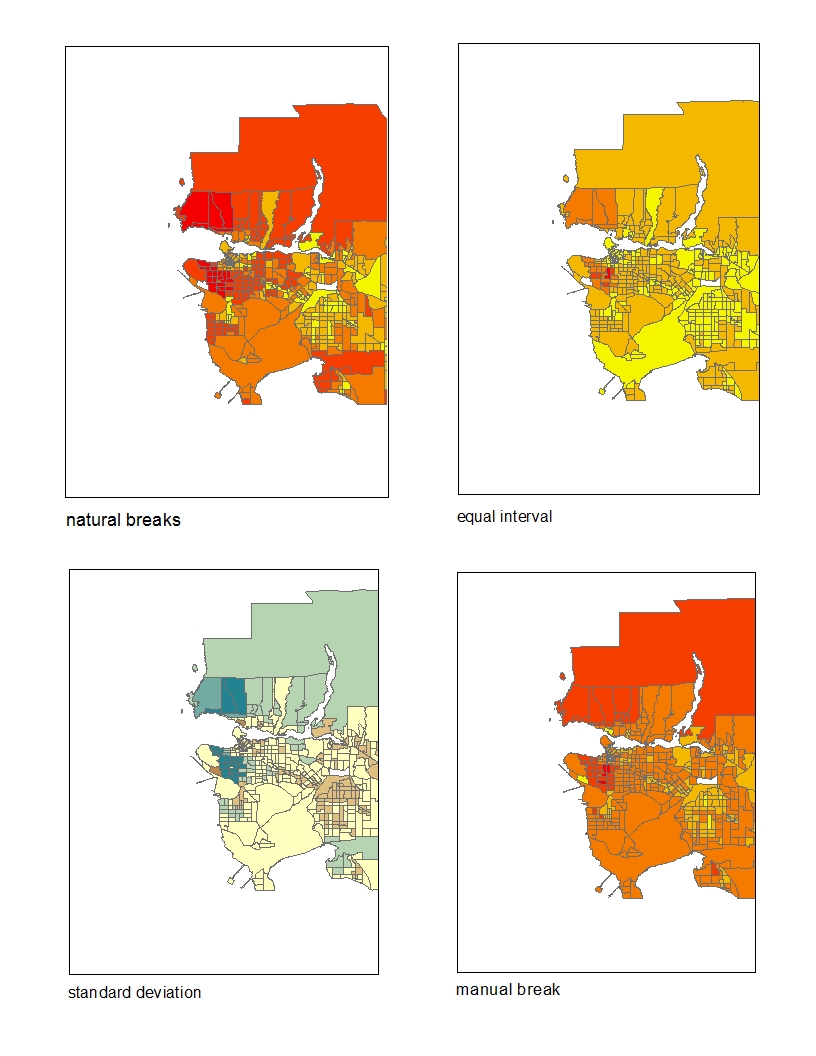
Four Vancouver maps using different classification methods to show the housing affordability
According to the map above, an interesting question was asked:
Since your are a journalist, putting together maps of housing cost in Vancouver, which classification method would you choose for your audience and why? What if you are a real estate agent preparing a presentation for prospective home buyers near UBC? Are there ethical implications for your choice of classification method?
And to this question, my answer is being a journalist, my goal is to publish a map that is true and fair, therefore, I would use manual breaks to repent the map for my audience. Manual breaks allows me to define my own classes so that I can manually set the class range which also helps me to show a clear range of housing costs for my audience. While if I am a real estate agent who is trying to sell the houses near UBC, then I will first think about, what method will show a nice price that’s relatively cheaper compare to other popular neighborhoods such as Point Grey, Kitsilano, and Shaughnessy. Among the four methods, I would choose equal interval because that one shows the UBC area a relatively lower price compared to neighborhood areas. Another reason for using it is that this method divides the range of values into equal-sized classes that will clearly separate the pricing range to different classes.
Click to enlarge
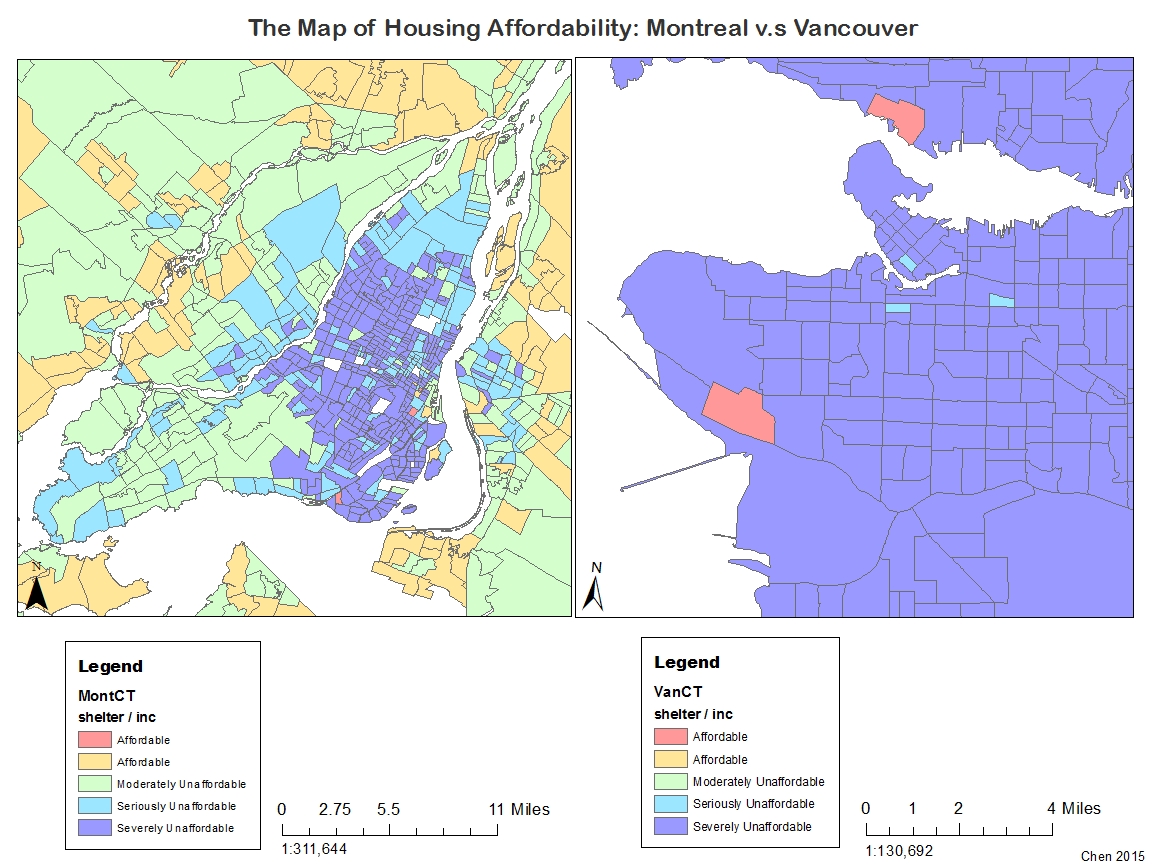
A map shows the comparing housing affordability in Vancouver and Montreal
Use as an index, the word of affordability means the measurement of a population’s ability to afford to purchase something(investopedia.) When we looking into a city, the affordability indicates the cost level and people’s income or abilities to purchase something in a relationship; same with housing affordability. If the housing cost in a city is high but people in the city cannot actually afford that much, then that says the city is not that “livable.” Housing affordability index is a better indicator than housing cost, because the the housing cost just show how much a property is regardless to people’s income. Its such an irony when people see these beautiful houses in Vancouver have fairly high price but not so many Vancouverites cannot afford that price. Thus, affordability is not only a better indicator than housing cost but also a suitable indicator for a city’s “livability.” The term livability means the quality of life in a place, and it involves many factors including the affordability which plays a major role in it.
There are so many categories for housing affordability, in my map above, I used 4 categories to indicate the housing affordability and these are Affordable, Moderately Unaffordable, Seriously Unfordable, and Severely unaffordable. However, these categories are just there as a reference for we to “refer.” We can see the first map on top, I used four different classification methods to show the same information and it came out as four totally different map, so we really need to deeply think through before we make up our mind to trust a map that presented by a journalist or a real estate agent.
By finished this project, as an accomplishment statement, I have learned the four different classification methods for data analysis and when each of them should be used.
References and resources:
[1]: Global Finance. the best city to live in the world 2015
https://www.gfmag.com/global-data/non-economic-data/best-cities-to-live?page=10
[2]: The Global and Mail: Vancouver nears worst every record on housing affordability in Canada
http://www.theglobeandmail.com/news/british-columbia/vancouver-nears-worst-ever-record-on-housing-affordability-in-canada/article26172193/