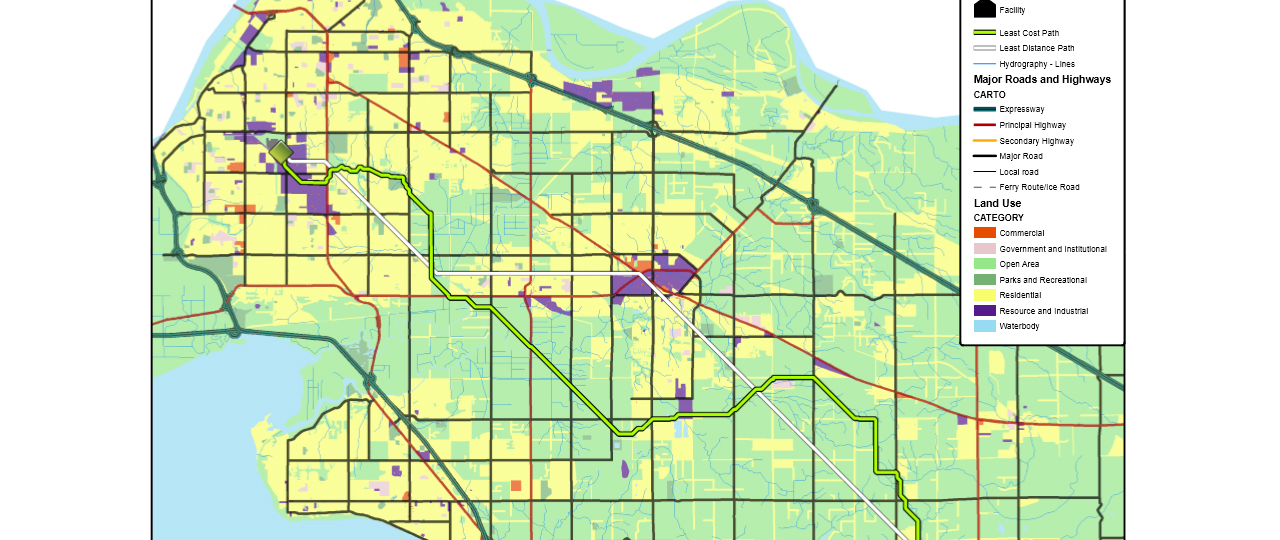
E-Portfolio | Daniel Minney

Analyzing Crimes in Ottawa using CrimeStat

Posted by in Geographic Information Systems

Nearest Neighbour Index By using the nearest neighbor index tool in ‘CrimeStat’, residential break-ins (B&E’s) were found to be less spatially aggregated than auto thefts, however commercial B & E’s are similarly spatially aggregated to auto thefts. The index tends to increase quickly as the nearest neighbour order increases, then starts to level out as it reaches the last nearest neighbour order. The graph in Figure 1 depicts that residential B & E’s are less spatially aggregated, and therefore more random because residential areas are not particularly ruled by laws…read more

Geographically Weighted Regression

Posted by in Geographic Information Systems

Geographically Weighted Regression When looking at changes over space, a typical regression model is not suitable because it doesn’t consider change over space and instead assumes that the processes are static over space. A regression model is a statistical technique that looks at the relationship between a dependent and independent variable. Ordinary Least Squares (OLS), a popular regression technique and common starting point for regression analysis, only provides a global model. OLS only creates a single regression equation to represent the whole process. OLS produces the single best line that…read more

Land Use Change in Edmonton from 1966 – 1976

Posted by in Geographic Information Systems

Executive Summary Between the years of 1966 and 1976, Edmonton saw significant increases in the amount of people residing in the city. The population of 381,230 increased by almost 100,000 to a population of 471,474. (City of Edmonton, 2018). Along with population growth, it is expected that land use changes will occur as the needs of the people and the area change. Our report reveals the extent to which cropland and woodland is being fragmented by the advancement of urban built-up area. It is key that the government develops a…read more

Crime in Vancouver

Posted by in Geographic Information Systems

Summary A crime map of Vancouver was created using both census tracts and dissemination areas. The classes were created from the box plots created using the Ordinary Least Squares (OLS) tool. Within both maps, the Moran’s I values show us that the data has a positive spatial auto correlation, however, this correlation is not close to a value of 1, and therefore is strong. Both maps display somewhat similar patterns when it comes to the number of residential B & E’s relative to the median household income and the total…read more

Digital Terrain Modelling and Multi-Criteria Analysis

Posted by in Geographic Information Systems

Summary A Triangulated Irregular Network (TIN) was created from an elevation dataset for the Osoyoos Lake region. The multi-criteria analysis map was created to meet the criteria set out by the botanist. The criteria focused on in this situation were for an area of 700 hectares,with an importance of aspect over elevation and slope. To create this map, the following steps were taken: A DEM was created from an elevation dataset, with the cell size (resolution) set to 50m x 50m (equivalent to 0.25 hectares). From this DEM, I was…read more

Least Distance & Least Cost Path

Posted by in Geographic Information Systems

Summary Using data provided by the UBC Geography Department, a theoretical proposed feeder line was created using the least cost path tool, where different weights were given to each cell depending on their resistance. A shortest-path route was also created as a comparison. The shortest-path provides the shortest possible route between the source transformer station and the proposed facility. While this is the shortest route in terms of distance, it is not the most cost-effective path as it is likely crossing land which would be expensive to build on. The…read more

Final Project – An Assessment of Translink’s 10-Year Vision

Posted by in Geographic Information Systems

Summary The goal of this project was to analyze whether Translink’s 10-year Vision to improve public transportation across Metro Vancouver assesses the current lack of rapid transit in the region. The project focused on ‘Phase Two’ of the 10-year Vision, which includes the implementation of the Broadway Corridor Subway and Surrey & Langley Light Rail. The project used data publicly available from various sources, and primarily utilized data about the mode of transportation used by residents from the 2011 NHS. Existing rapid transit routes were used alongside the proposed routes…read more

Environmental Assessment for a Proposed Ski Resort

Posted by in Geographic Information Systems

Summary The two maps above have been created as a tool to help visualize the area around Brohm Ridge which has been proposed as a site for the construction of a potential ski-resort. Various key components have been considered for environmental assessment of the proposed area. The following are the key components: Rivers; Roads; Areas under 600m; Fishery habitats; Old growth management areas; Ungulate winter range; Park Boundaries; and Red listed ecosystems. Various steps have been taken to analyze the data. The first was parsing the data, done by creating…read more

Spam prevention powered by Akismet