Class was cancelled on Friday, so the geography students didn’t have to present the assignments we had created. But, we did get to listen to the presentations from the GEM students! This week’s topic was crime and geography.
One particularly interesting (but rather depressing) presentation was called A Geospatial Analysis of Suicidal Bridge Jumping in the Metro Vancouver Regional District from 2006 to 2014. Suicide was decriminalized in 1972, but it is still relevant to this week’s topic.
The study by Lam, Kinney and Bell was interested in how suicide victims navigate their environment to choose a preferential place for committing suicide. Using the network analyst tool in ArcGIS, the authors found that most victims are willing to travel further distances to jump from more iconic and symbolic locations, such as Lionsgate Bridge (the most popular location to jump in Metro Vancouver). These victims were classified as ‘travel jumpers,’ in contrast to the much smaller number of ‘convenience jumpers’ (those who jump from locations that are close to their homes).
The paper Evan and I covered was called Space-Time Dynamics of Crime in Transport Nodes by V. Ceccato and A.C. Uittenbogaard. The objective of this study was to assess space-time variations of crime at underground stations in Stockholm, Sweden. They began with two hypotheses:
- Crime in underground stations reflects rhythmic variations of human activities (hourly, daily, weekly and seasonally).
- The specific vulnerability to crime of a transport node varies over time and space.
The analysis used ANOVA and Sheffe’s test and OLS regression models to check for crime variations over time. The paper outlined many of their results in great detail. Some of their findings were that:
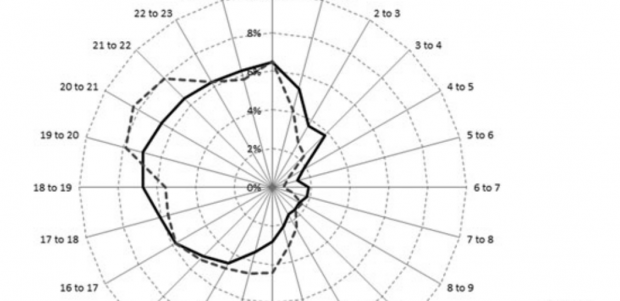
- peaks of crime in late afternoons and evenings, when most people are on the move. Therefore there is a greater risk of victimization.
- most crimes late in the evening and night were violent.
- vandalism takes place more often during late evenings.
- thefts occur most often in the afternoon and early evening.
All in all, we awarded this paper a 7/10. The methods and results were meticulously outlined (but almost too much – it was quite overwhelming to read). The OLS model was properly specified, and variables with potential multicollinearity were removed. Although acknowledged, there was potential for subjectivity when quantifying data such as the station atmosphere and environment. These were values that were rated on a scale according to the personal impressions of the two researchers. They also could have gone further with data visualization – it was a lost opportunity!