For this lab, the spatial relationships of crimes in Ottawa, Ontario were analyzed using a series of CrimeStat tests and ArcGIS mapping. We focused on automobile theft, commercial and residential break and enters. CrimeStat tests generated nearest neighbour and Moran’s I indices. ArcGIS was used to map crime spatial relationships visually using fuzzy more, nearest neighbour hierarchical clustering, and kernel density functions. The Knox index was used to compare the temporal relationships between car thefts and space.
- Nearest Neighbour Analysis
CrimeStat was used to produce nearest neighbour statistics, which can be used to determine if patterns of crime activity show evidence of clustering or dispersal. All index results had a value lower than 1.0, which indicates that all three variables demonstrate clustering. Spatial clustering may be a result of municipal zoning laws. Commercial districts may be restricted to certain areas of the city; therefore, commercial break and enters will be close to each other. In contrast, residential break and enters are least spatially aggregated. Residential areas cover a larger portion of the city, so generally speaking, a ‘smart’ criminal in a residential area would space their crimes further apart to avoid being caught.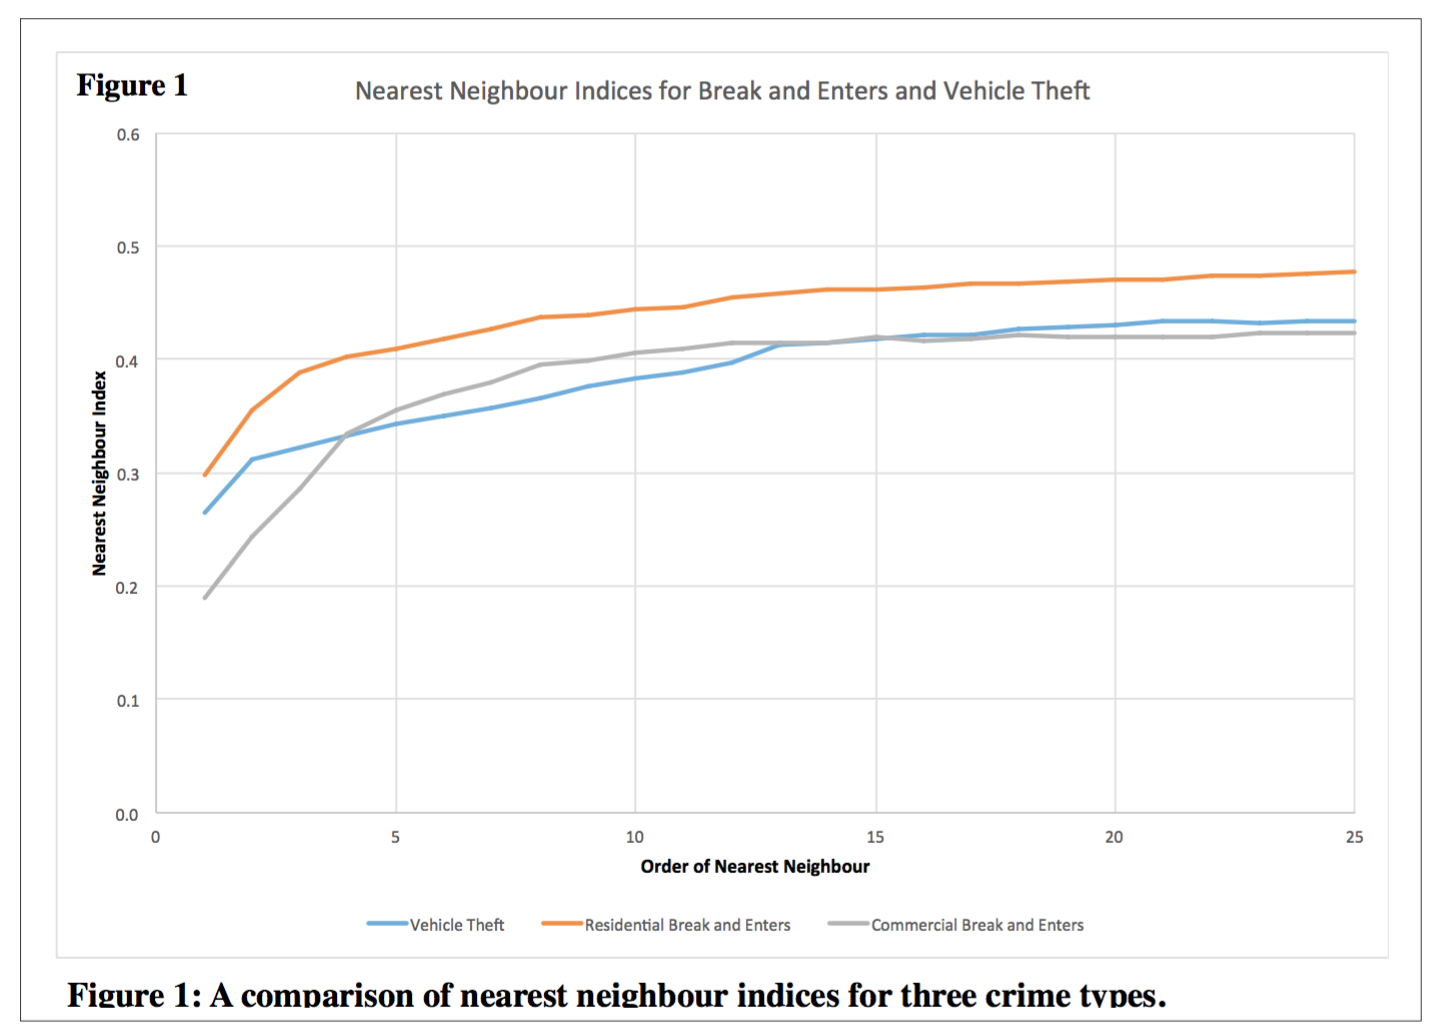
2. Moran’s I Analysis
Moran’s I correlograms were generated using CrimeStat and were visualized in excel. The plot shows how concentrated or distributed the spatial autocorrelation is. Contrary to the nearest neighbour indices, a value of 0 in the correlogram analysis indicates no spatial autocorrelation. The results indicated that at shorter distances, residential break and enters had a significantly higher amount of spatial autocorrelation. Vehicle theft was also relatively spatially aggregated. The close relation between commercial break and enters and population implies that B&Es are largely based on population distribution. In contrast, stolen vehicles and residential B&Es are significantly more spatially aggregated than population. This shows that regardless of population distribution, there are other processes influencing their spatial patterns.
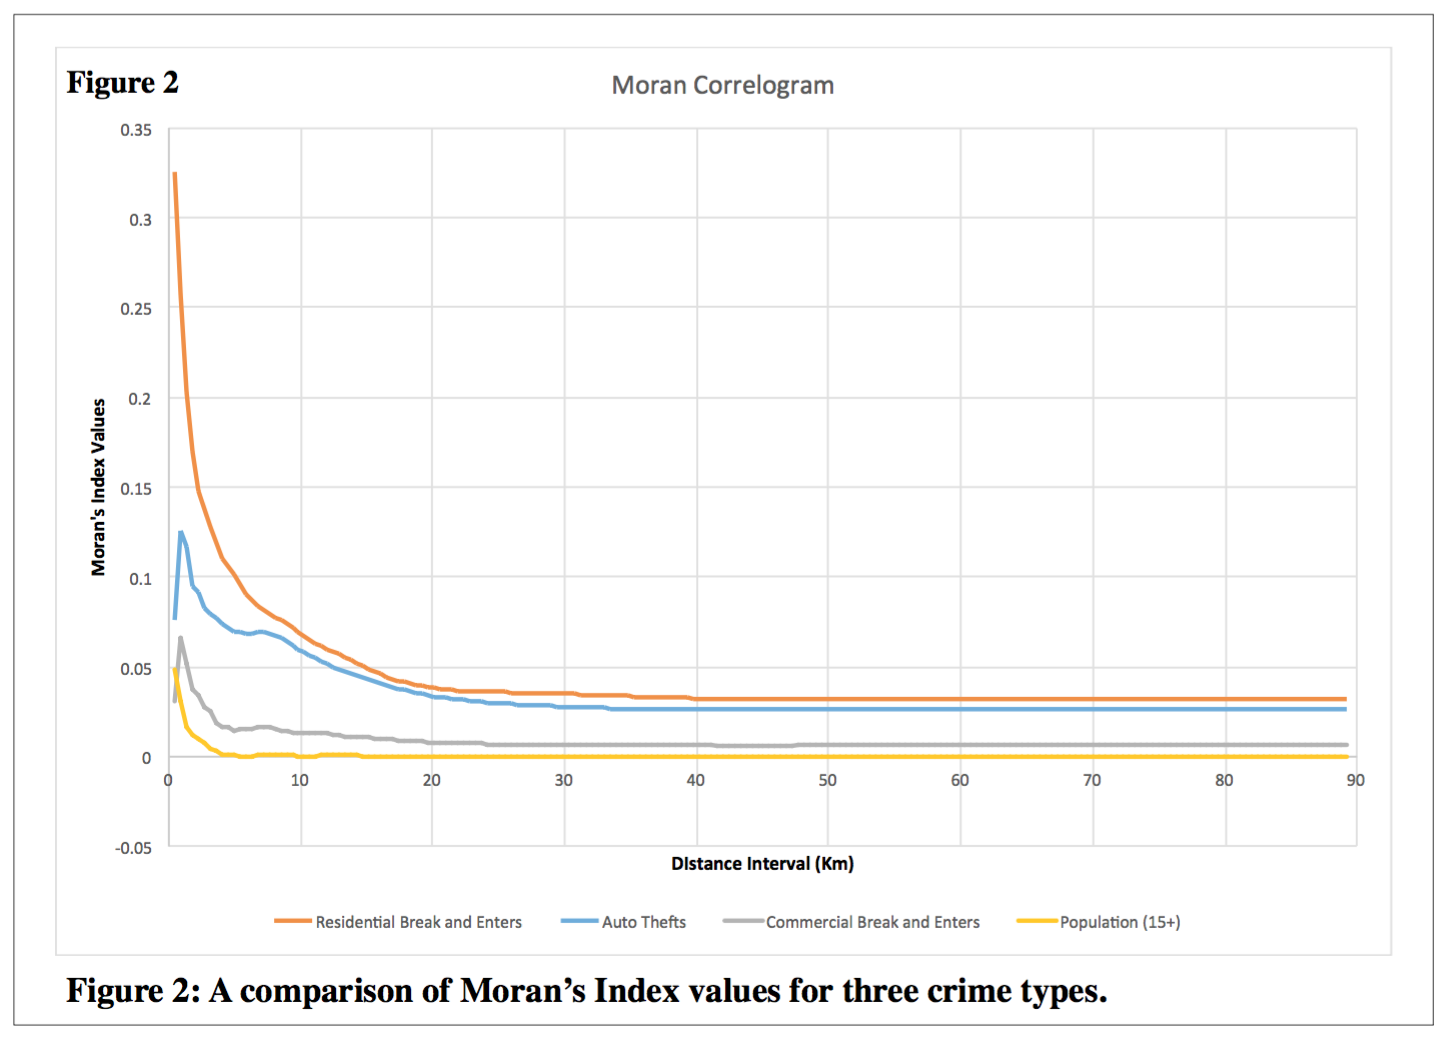
It is important to note that because all land use is controlled through land use bylaws, areas and crime incidents can never be completely random. We should not expect to see an observed nearest neighbour index approaching 1, nor a Moran’s I statistic reaching 0 in these scenarios.
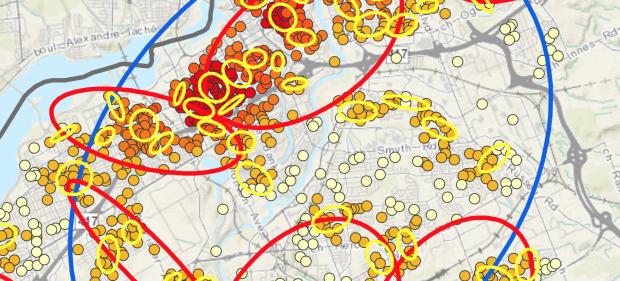
3. Fuzzy Mode Clusters and Nearest Neighbour Hierarchical Spatial Clustering (NNHSC)
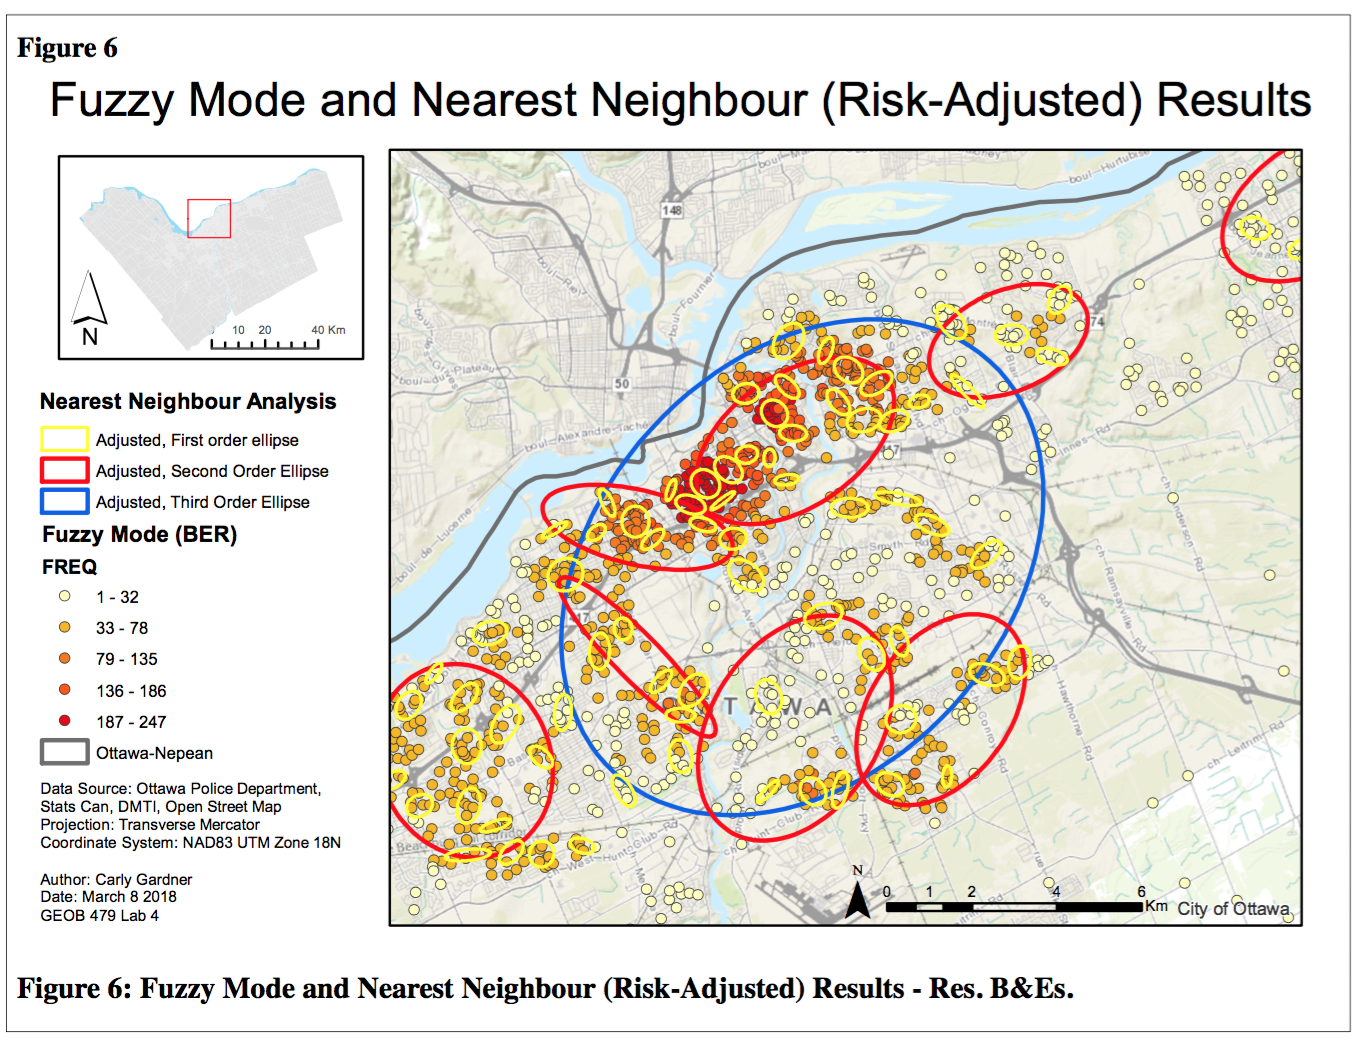
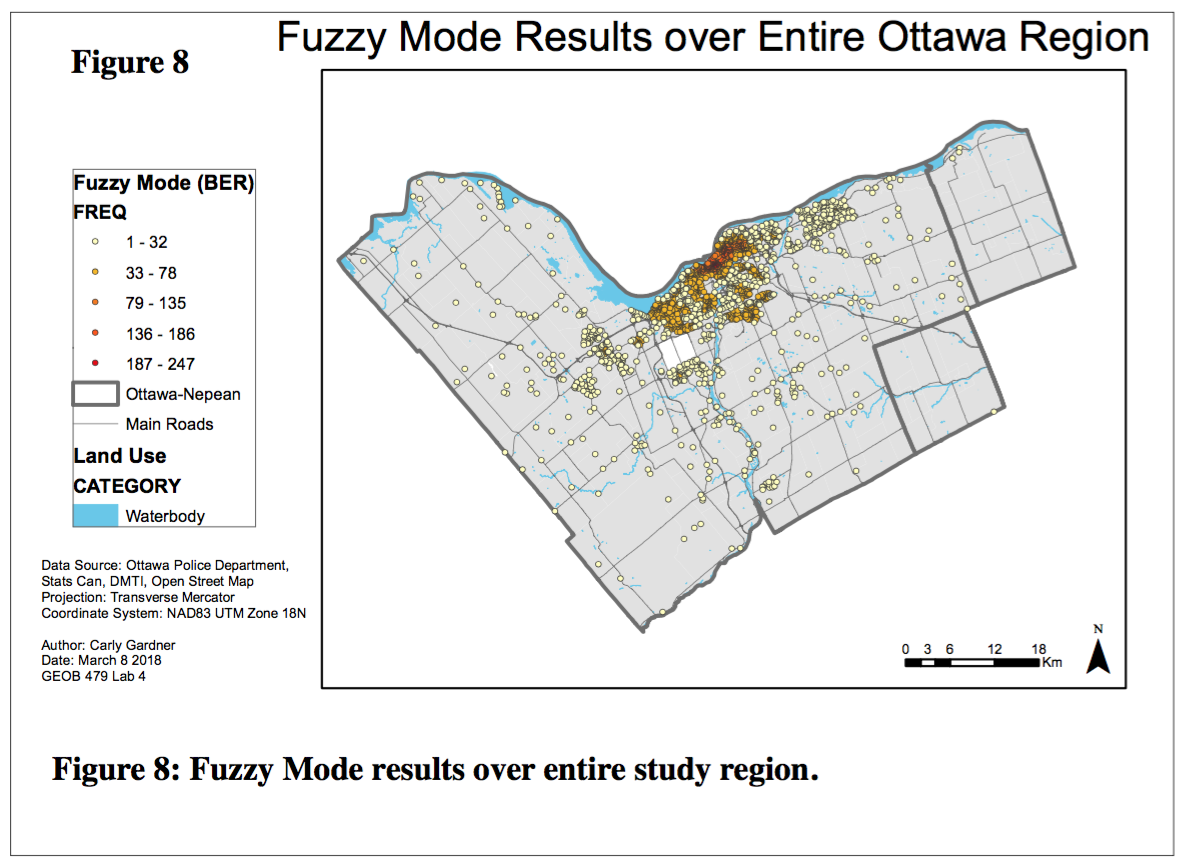
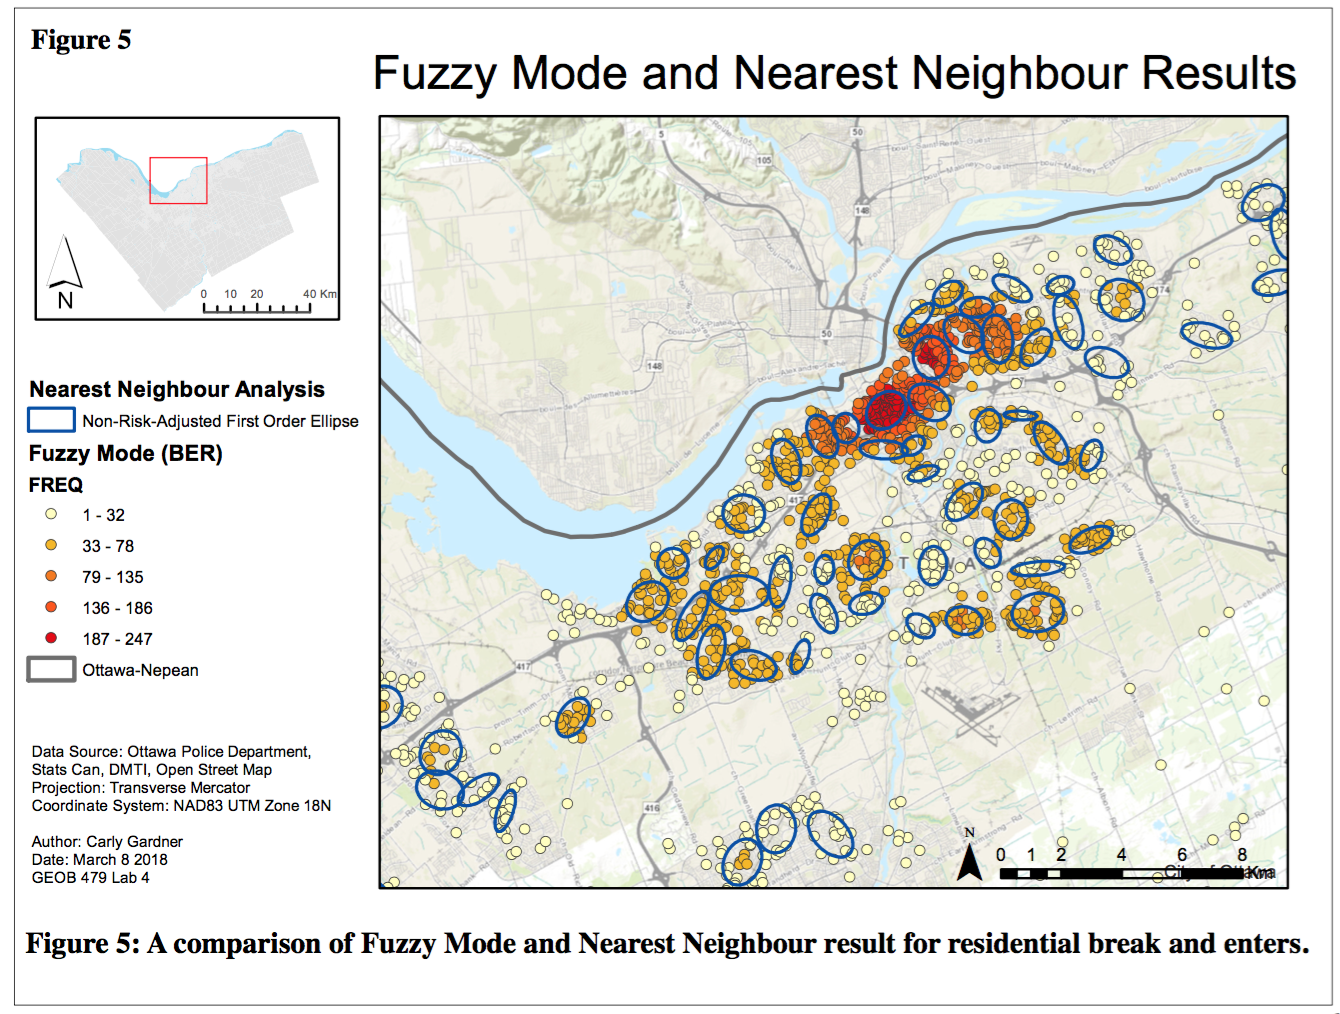
In the fuzzy mode analysis, each dot represents the number or residential break and enters within 1000 metres of a point, and are coloured corresponding to this frequency. Clearly, residential B&Es are concentrated in the downtown area. In contrast to the fuzzy mode clustering approach, the ellipses generated in the NNHSC identifies groups of incidences based on statistical criteria rather than a ‘closeness’ value. Each ellipses encircles regions that have a similar crime rate. There is a clear overlap between points of residential break and enters observed in fuzzy more clustering (hot spot analysis) and in the NNHC.
4. Standard (Non-Risk Adjusted) versus Risk-Adjusted Results of NNHSC
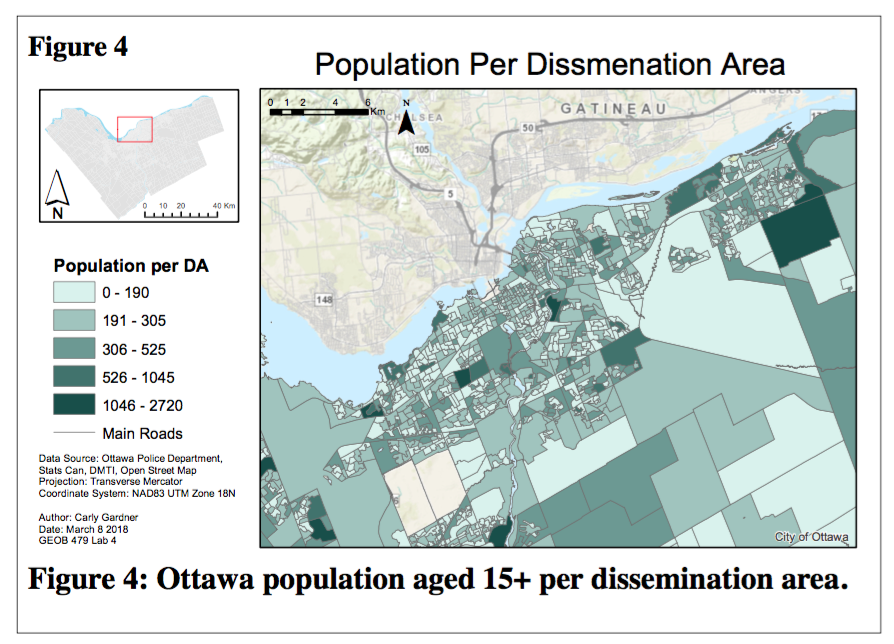
The standard results of the NNHSC identify clusters using absolute data. This may produce misleading results because it does not consider underlying conditions, such as population distribution. Areas with higher population are likely to have higher crime rates, so the relative risk in one neighbourhood may not be equal to the relative risk in another. To account for these differences, the relative-risk map uses a secondary surface to adjust these probabilities accordingly.
5. Knox index
The Knox index can be used to determine if there is both spatial and temporal clustering in the reports of crime. The results indicate that there are more car thefts clustered in space and time than we would expect if they were randomly distributed. There is also evidence of possible dispersion. These results can potentially be explained because some places that attract cares – such as commercial districts – are restricted to certain areas of the city by municipal zoning regulations. Car thefts in parking lots in these shopping districts will have incidents closer in time as well, because cars will typically only be present during operating hours. In contrast, vehicle thefts in residential areas may be more likely spread across different neighbourhoods and times.
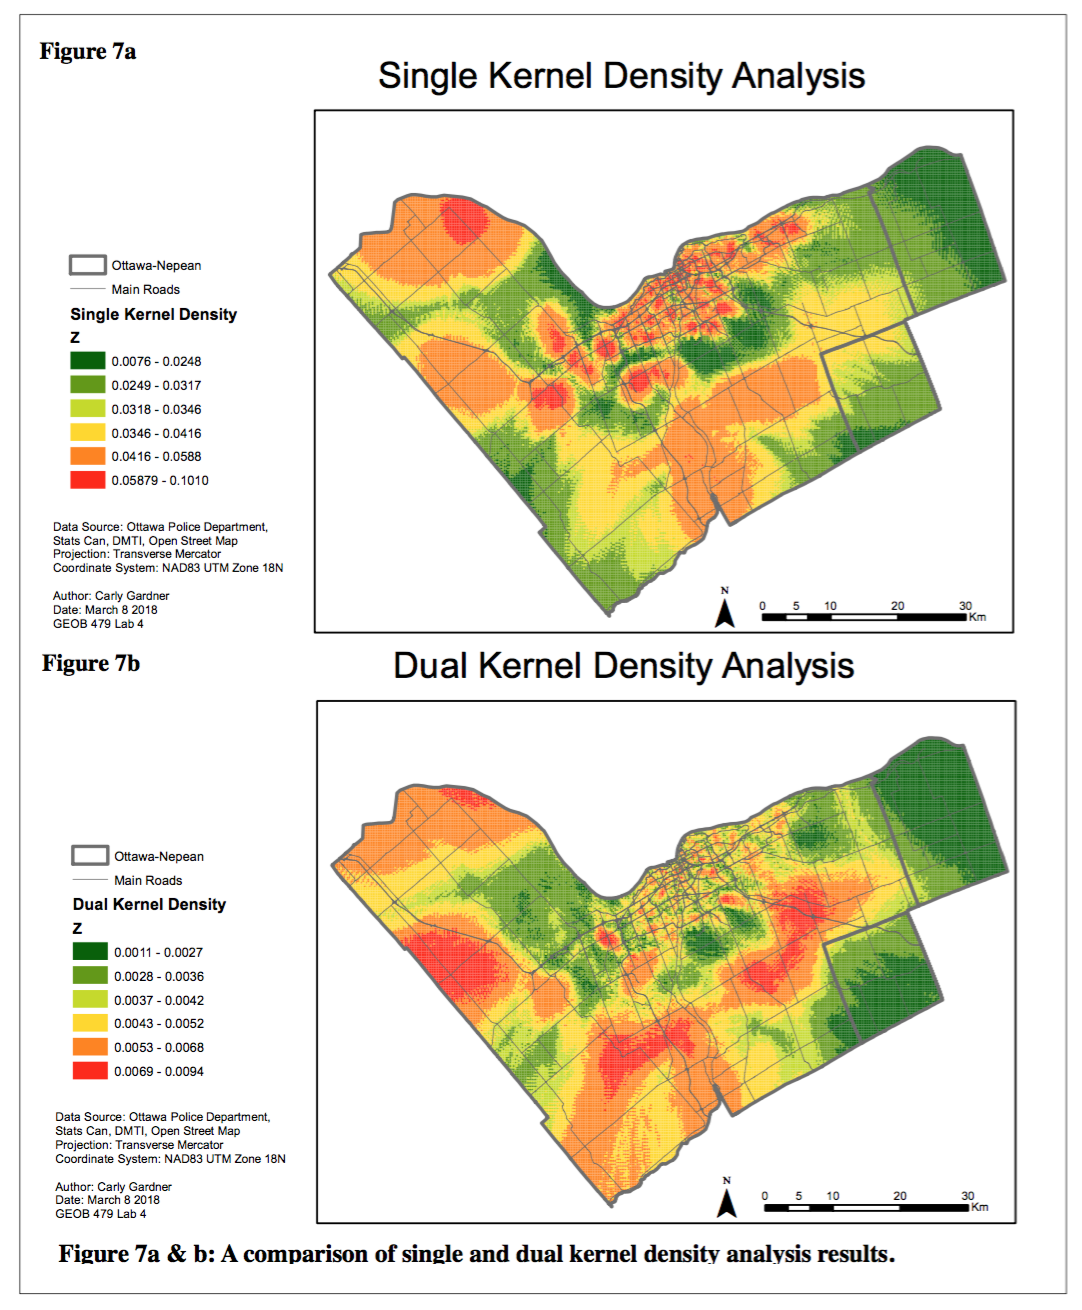
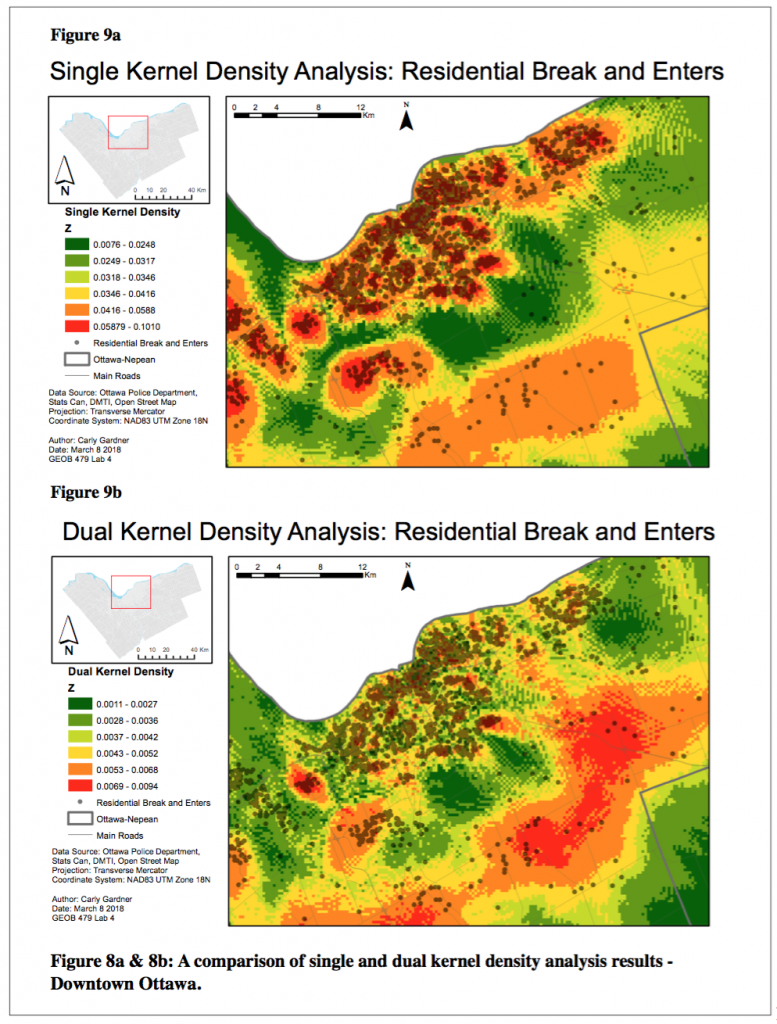
6. Kernel density estimation
The kernel density analysis was used to identify areas with high numbers of residential break and enters. A single kernel density considers absolute density of crimes, while dual kernel density considers population (or, the relative density of the crime). The results of the dual kernel density analysis produced comparable clustered areas as revealed in the risk-adjusted NNHSC.