Based on my experience in the Netherlands, I have observed and compiled ten critical success factors (CSF) of land use and transportation that I believe contribute to the Dutch quality of life. This course has been an amazing opportunity to experience Dutch transportation engineering and community planning in person. The lectures from industry professionals – planners, architects, engineers – have given me such a unique and valuable inside look at urbanism in the Netherlands. Now that I am back home in Canada, I continue to be surprised at the knowledge and greater understanding I have taken away from this amazing experience.
Accessibility to affordable housing, services, job sites and active transportation is vital for sustainable communities. I was happy to learn that the Dutch have robust polices in place (ex. 1901 Dutch Housing Act) to ensure that an adequate amount of social and affordable housing is accessible to low and middle income groups. Today, about 80% of Dutch rental housing stock is classified as social housing. Affordable housing is considered a right, rather than a privilege.
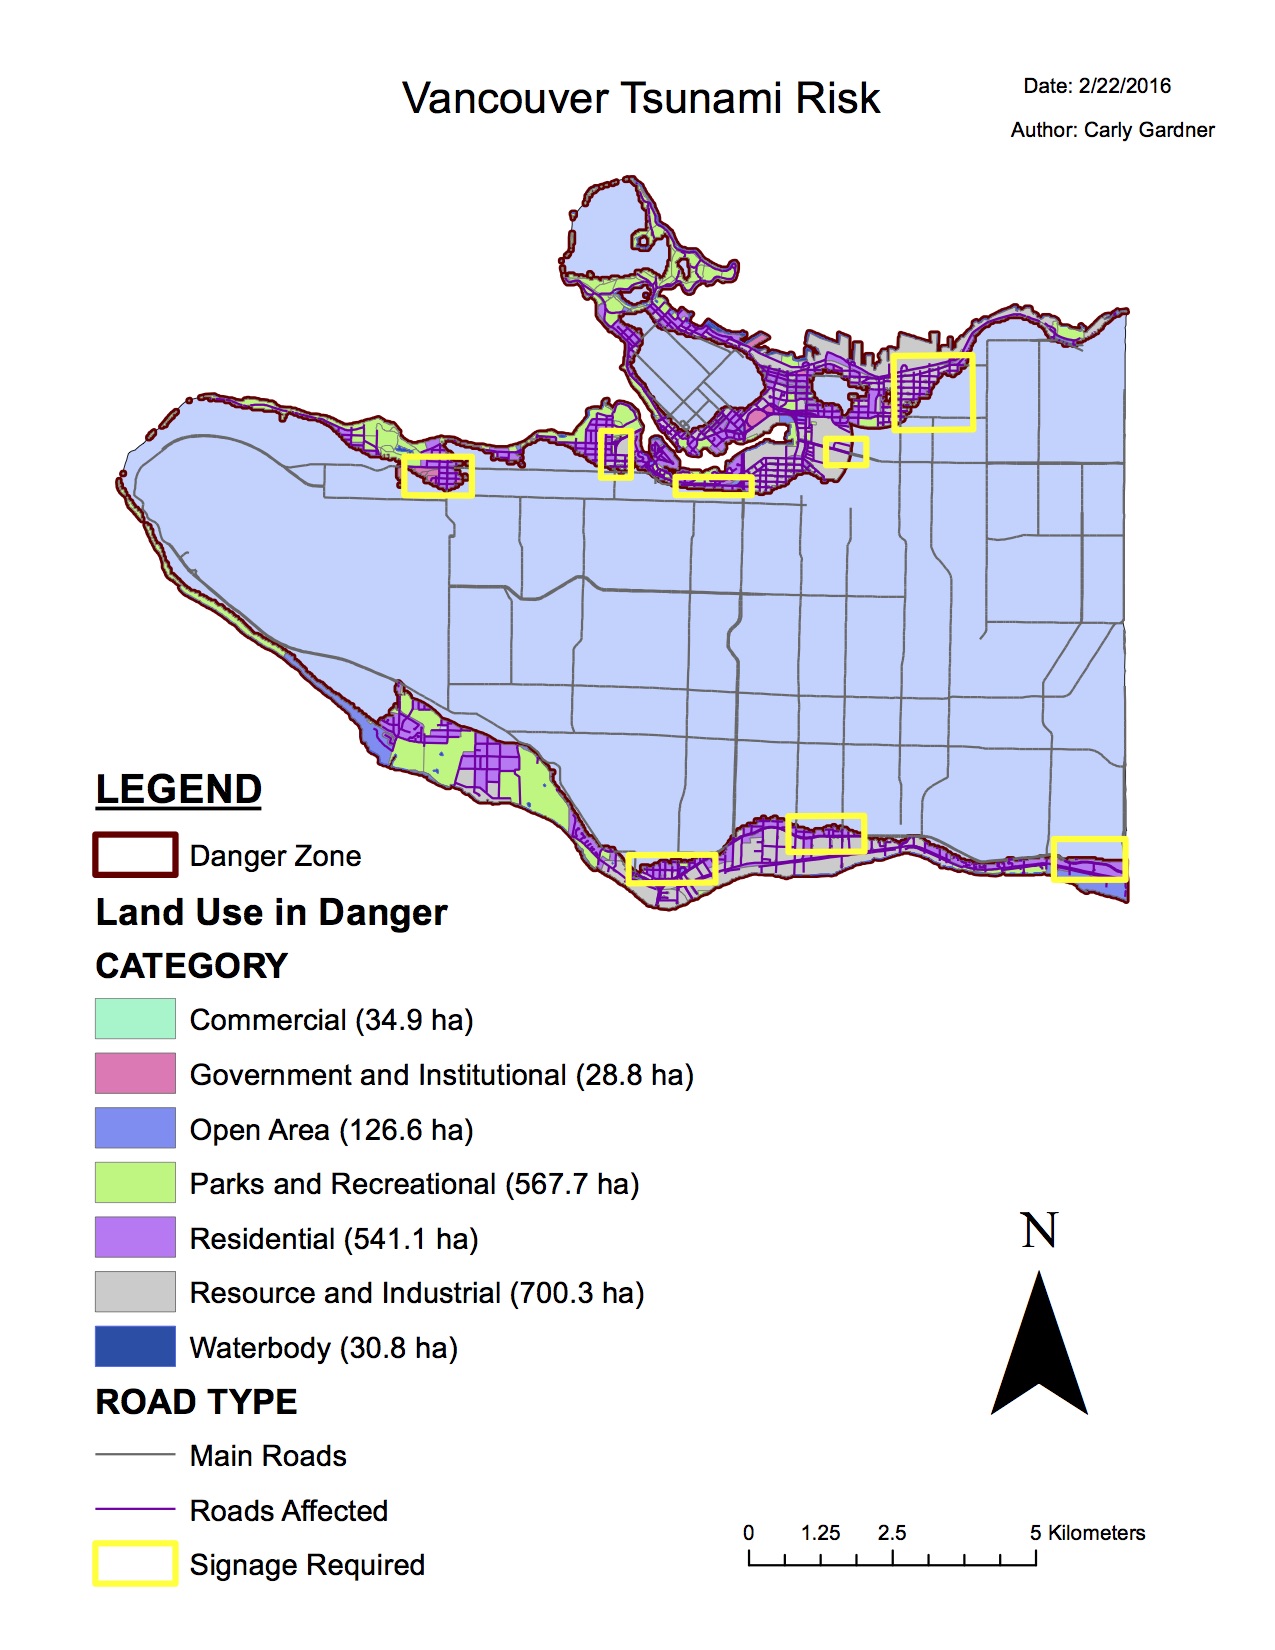
Accessibility is also addressed through land-use and transportation strategies. A diverse land-use mix allows people to live close to services and job sites and decreases the distance people must travel to access them. A mix of building uses and types allows for short trips, which makes walking and biking viable travel options for most people. I witnessed this land-use mix every day in Delft: the first floor of most buildings was commercial (ex. restaurants and shops), and upper floors were typically residential. Similarly, Vancouver recognizes this important quality of zoning and urban design and implements it through the construction of ‘mixed-use’ buildings.
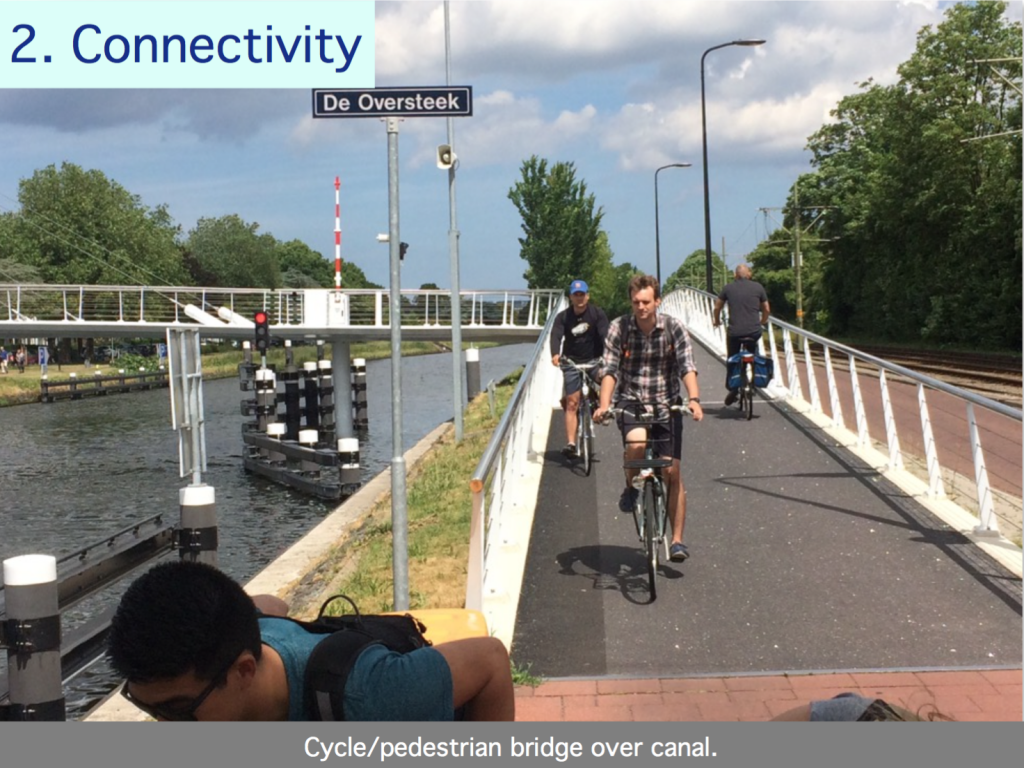
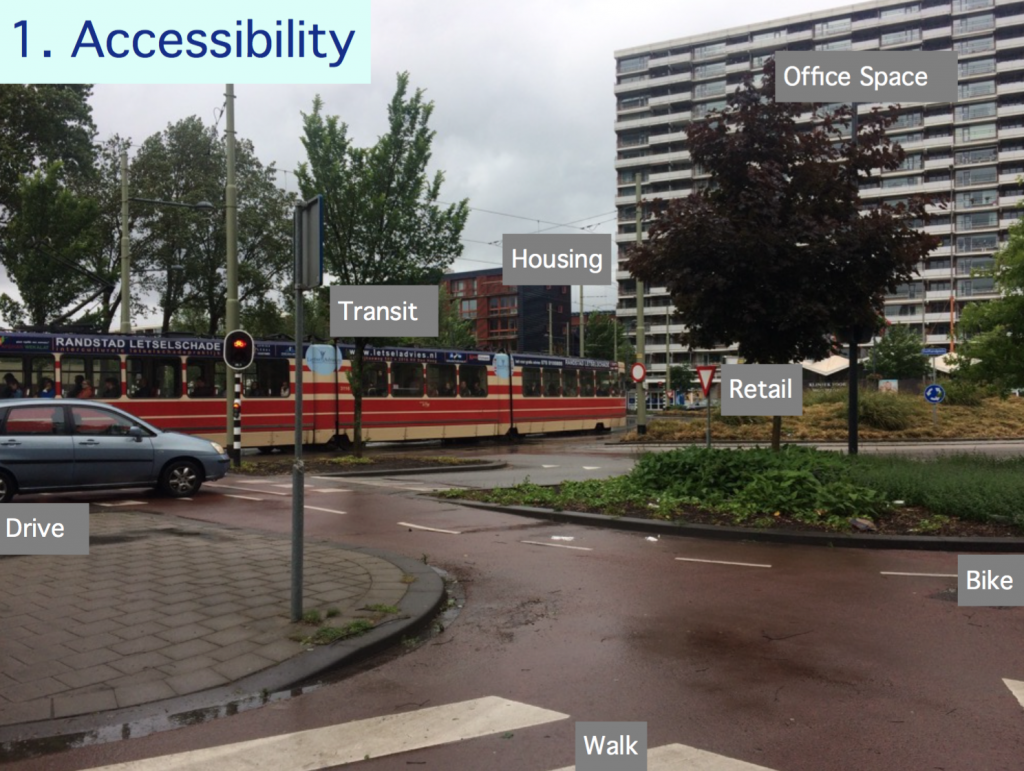
High connectivity of transportation networks allows for efficient travel, with more route options and more direct travel routes. Fine- grained interconnected transportation networks facilitate shorter travel distances, disperse congestion, and encourage cycling and walking. We saw an excellent example of how infrastructure can foster greater connectivity between different travel modes at a tram/metro station in Amsterdam.
The same platform and tracks were used by both tram and metro, which was made possible by pantographs extending to the electrical lines and a platform with two different heights. The same vessel can physically transform from tram to metro.
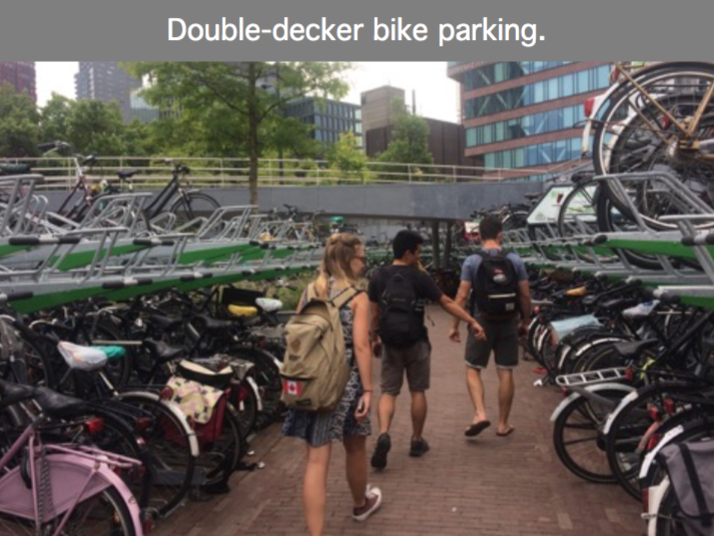
It should be noted that even in the Netherlands, transportation connectivity can be improved. Even with high quality transit service provided for the majority of a trip distance, a lack of connectivity between the transit stop and the travellers’ final destination deters many people from using transit in the first place (aka, the ‘Last Mile Problem’). The connectivity of cycle routes at local, regional and national scales is constantly being improved, as is cycle parking at major transit stops. This is done to enable people to cycle these final miles without putting cycle storage over capacity.
Permeability is also essential for network connectivity. In the Netherlands, pedestrian and cycle routes are rarely interrupted by high levels of traffic or physical barriers. Underpasses and bridges are strategically placed to ensure that all areas of the transportation network are connected. It is also important to note that vehicle networks are becoming less connected in many cities in order to
discourage motorized traffic and prioritize active transport.
We witnessed this in the community of Tanthof, which was specifically designed to confuse vehicle drivers and make it difficult to navigate by car. In contrast, cycling, transit, and walking are encouraged by their high degree of network connectivity and permeability through the neighbourhood.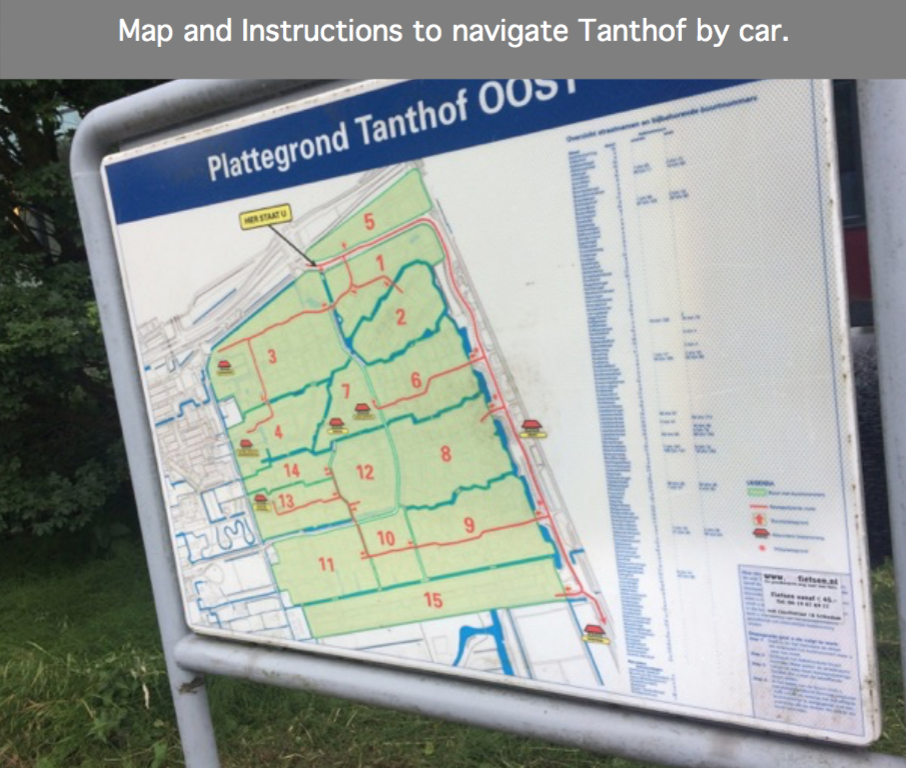
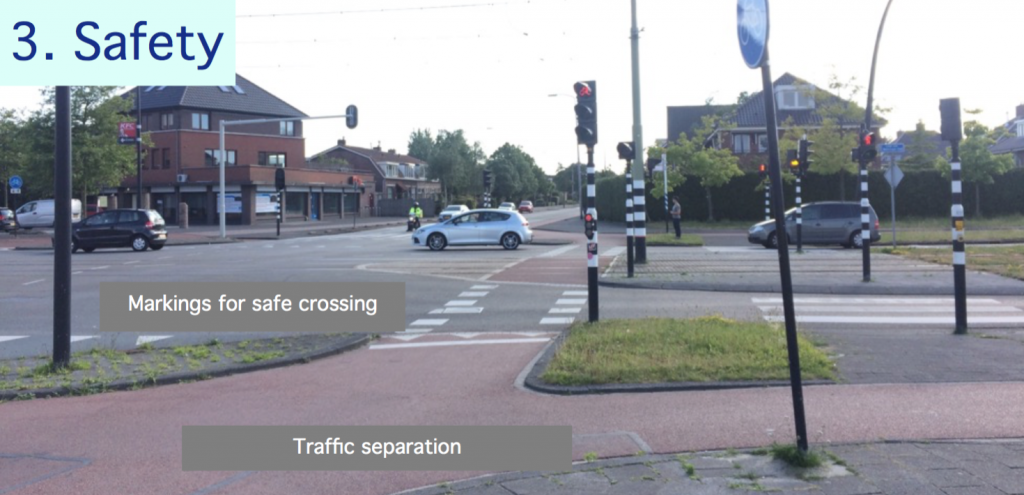
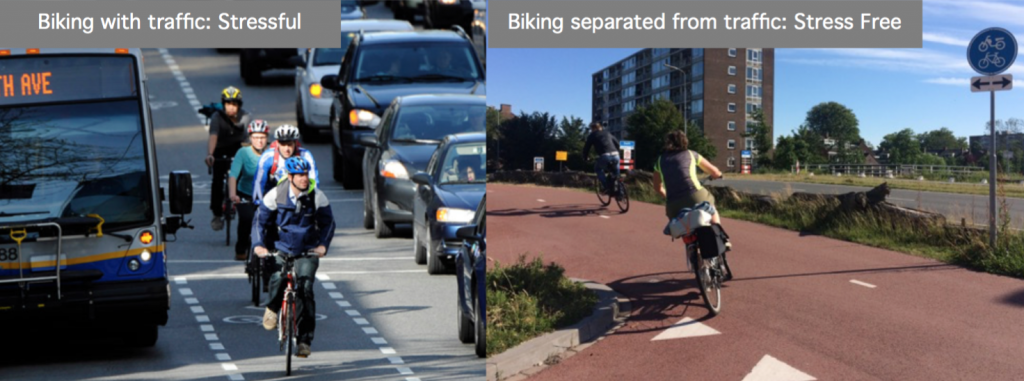
The Dutch are experts in safe transportation planning and design. As one of the safest cycling nations in the world, they know how to design infrastructure in ways that limit conflicts. During my three weeks in the Netherlands, I have seen two primary strategies for safe transport: separation and traffic calming. Separating modes (bikes, pedestrians, and motorized traffic) and speeds (high and low) prevents serious accidents from occurring. While separated cycle tracks are an easy example of these strategies, we also see complete separation at junctions when cycle tracks take a tunnel or overpass to avoid vehicle traffic. 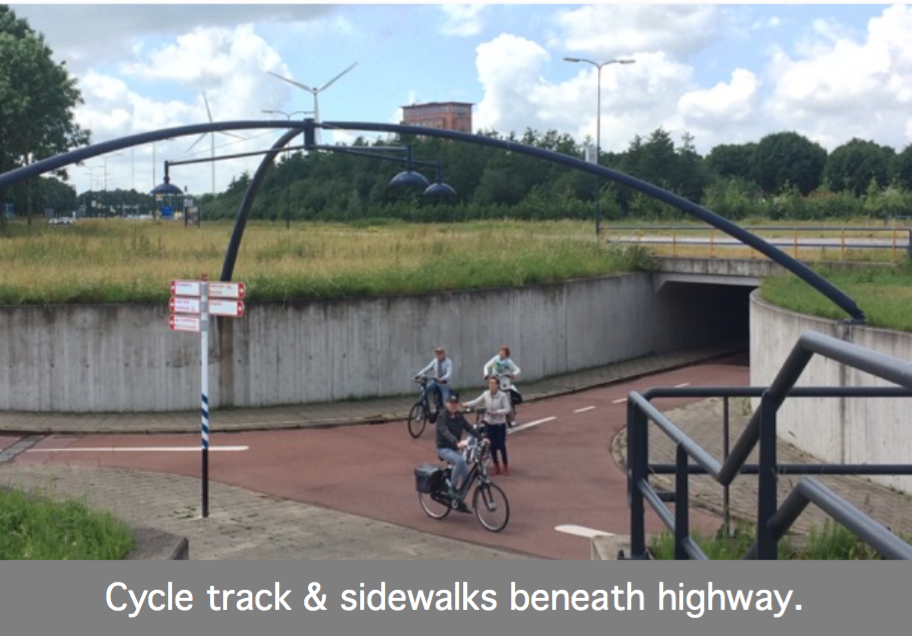
Modes and speeds are also separated with a variety of physical barriers including moveable bollards, painted lines, raised tracks and/or ‘natural’ barriers, like green-space or planting boxes. While separation improves physical safety, the Dutch also design for perceived safety. It’s simple: when cycling feels safe, more people are willing to do it. Now, it is common practice for cars to be diverted outside of city centres to decrease the risk of accidents, reduce traffic stress, and improve air quality. Traffic calming is also implemented with speed bumps, narrowing of lanes, low speed limits, and/or traffic circles.
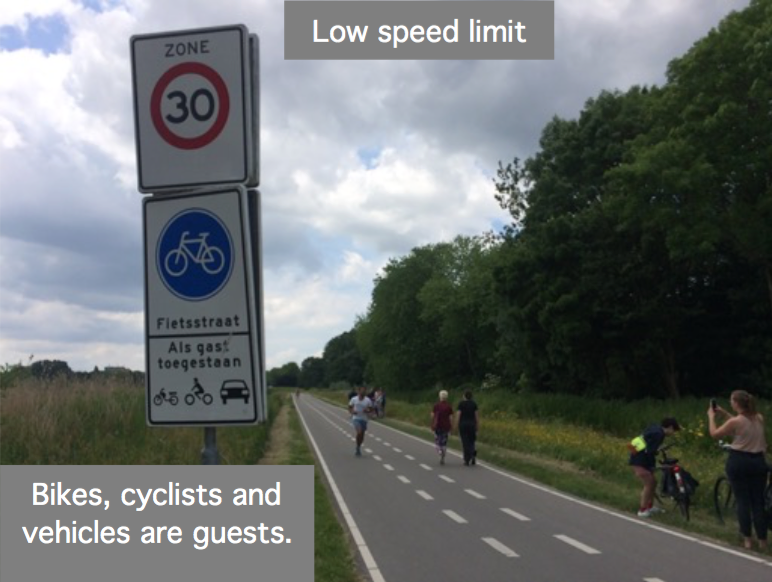
These safe transportation design strategies are guided by the System Approach to Safety, which we learned about at SWOV (the Institute for Road Safety Research in the Netherlands). People are limited in their ability to process information; as such, human error is impossible to completely eliminate. Dutch transportation infrastructure designs are kept simple in order to eliminate as much chance for error as possible. That is, the Dutch design transportation infrastructure that all road users will find easy to use.
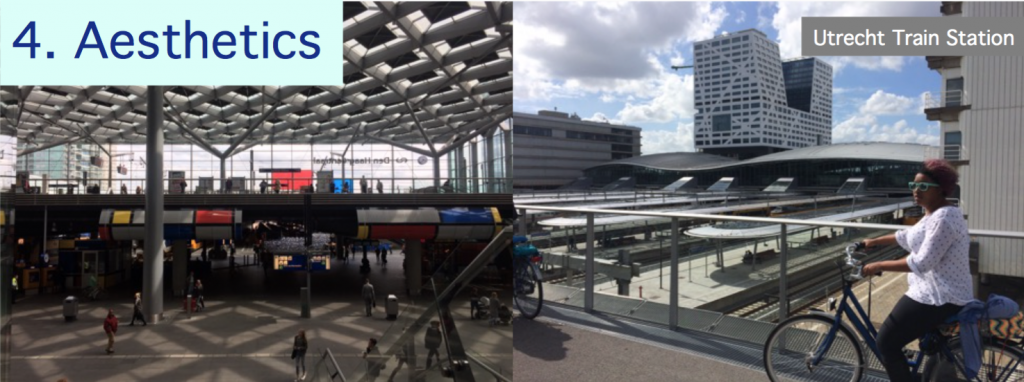
An environment that is scenic, comfortable and peaceful goes a long way to improve the Dutch quality of life. Aesthetics are a key tool to increase transit ridership and ensure a pleasant travel experience. The quality of my experience on Dutch transport was made excellent by their high standards for cleanliness, architecture, as well as interior and landscape design. Even the design of security cameras in train stations was nonaggressive!
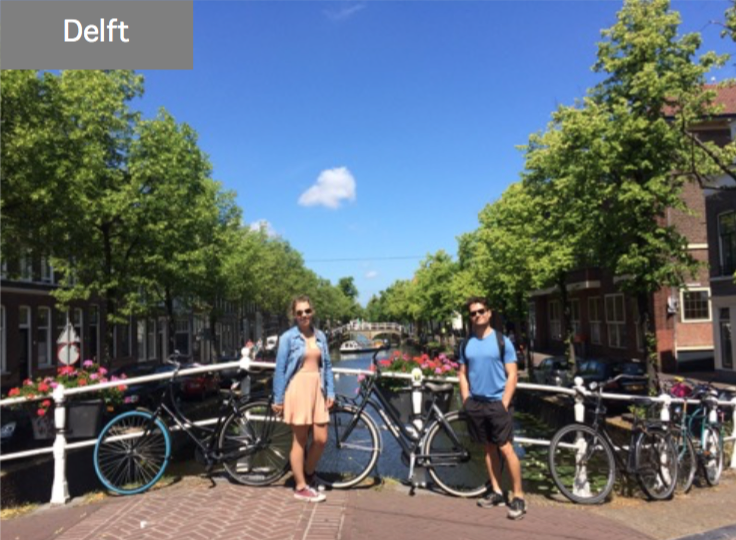
Land use aesthetics are also important in the Netherlands. The canals, public squares and windmills create a distinct atmosphere and identity that is recognized across the globe. While the Netherlands can be recognized internationally, a smaller scale of identity – or “sense of place” exists for each city and many neighbourhoods. that we travelled to. For instance, I found Houten inorganic, sterile and rather unsettling. In contrast, Rotterdam felt like a modernized centre for innovation and experimentation. While a “sense of place” is an inherent quality of community identity, it is often moulded intentionally through planning and design initiatives (ex. public art, architecture, and Rotterdam’s ‘City Lounge Project’). Aesthetics play an important role in shaping a sense of community and character.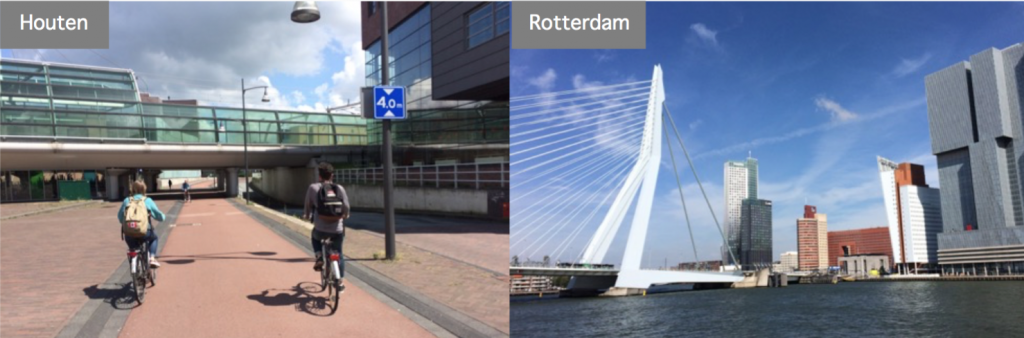
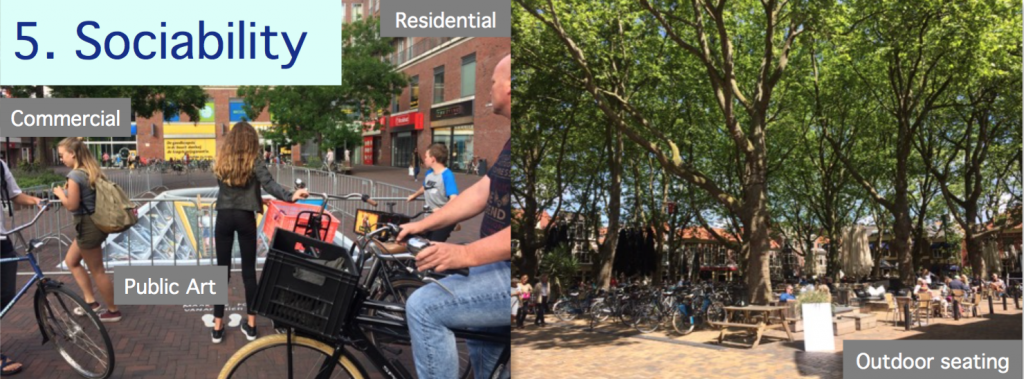
The Netherlands knows how to create spaces for social interaction. On my walks through Delft and other Dutch cities, I’ve seen charming public squares with outdoor seating, cafes, lights, public art and greenery (it blew my mind to learn that many – if not most – of the public squares were recently parking lots). A pleasant space creates areas where people are willing to spend time, which encourages public interaction and supports local businesses too.
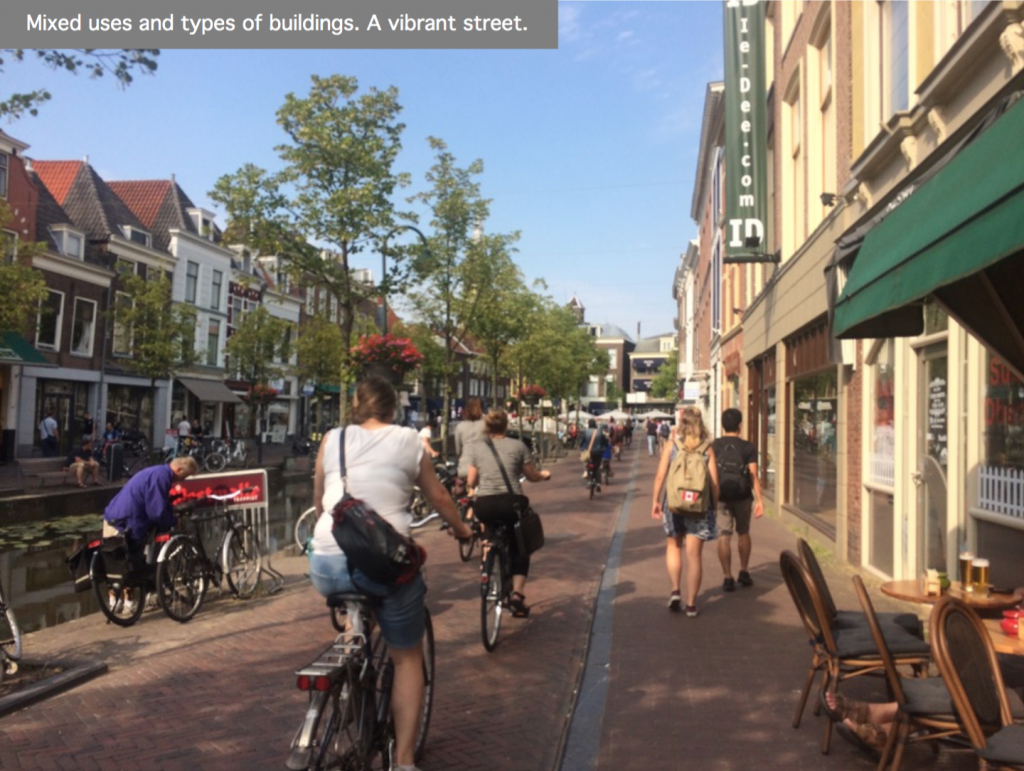
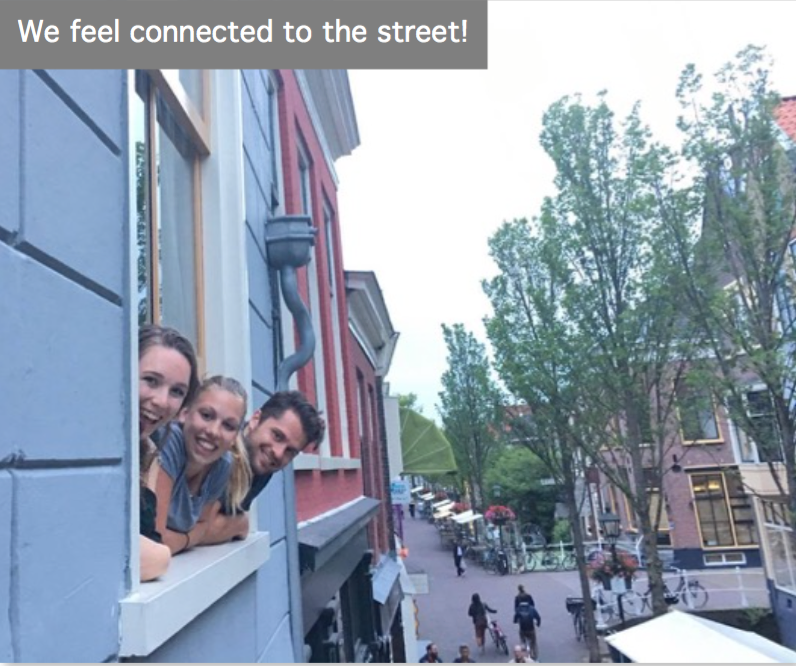 Sociability relies on more than just aesthetics, however. Human-scale buildings maintain our connection to the street – a complex relationship that improves social safety by keeping ‘eyes on the street’. A mix of building types and uses keeps the street active and transforms spaces into vibrant places. A diversity of buildings, residences, businesses and other uses – as well as a diversity of users – develops strong, vibrant and socially sustainable communities. There were several times that we would wave and chat with strangers walking in the street below our hostel, or in the apartment across the street. You are close enough to the ground to feel connected to what goes on below.
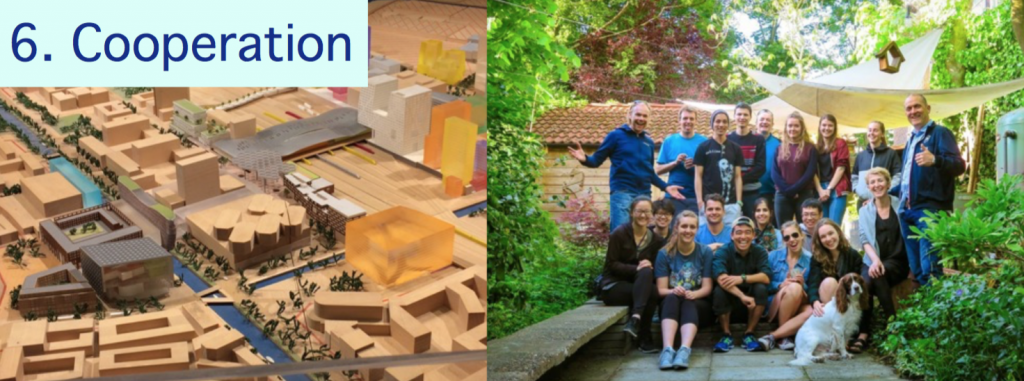
Multi-scale cooperation between public, private and government actors is essential to achieve the high quality of life that is enjoyed in the Netherlands. I have learned that the Dutch highly value public consultations and work with the public, researchers, and private companies to ensure that strategies are best for each project or scenario. For instance, when the public protested automobiles in the 1970s, the Dutch government was responsive to the social movement and worked to find solutions including the restriction of motor vehicles in cities and to make cycling more attractive.
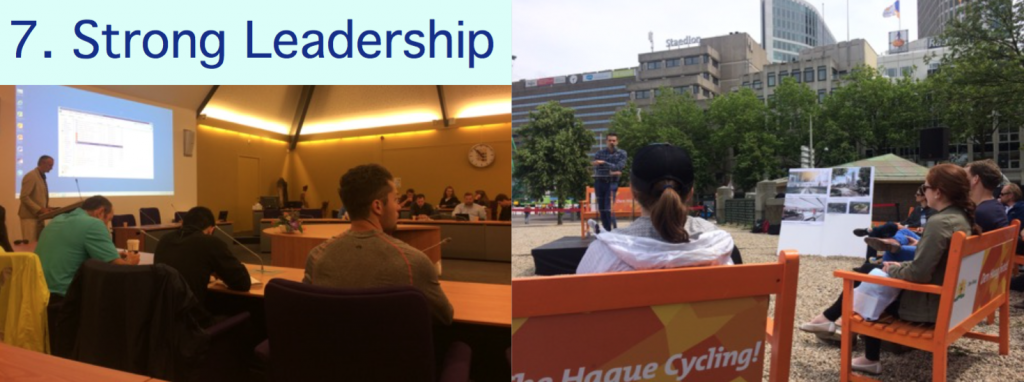
The centralized planning and control by the Netherlands government has been a critical success factor in their movement towards sustainability. While it may seem counterintuitive, this type of control creates an environment for innovative ideas to thrive. In short, the Dutch get things done. These include incredible engineering feats (ex. canals, pumps, and dikes) to manage flood waters and reclaim land, the harnessing of wind energy and other green energy alternatives, the containment of urban sprawl with firm growth boundaries and preservation of green space, and the development of safe and efficient long- term transportation infrastructure (ex. separated transportation modes and speeds, traffic circles).
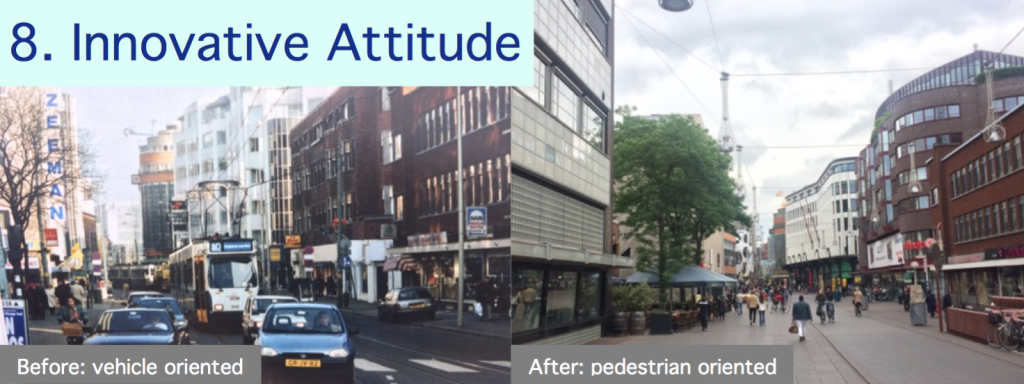
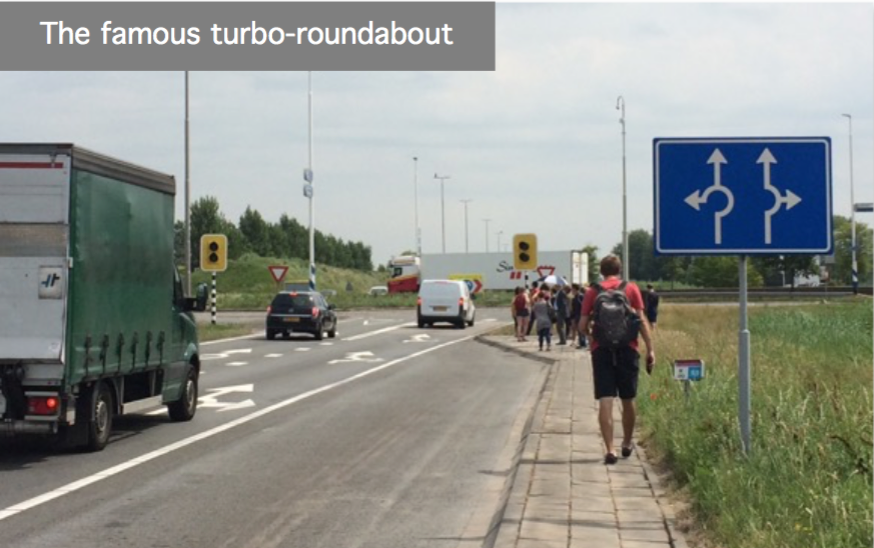
The Dutch experiment with new technology and new designseven with the potential for failure. The inventor of the turbo roundabout was Dutch!
Rotterdam is home to the first ever
pedestrian-only shopping street! Even policies are innovative. For example, when requested by a resident, cities in the Netherlandsmay temporarily ban cars from a residential street. The ban is put in place for roughly three months, at which time a survey is completed. If the experiment goes well and residents are pleased with the arrangement, the pedestrian zone could be made permanent.Sometimes, the city will remove cars from city centre and transform it into a pedestrian space. We saw examples of this in Amsterdam, Delft, Utrecht, Rotterdam and many there places. Sometimes these projects work, and sometimes they don’t. The point is, we aren’t going to find solutions if we don’t experiment first!
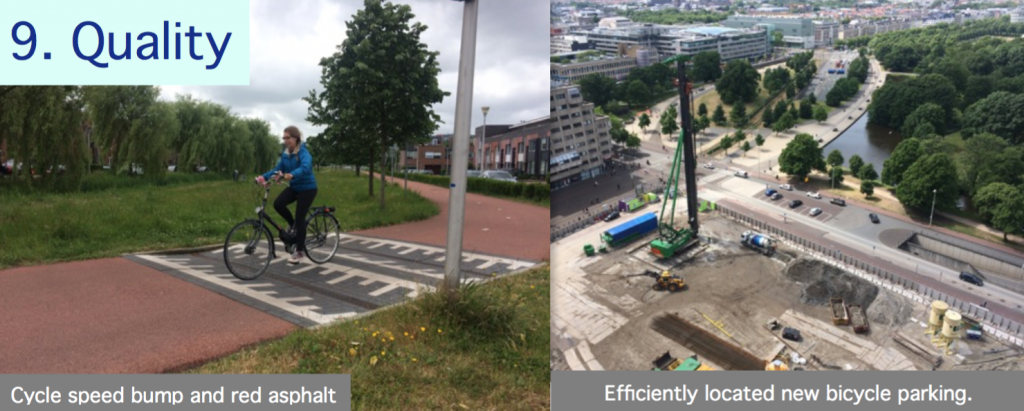
High standards for design, policy, infrastructure and planning results in efficient, resilient results. For example, Dutch bike paths are often constructed with a red pigment mixed into the asphalt rather than a simple layer of paint. Although the upfront cost may be greater, the higher quality pigment will stay visible even with wear, which is safer and less expensive in the long run.
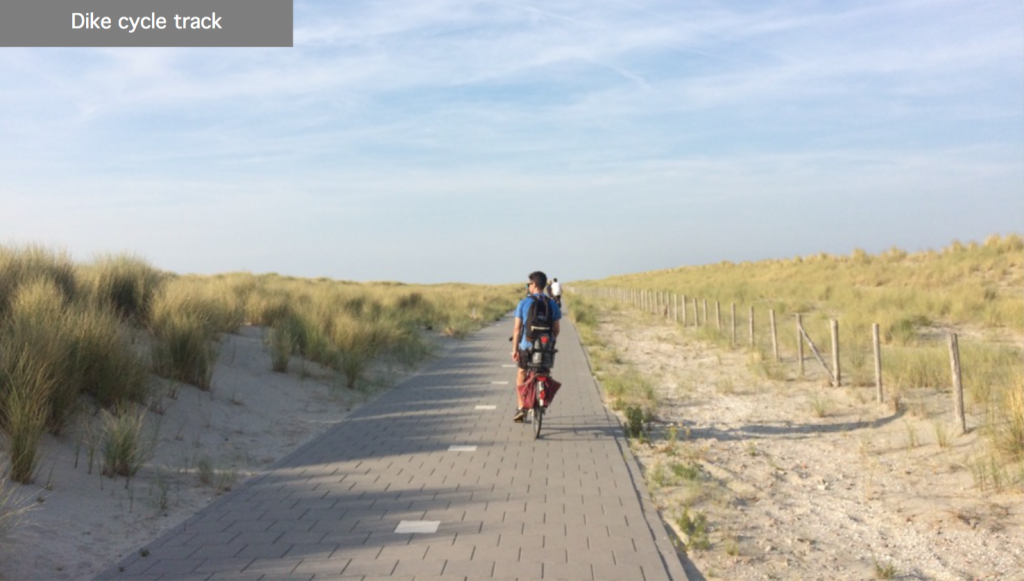 Quality goes beyond durability. Functional ambiance – the combination of multi- functionality and aesthetics – is also incorporated into Dutch transportation design. For example, kilometres of coastline between the Hook of Holland and Scheveningen are equipped with a hybrid structure of camouflaged dikes, a sandy foreshore, as well as cycle and pedestrian pathways. The dikes act as flood protection, active transportation corridors, tourist attractions, and improve the local aesthetics.
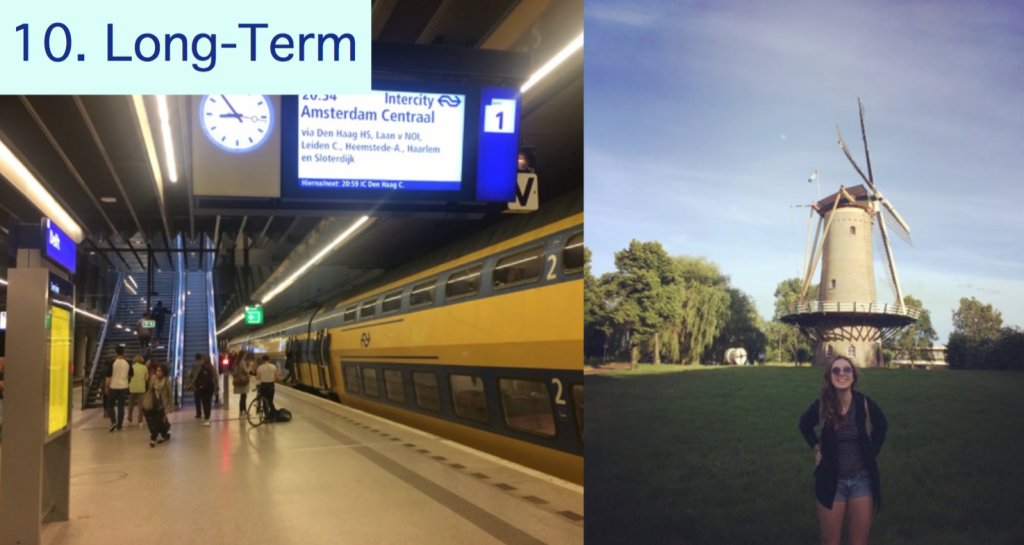
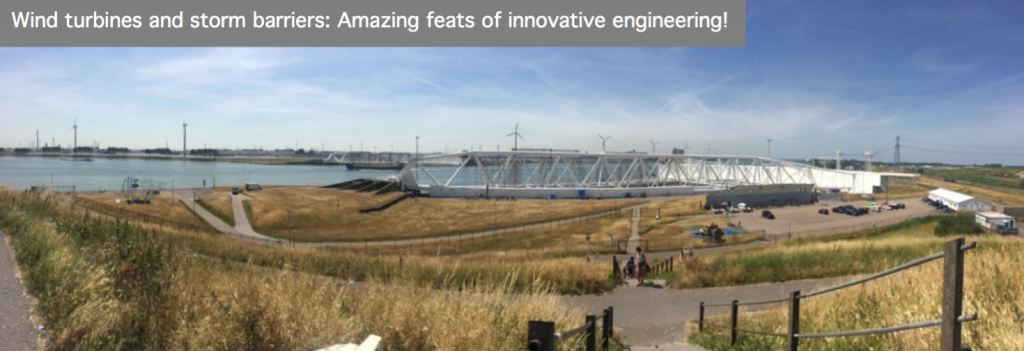
A long-term vision is necessary for a high quality of life to be sustained for generations. Long-term visions consider the three pillars of sustainability – economic, social, and environmental – and are of utmost importance in the face of climate change and uncertainty both in the Netherlands and across the world. The Netherlands uses a long- term vision in their plans for resilience. For example, after a major flooding incident in the 1950s, the Netherlands developed an extensive system of dams and storm surge barriers to prevent a similar catastrophe from ever happening again. New projects are being designed to withstand the effects of climate change and rising sea levels for the next 190 years. The Netherlands are also leaders in wind energy, which they have used as a power source for centuries. Today, all Dutch electric trains are 100% powered by wind energy.
Based on my experience in the Netherlands, these aforementioned critical success factors are what I consider to be the top ten most important criteria to promote a sustainable community and high quality of life.