


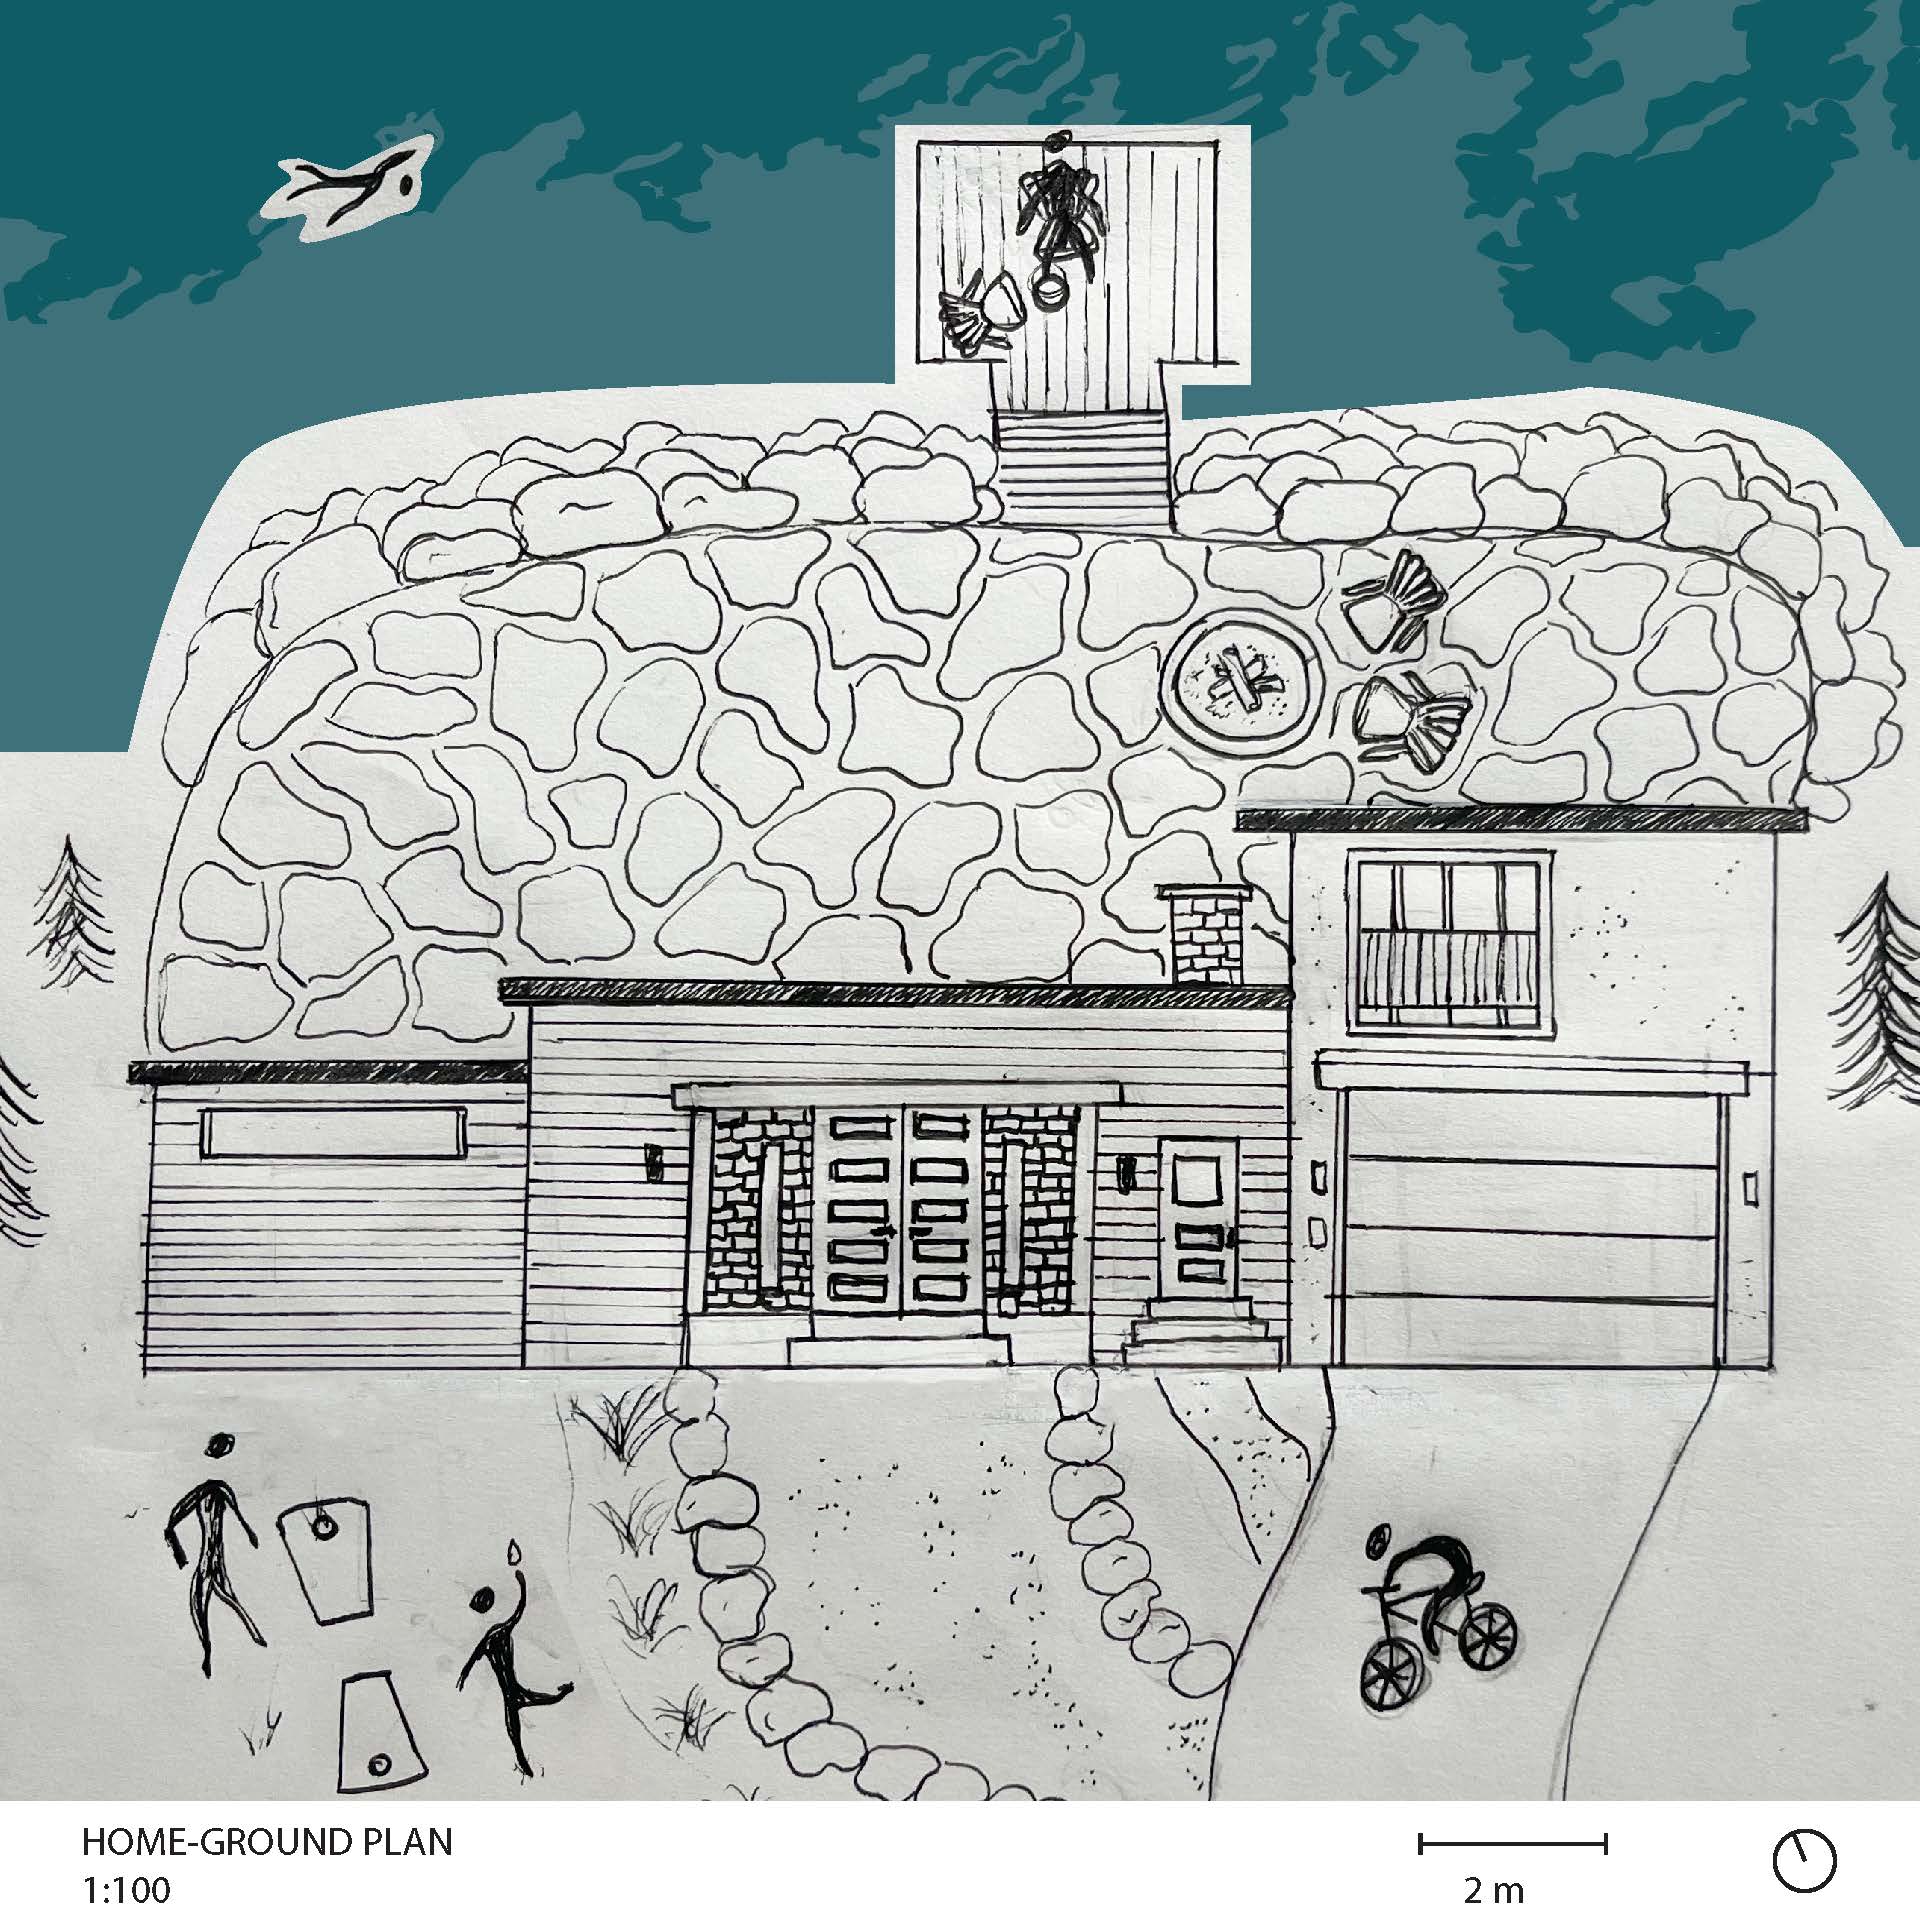
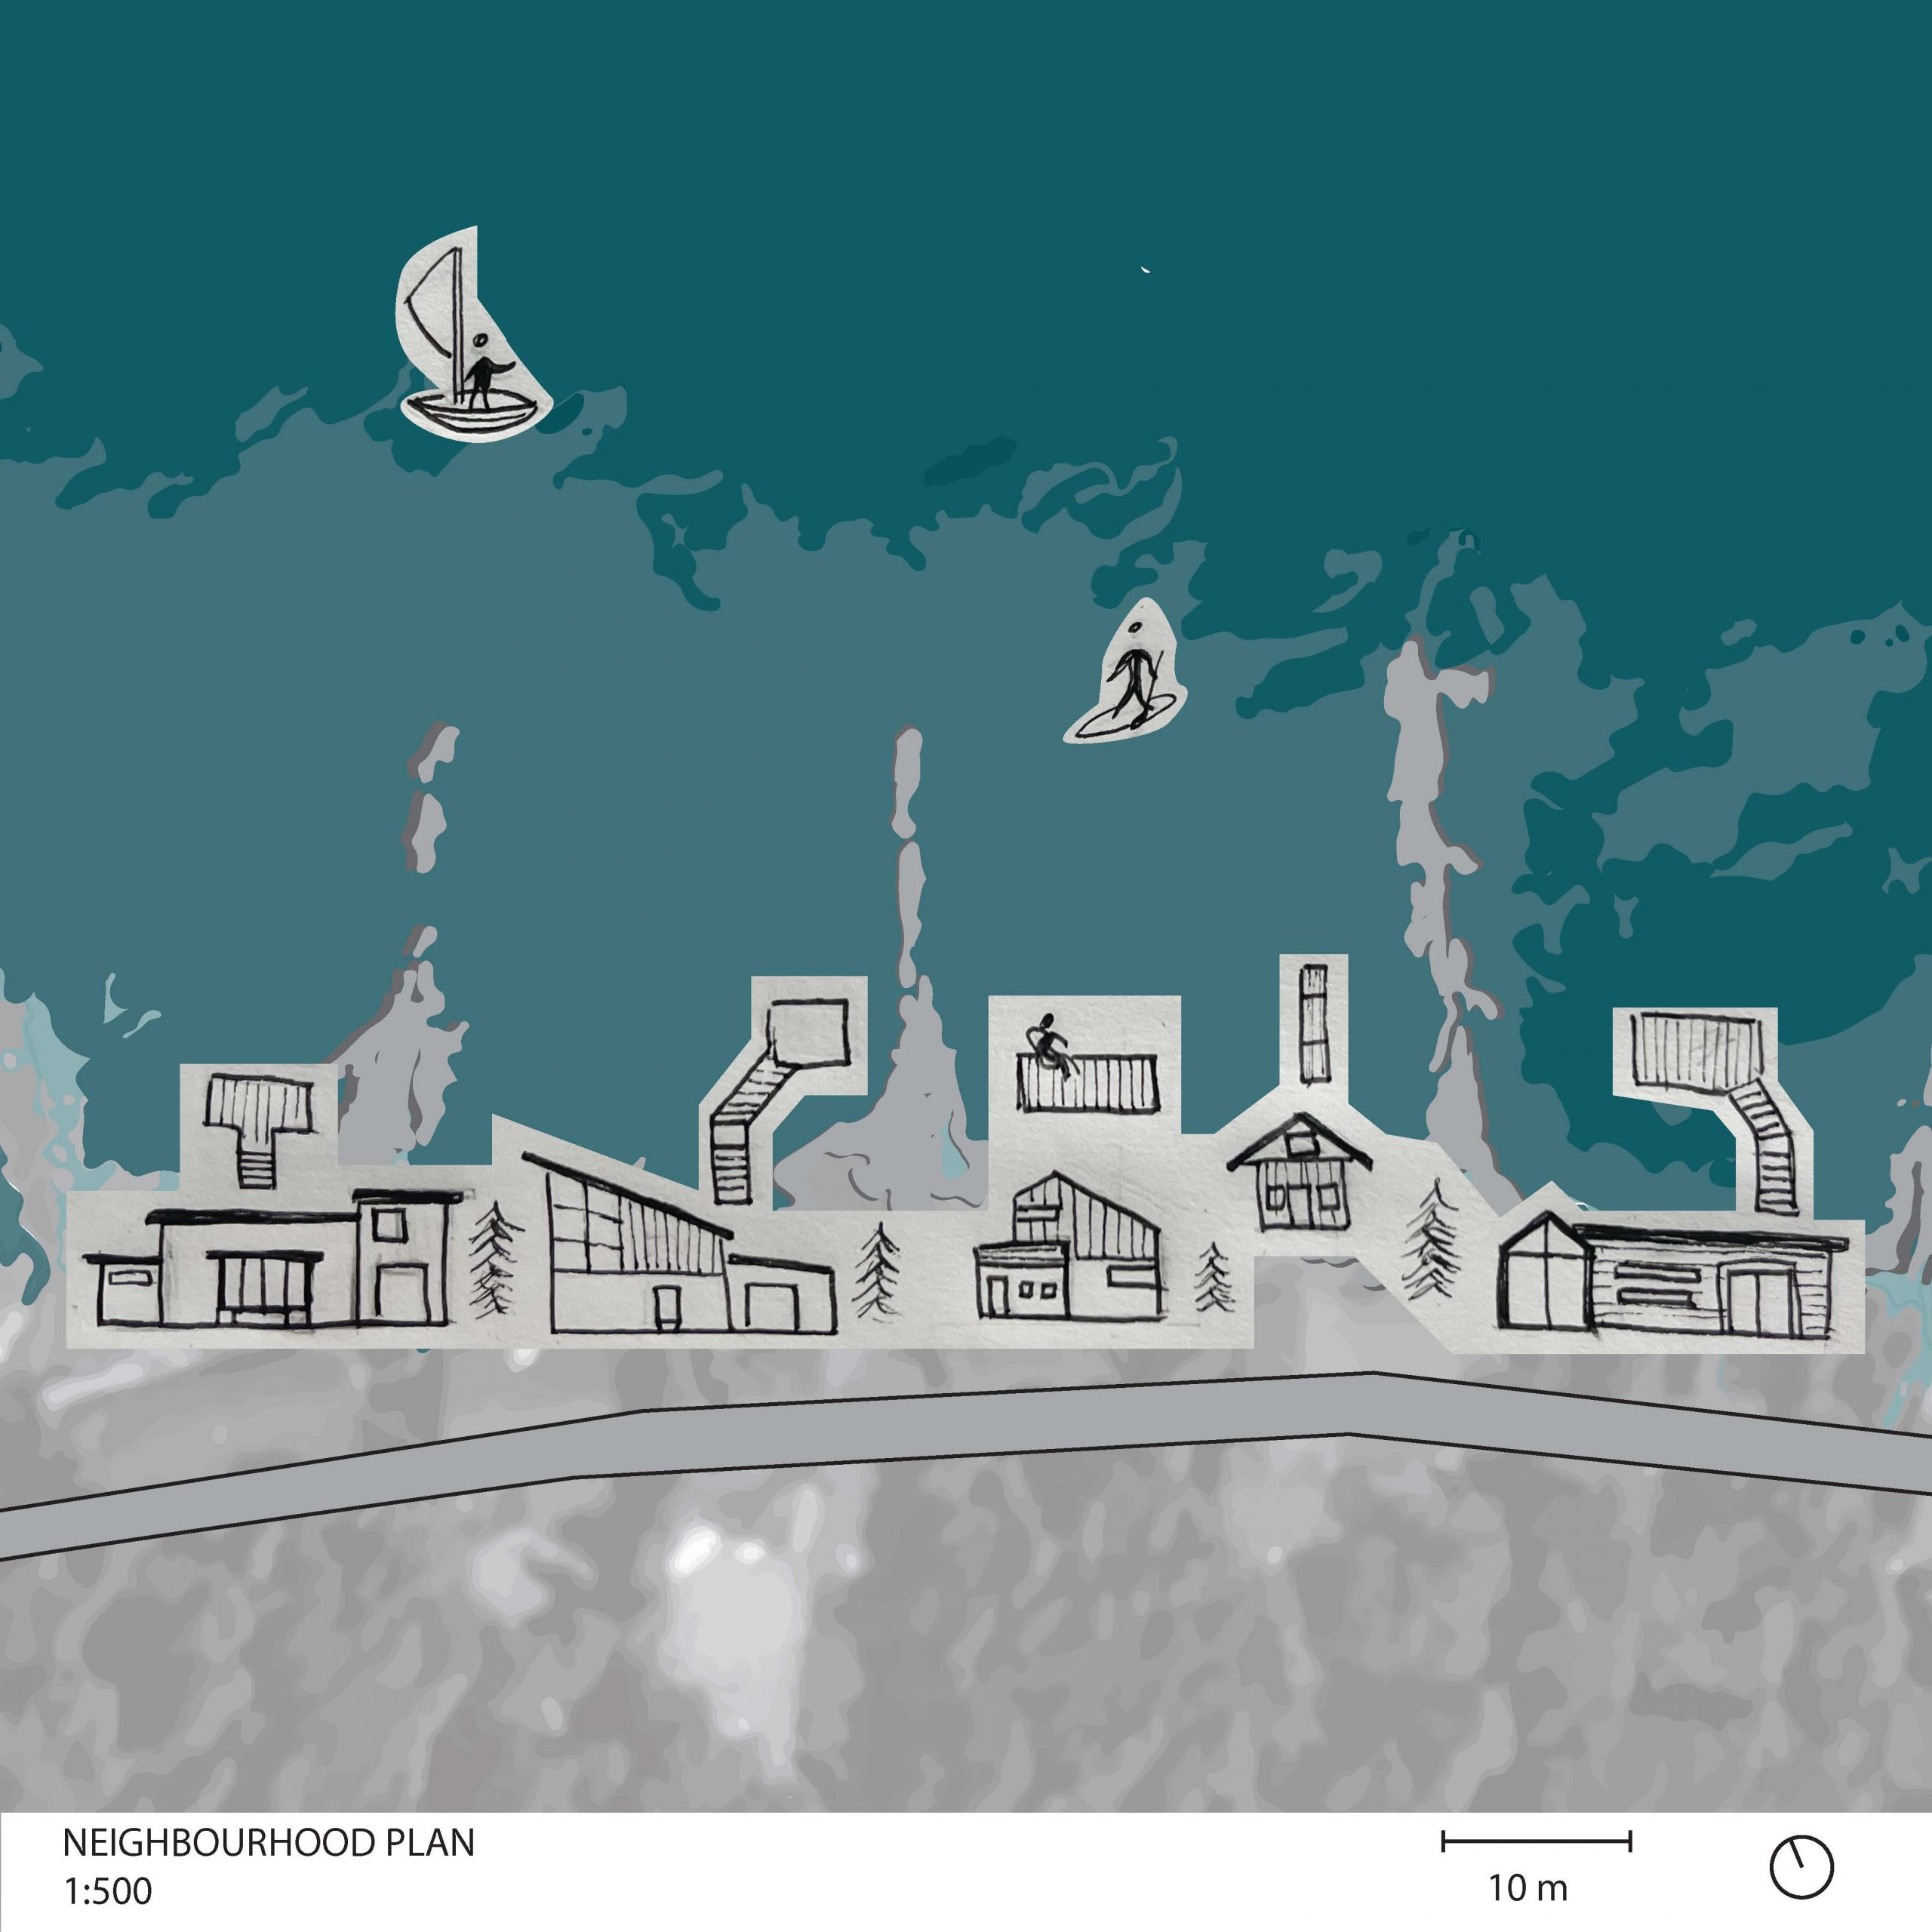
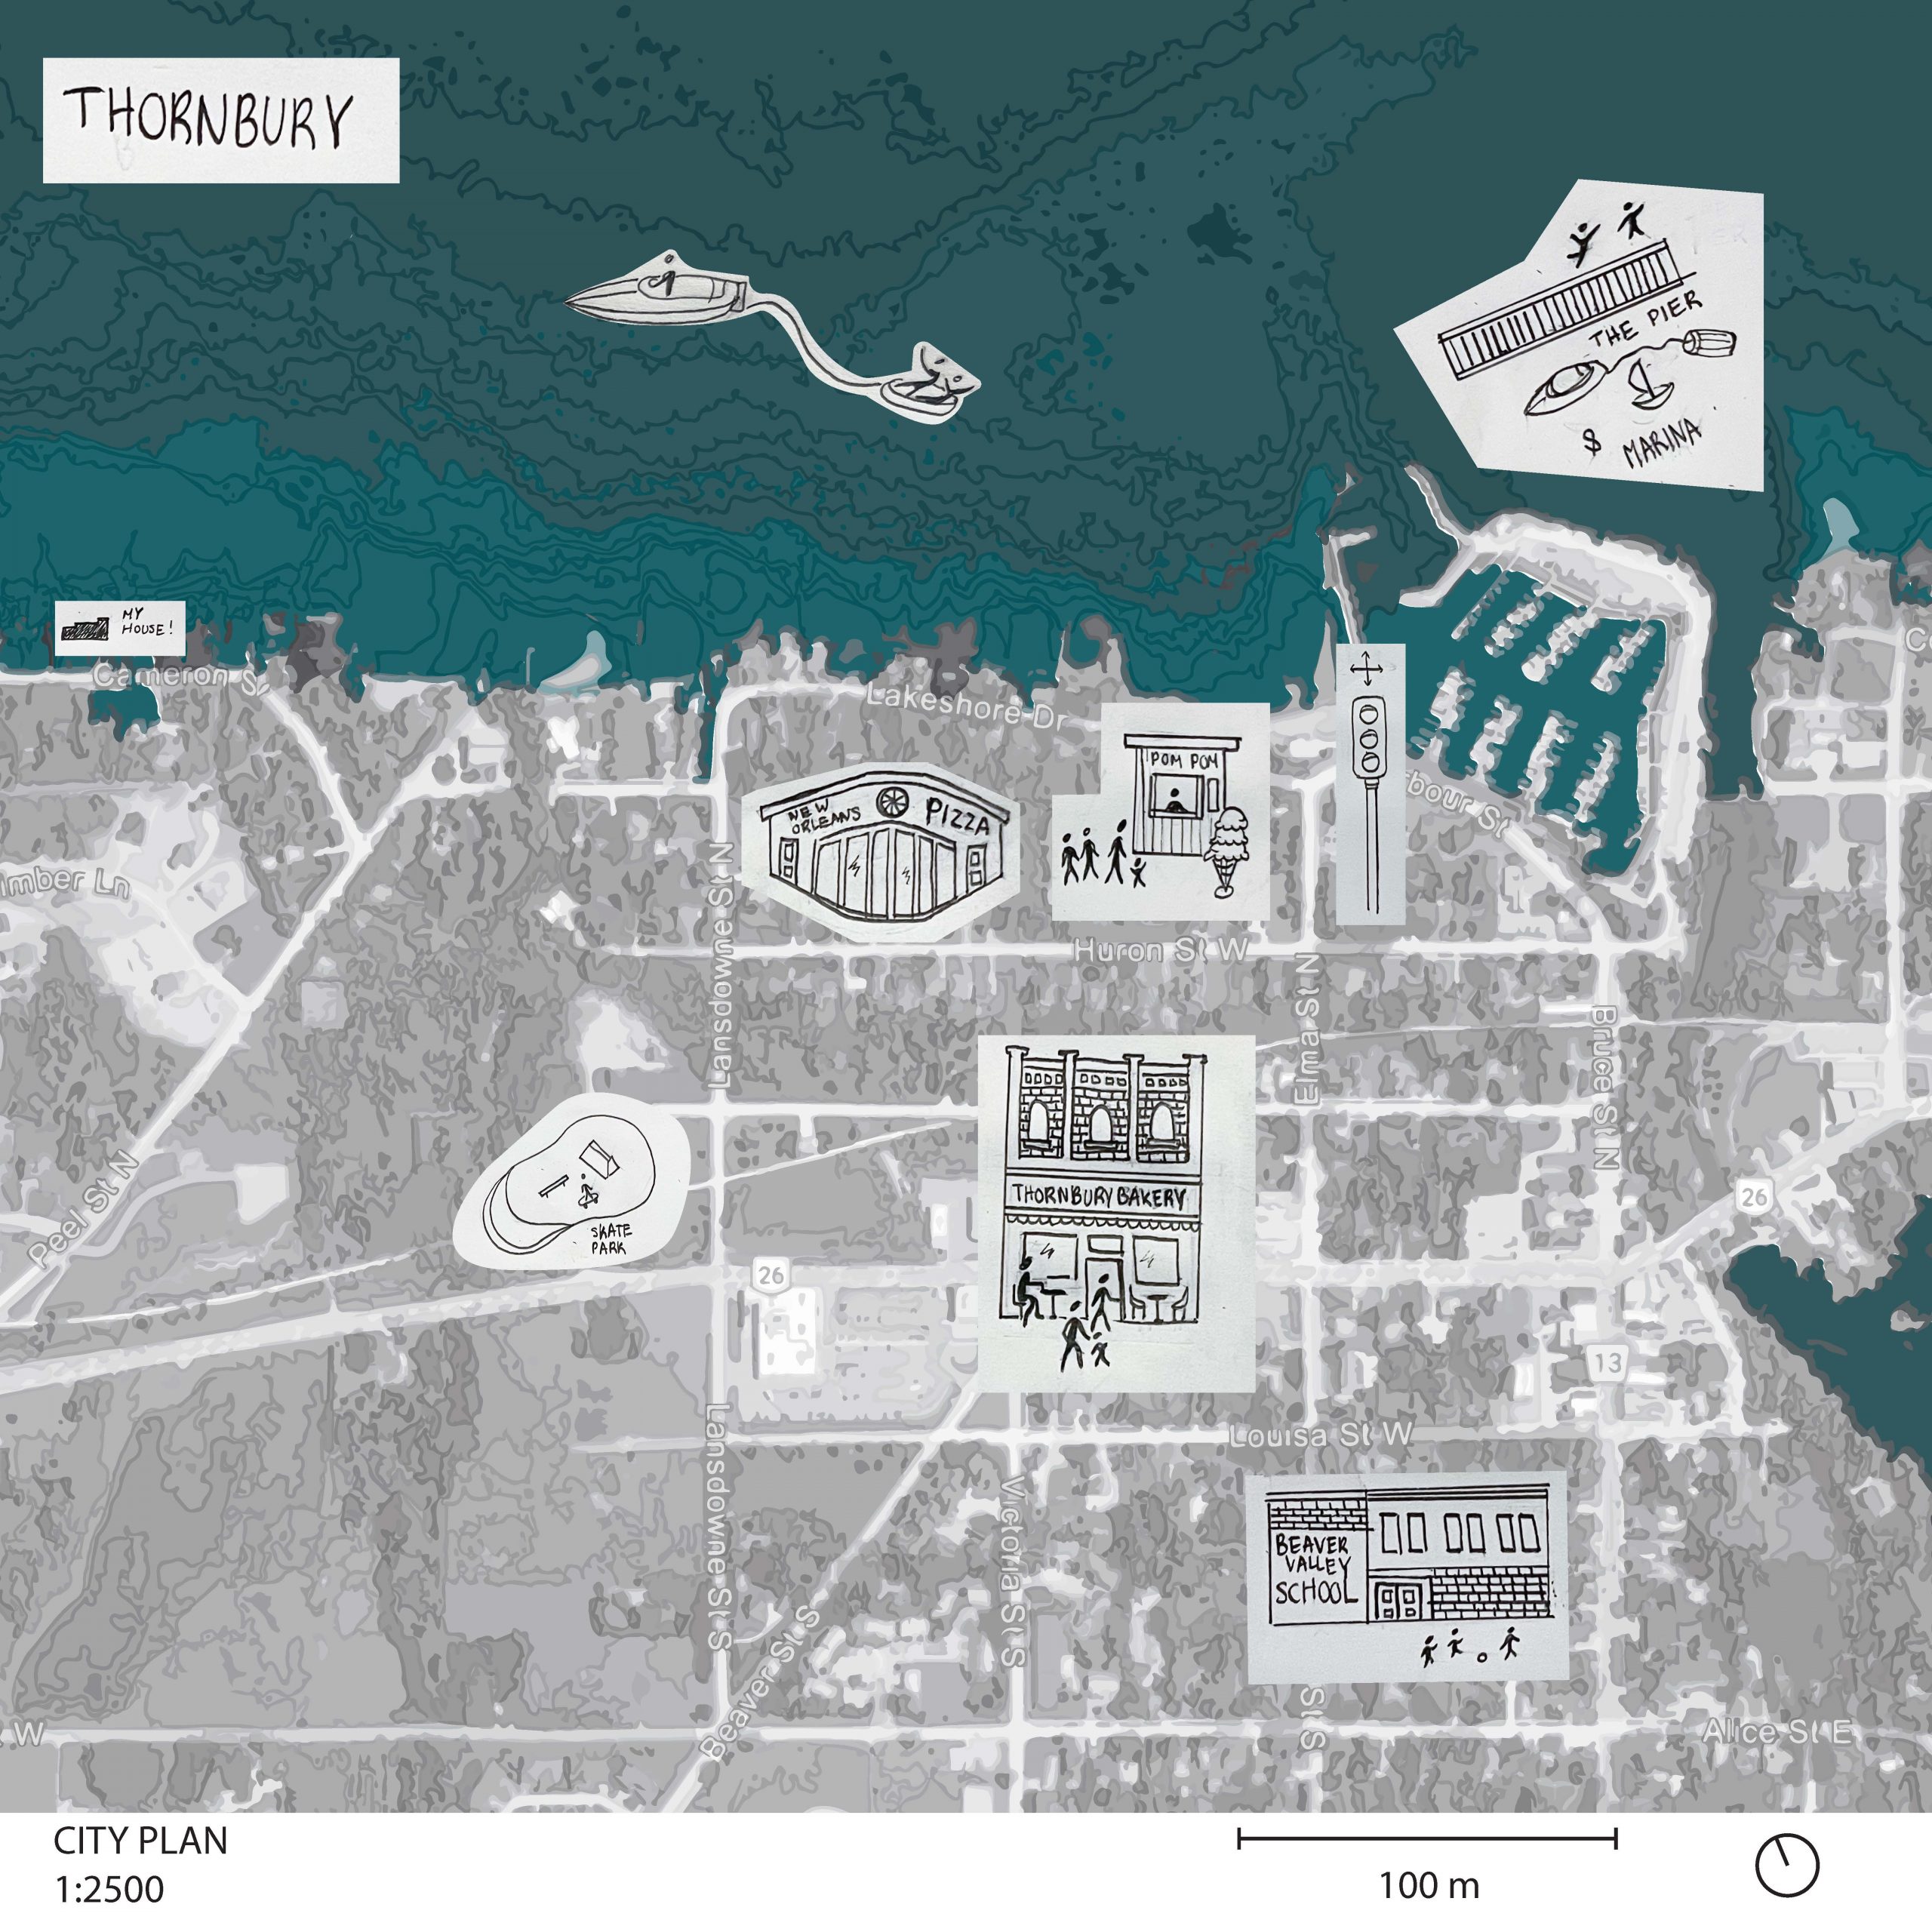
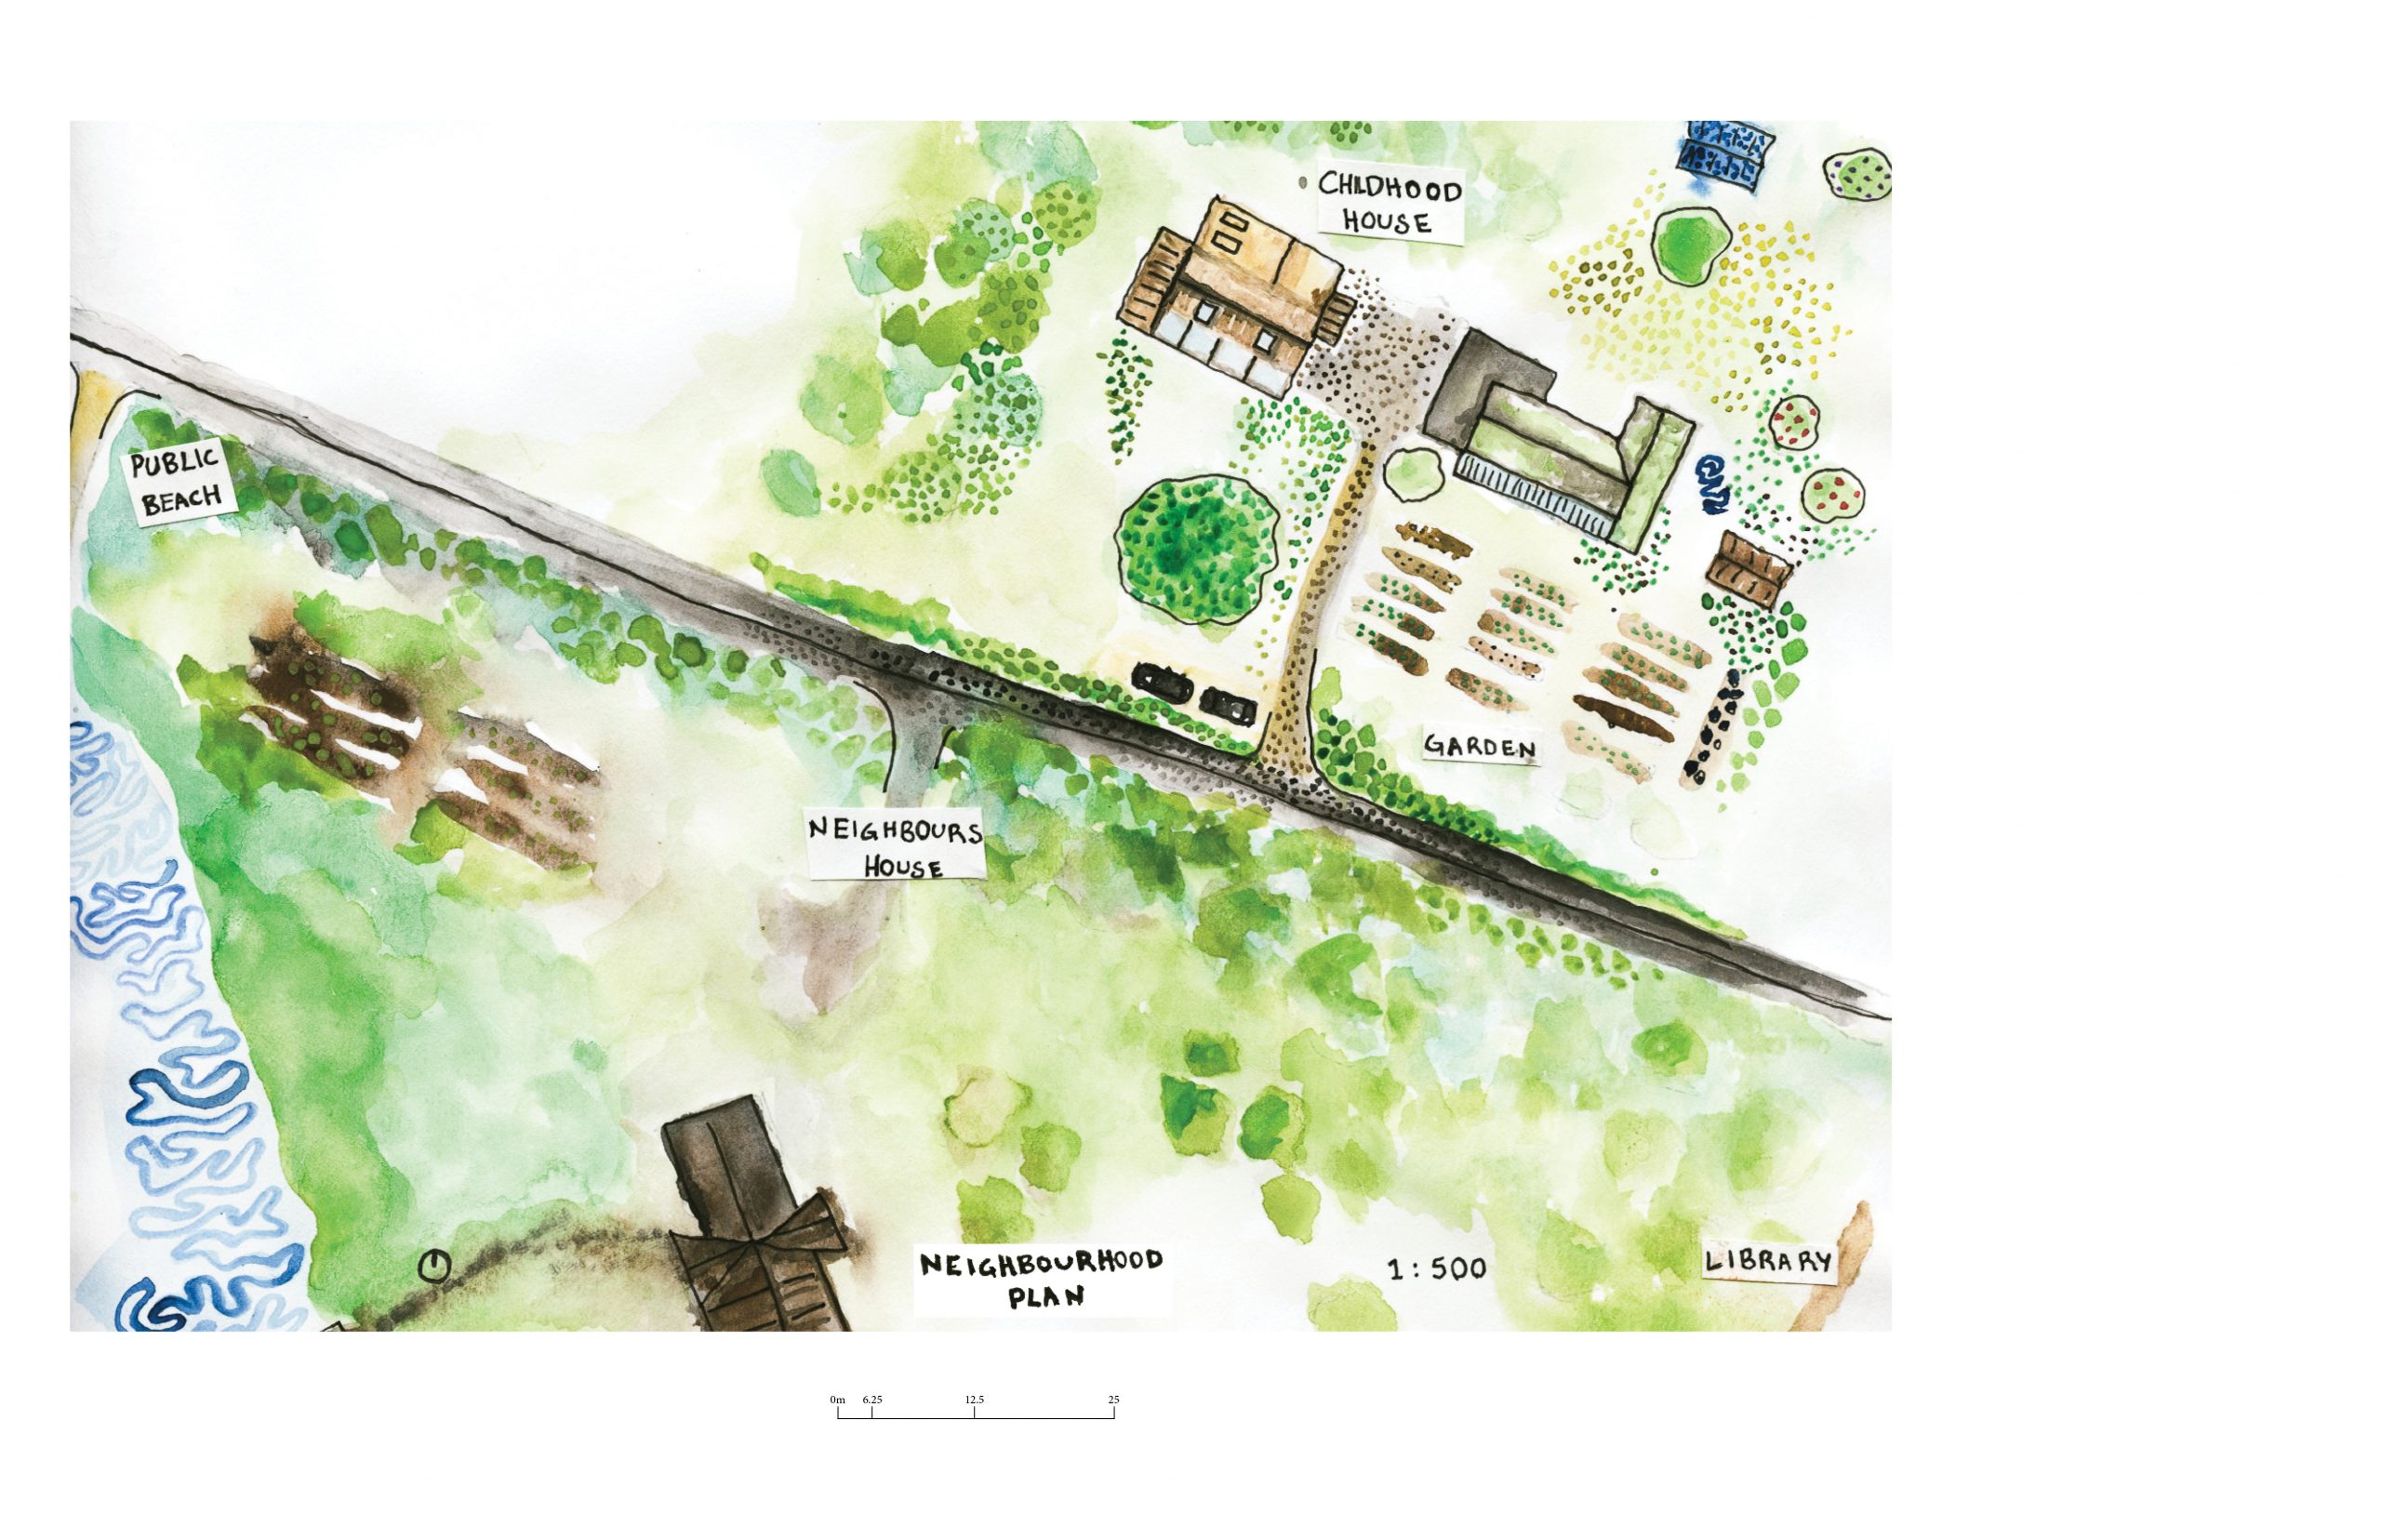
Thornbury is a small town nestled on the southern shores of Georgian Bay. It is an active town and you can always find people swimming, biking and running! There is always a line up for ice-cream or baked goods from the local bakery! The pier and marina is a hotspot with a constant flow of boats and people. I come from a large and very social family, we are very close with all our neighbours and there is always a rotating door of people coming over. The seaside, comforting nature of the town and the vibrancy of the people that live here are a large part of why I consider Thornbury my home-ground.
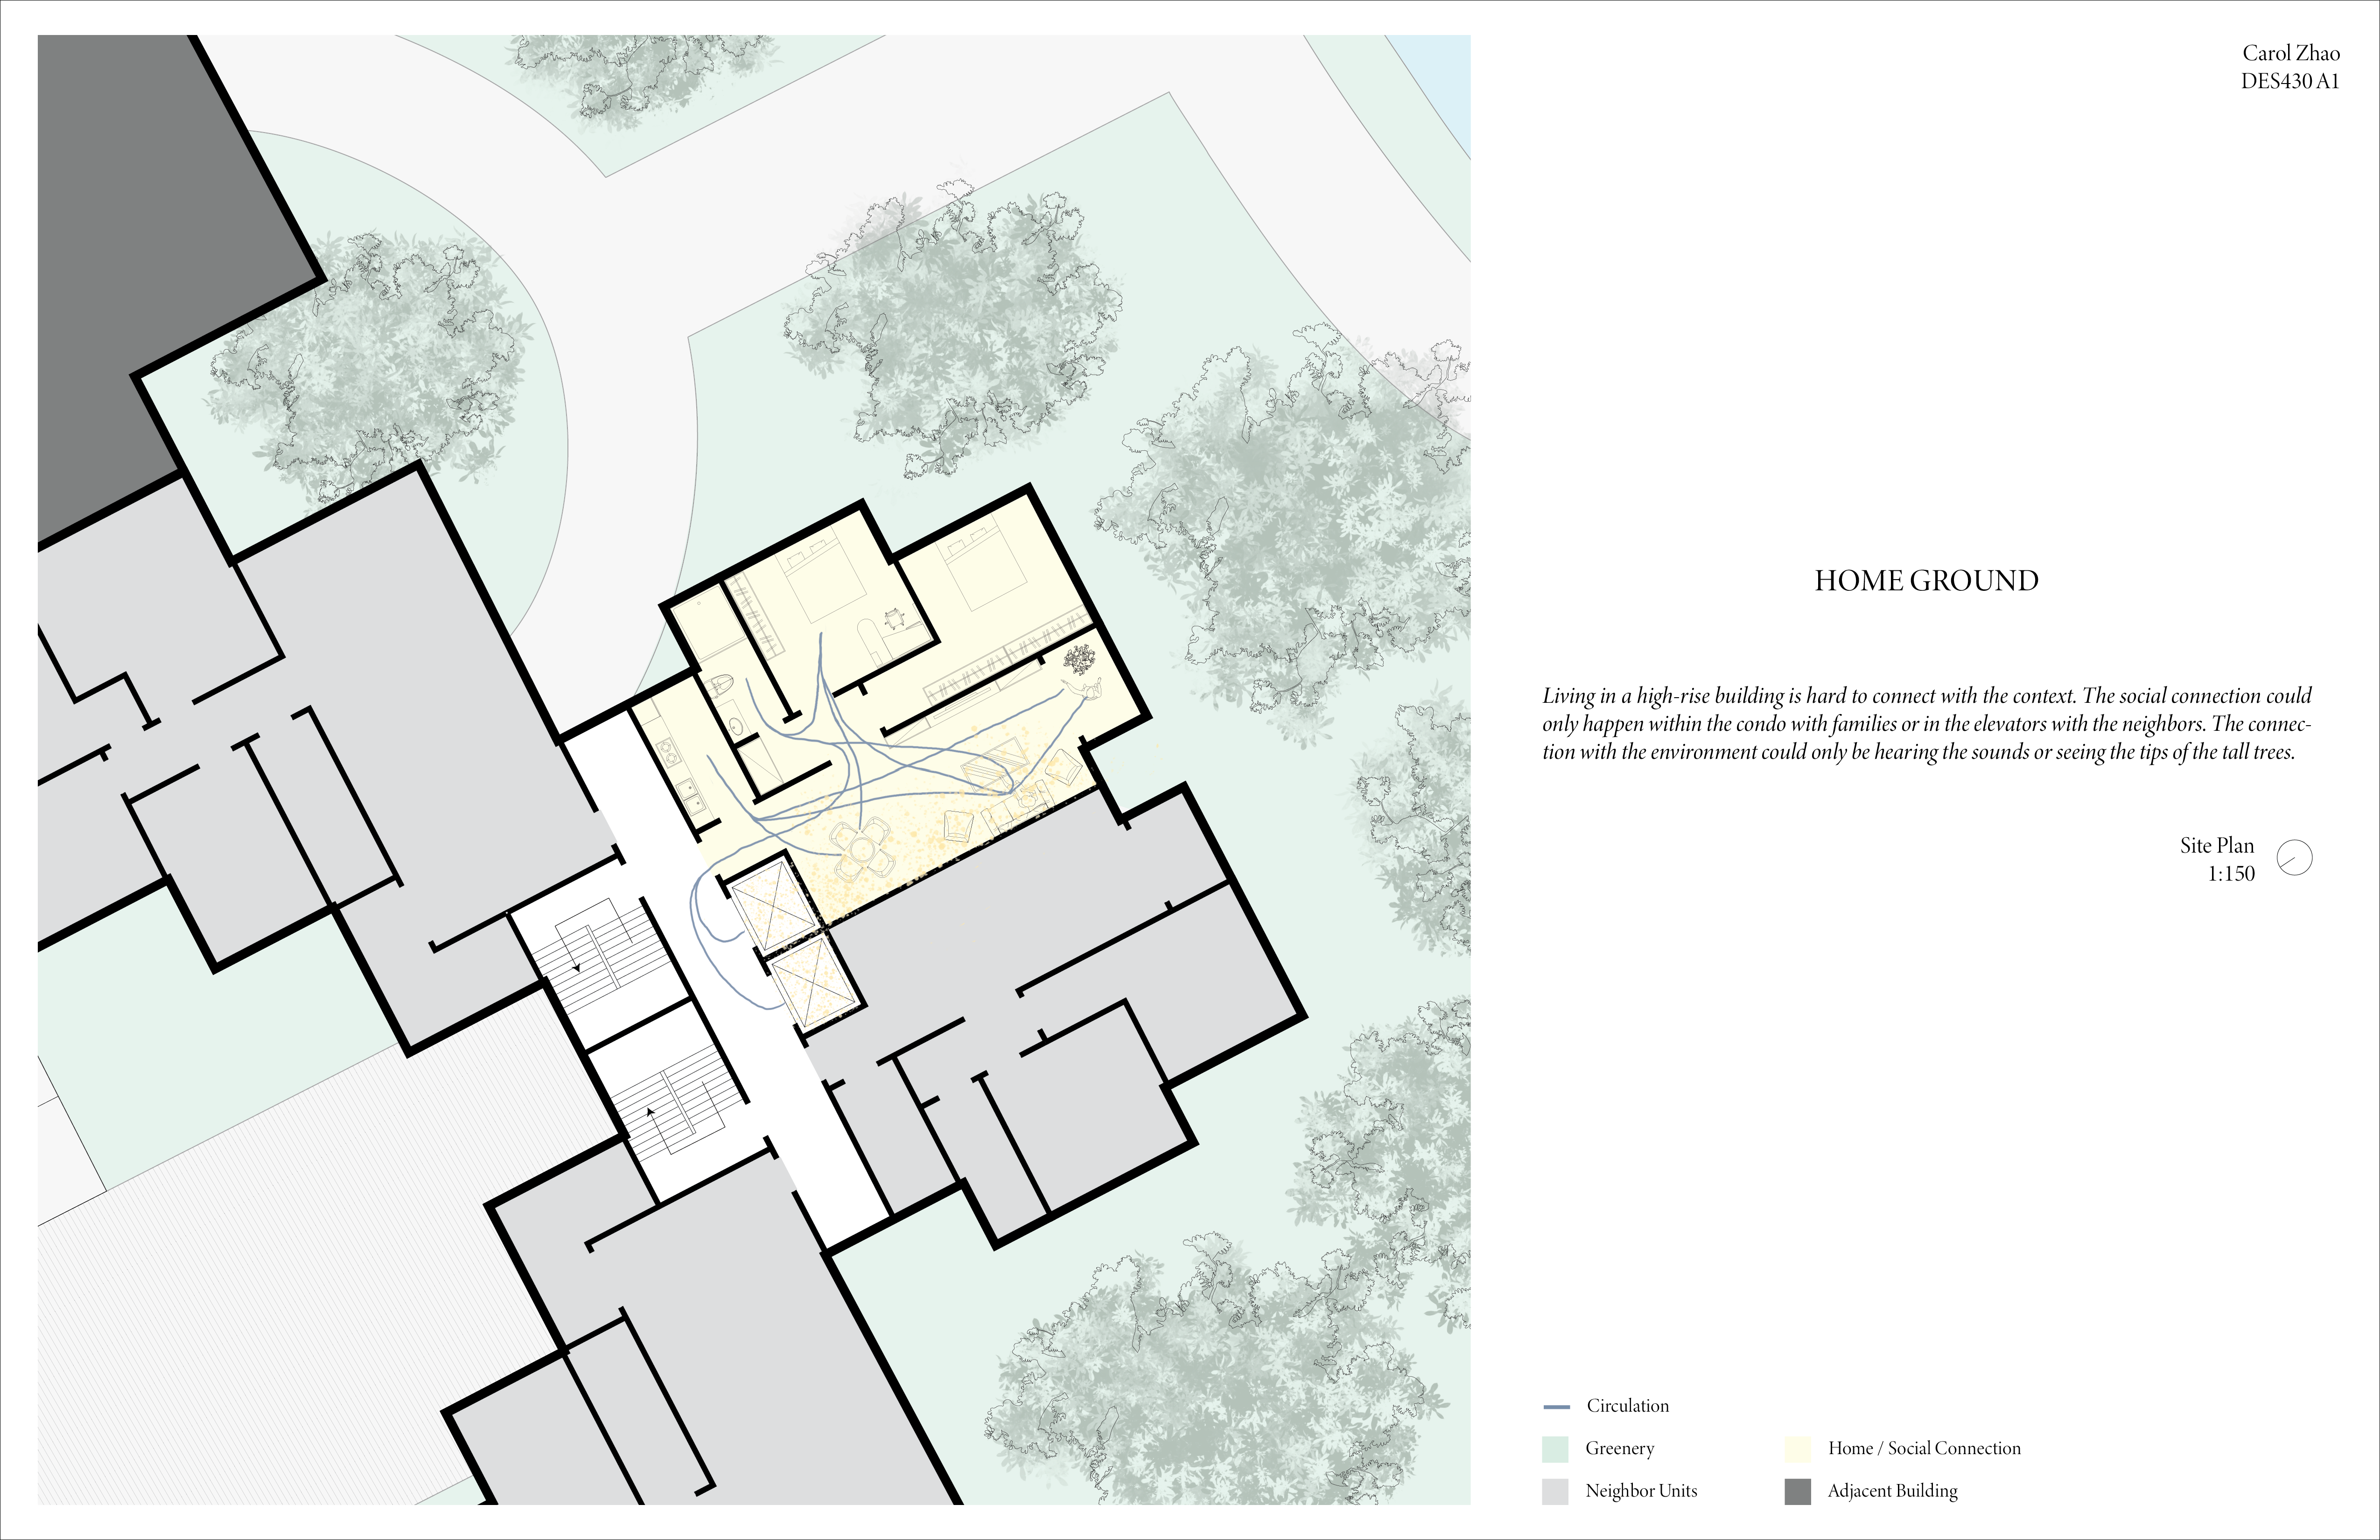
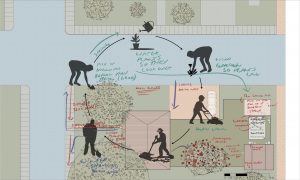 The Chore list – an interactive space of home
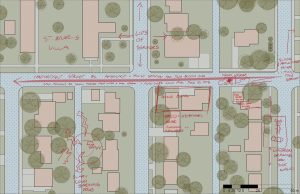
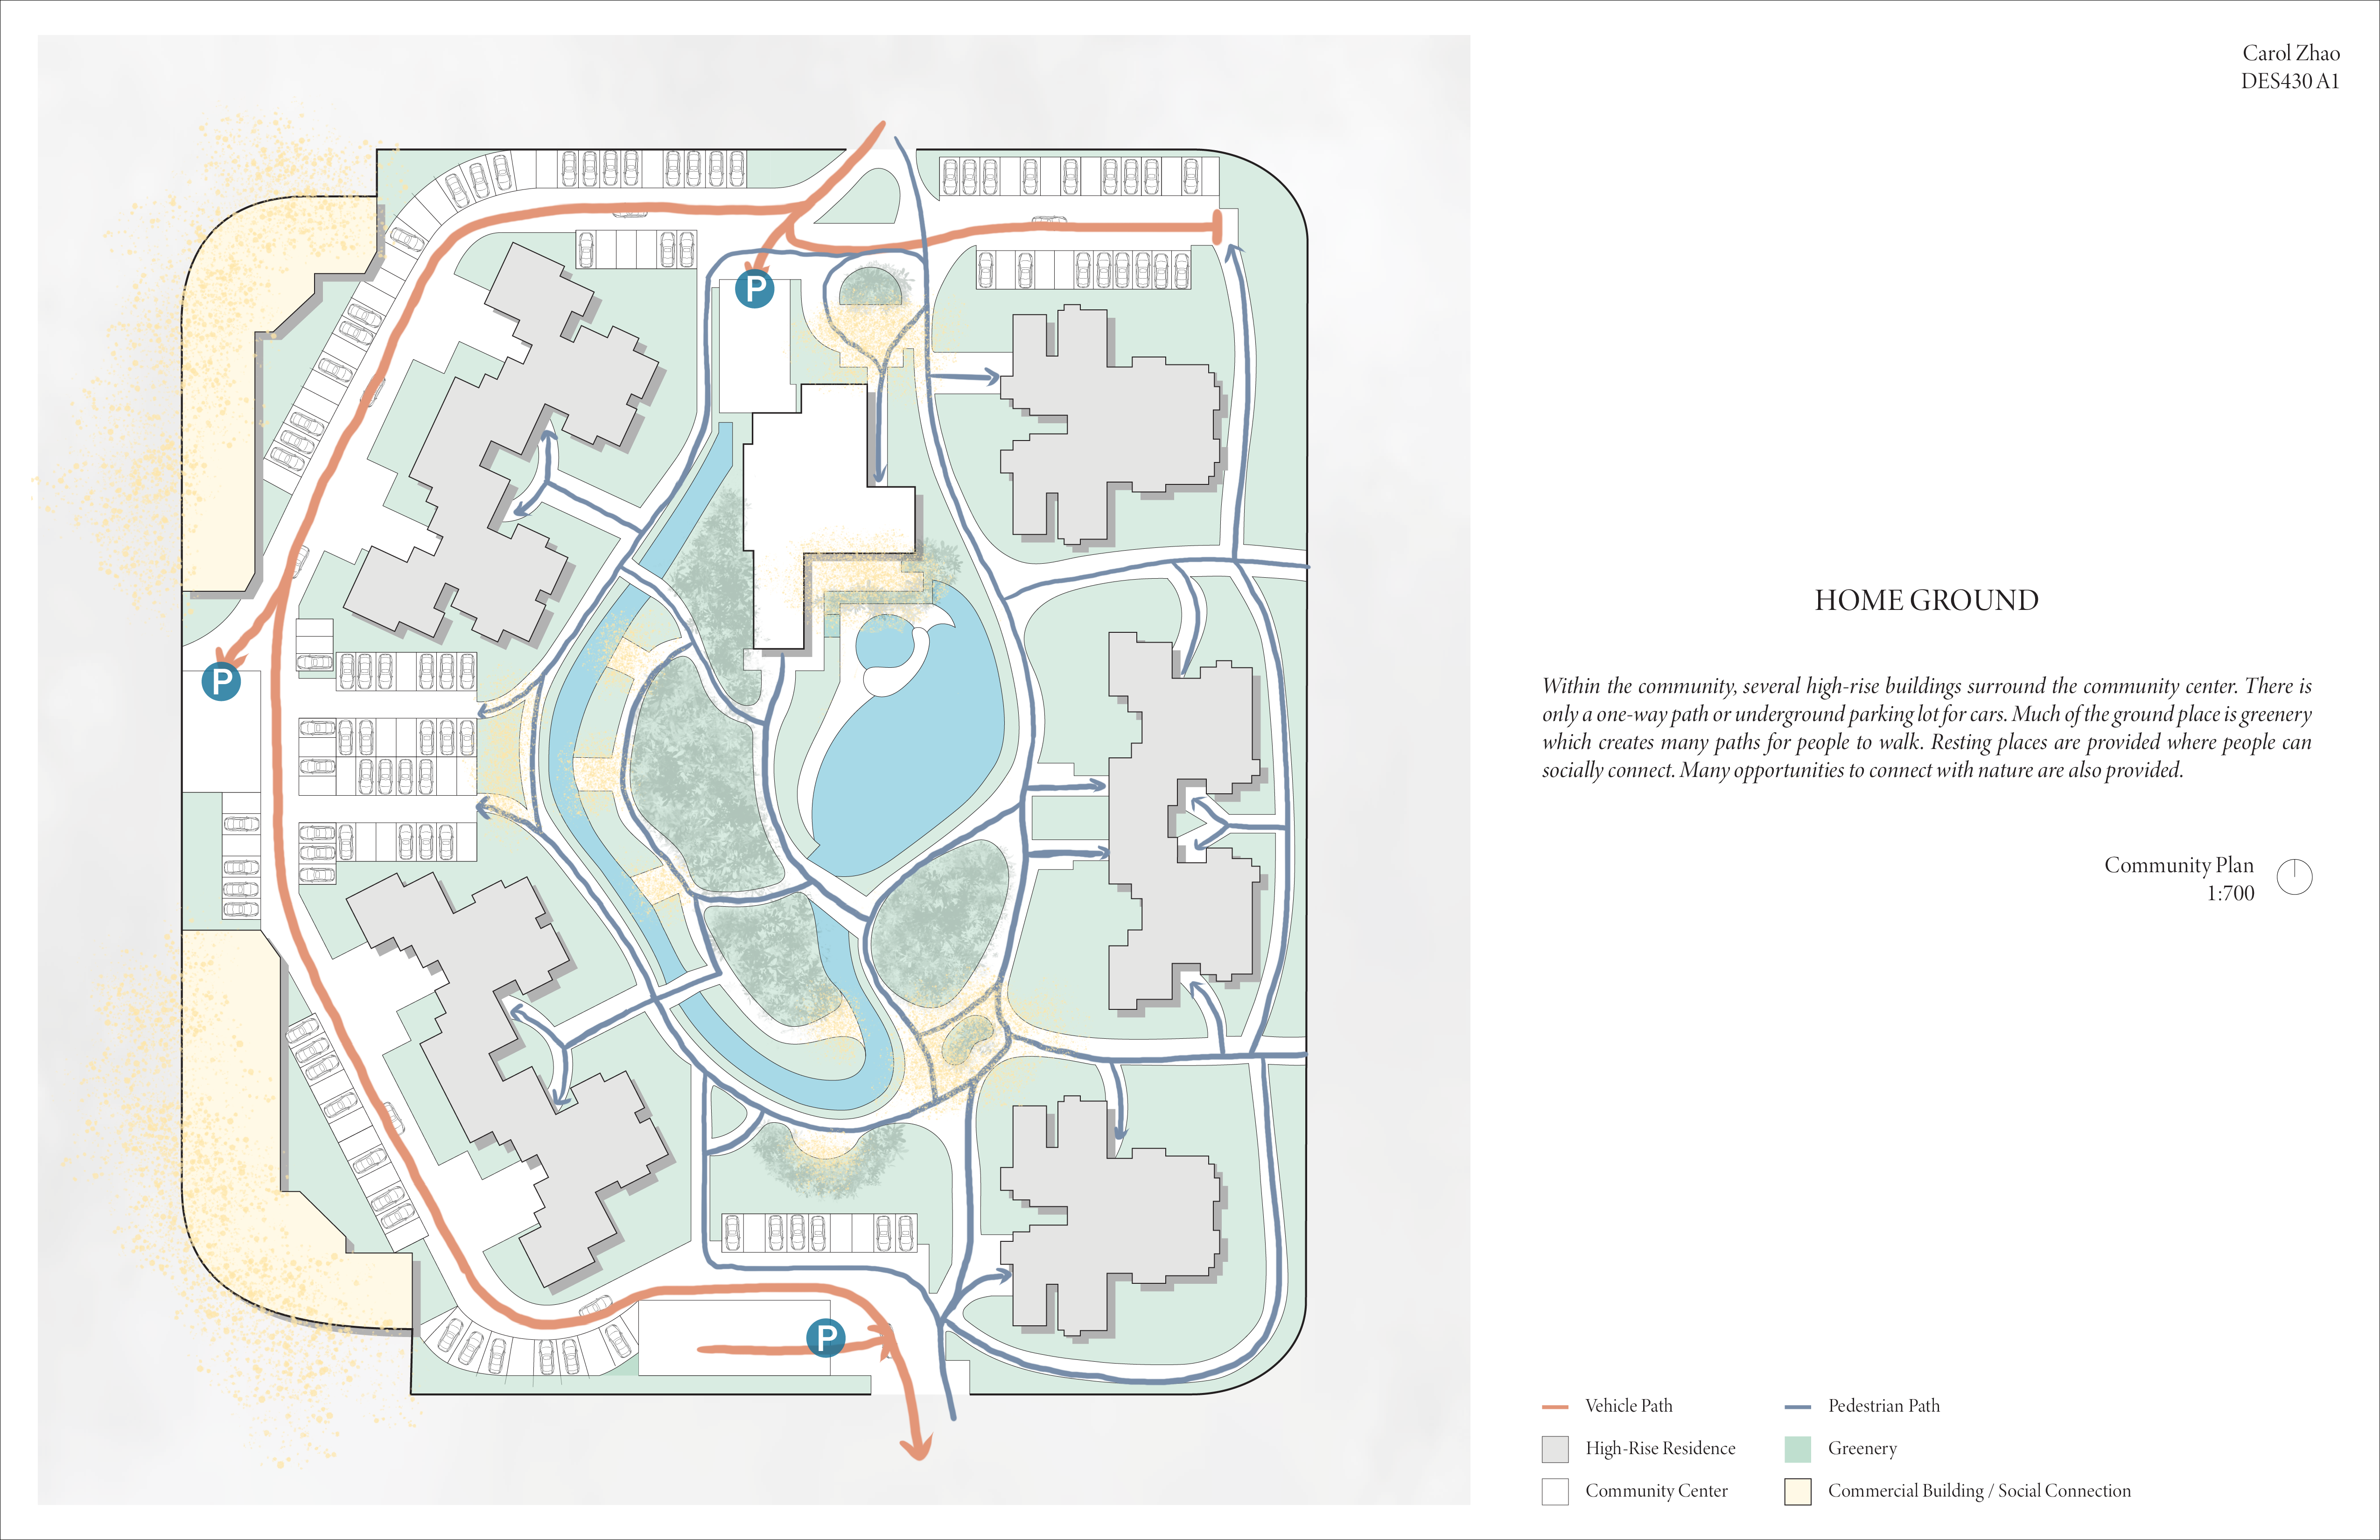
Community Block – common events that occurred within the block
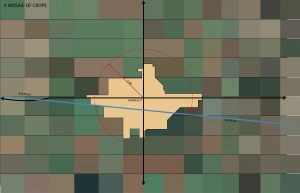
A Mosaic of Crops – surrounding acres of farmlands

Yongkang Street, nestled within the vibrant tapestry of Taipei’s urban landscape, serves as both the geographical and emotional anchor of my connection to Taiwan.
As I traverse the streets, my journey unfolds along a route that intertwines with my cherished memories. This path weaves through the heart of Yongkang Street, a thoroughfare that has become an indelible part of my life’s narrative.
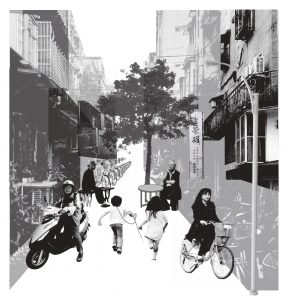
The collage I’ve composed serves as a harmonious assemblage, fusing together cherished moments into a singular vignette. Within this visual composition, each element coalesces to encapsulate the essence of my most treasured memories,


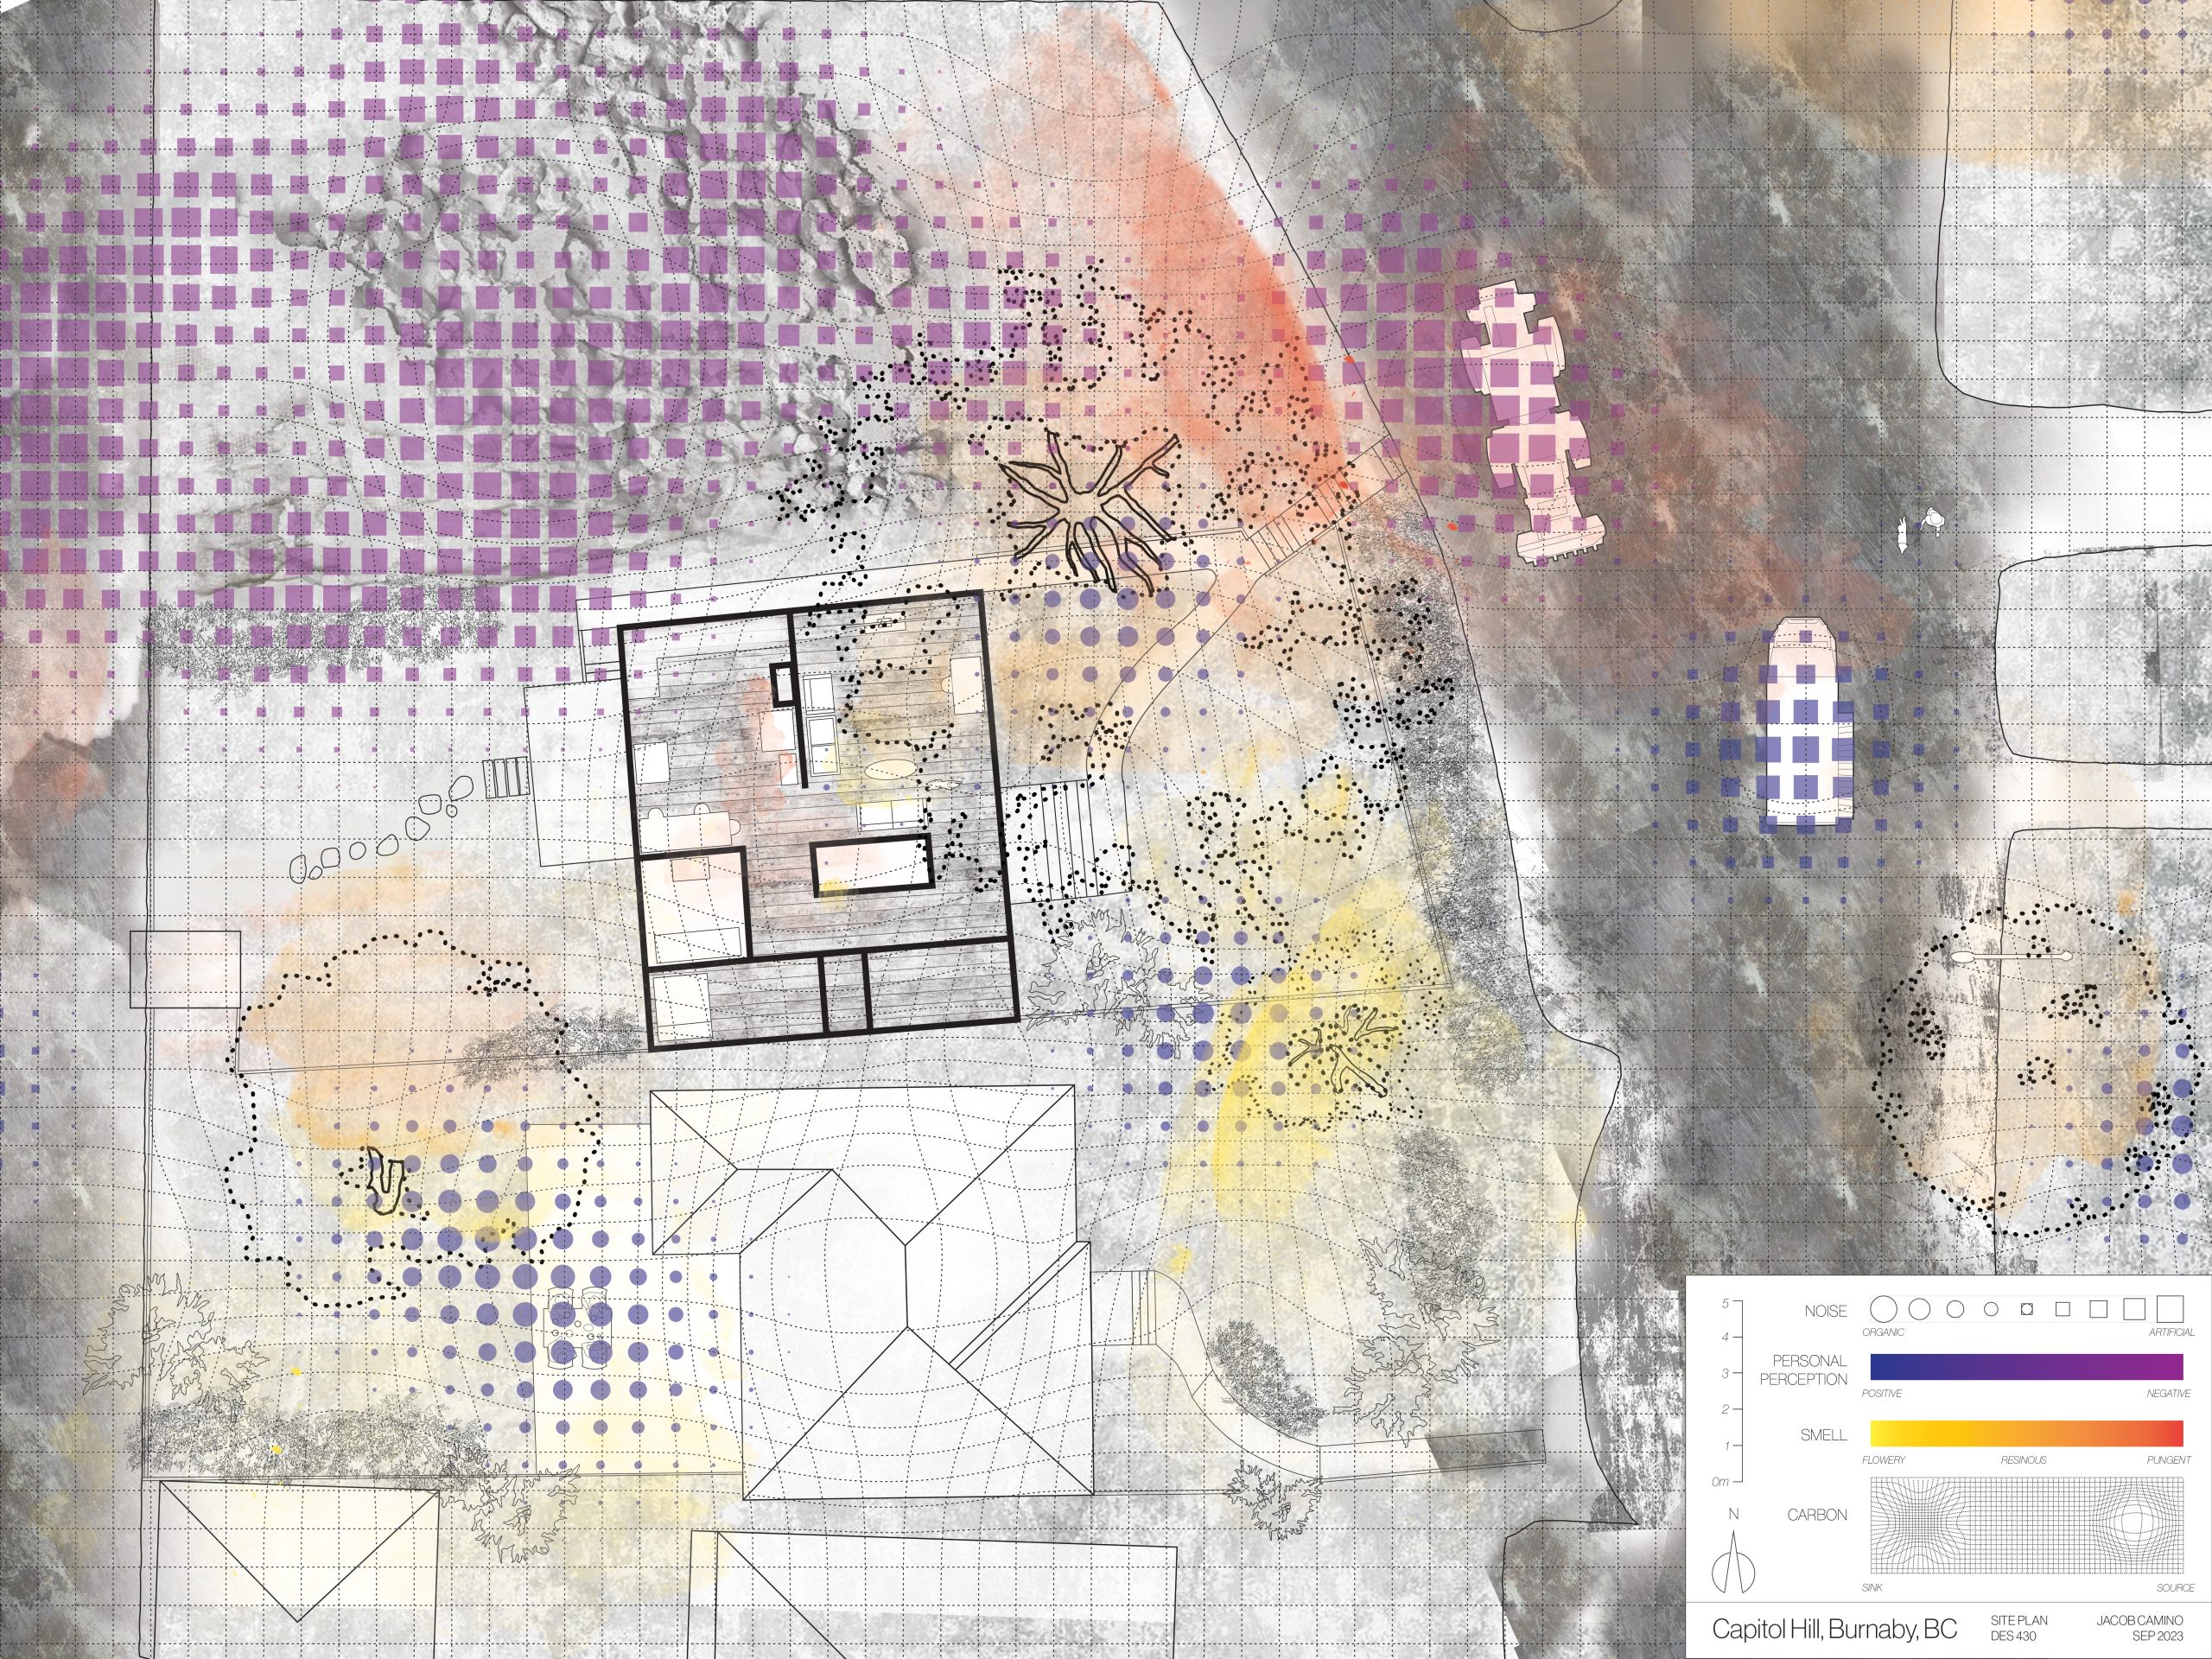
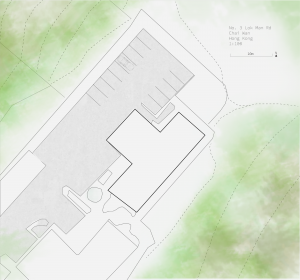
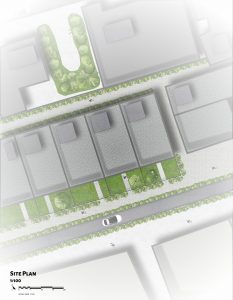
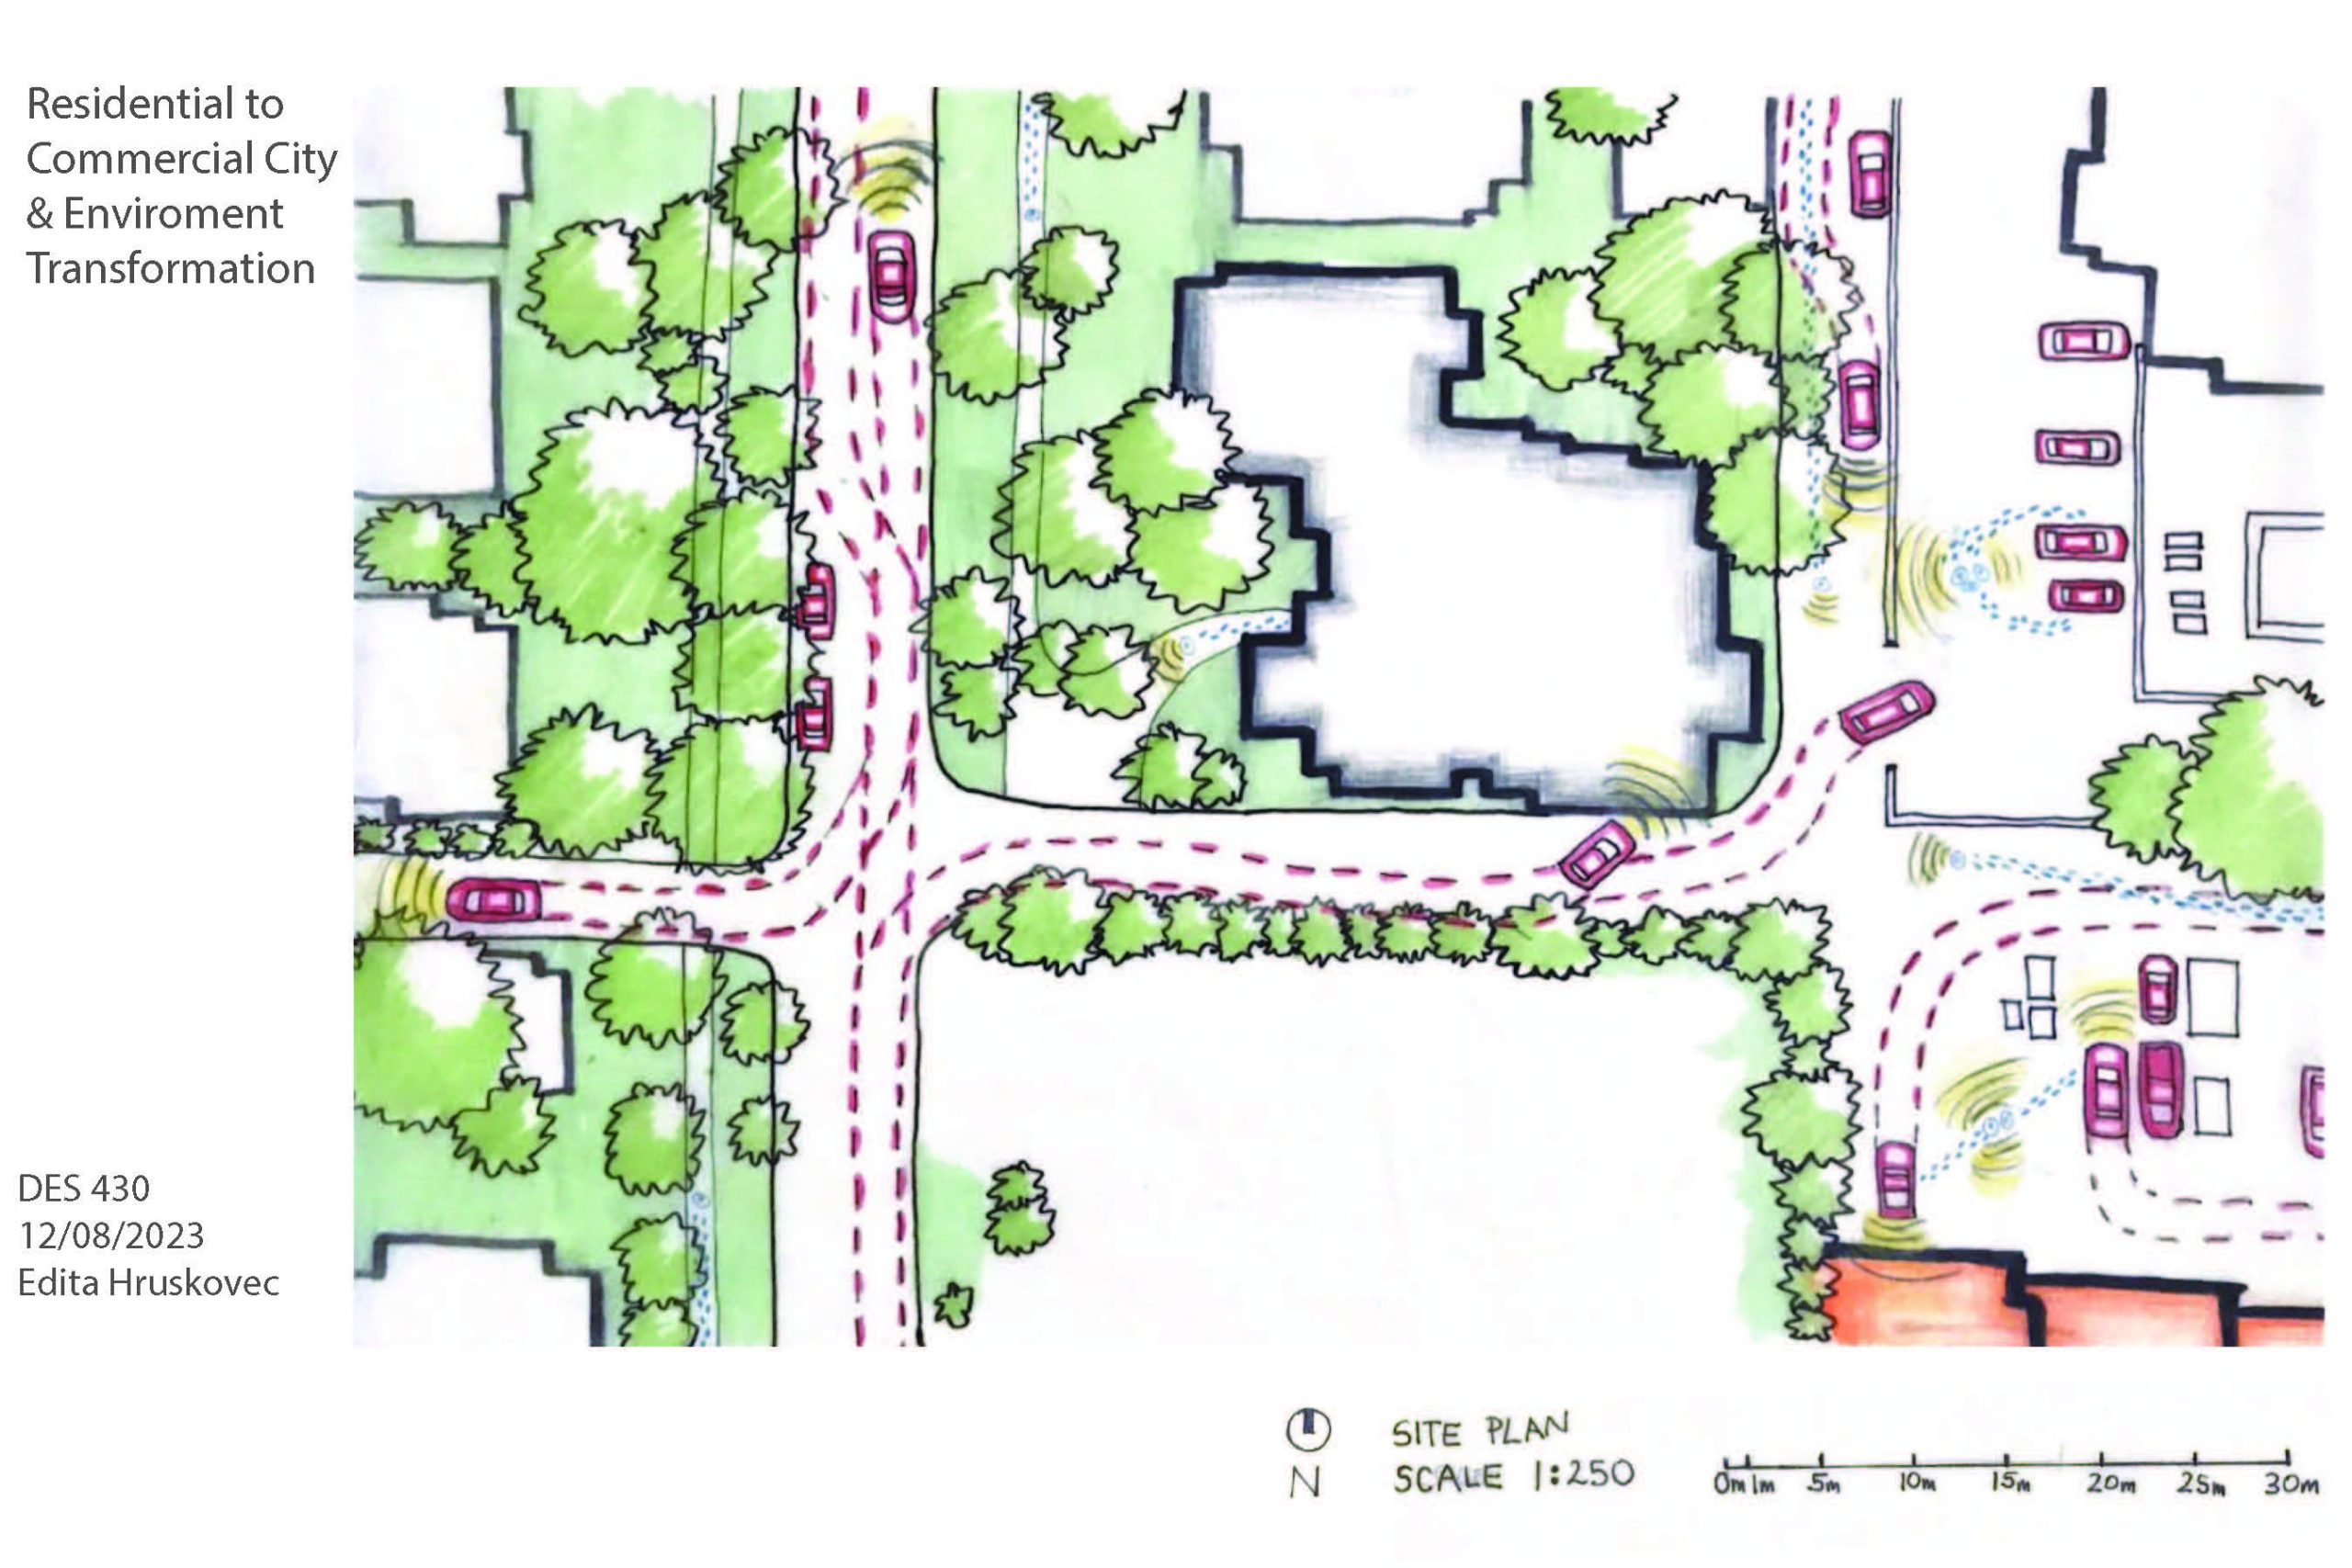
The senses represented in this scale are the sources of noise, the surrounding aroma, the roughness experienced by the pedestrian. Mapping these senses with carbon sources and sinks presents a correlation with personal perception.
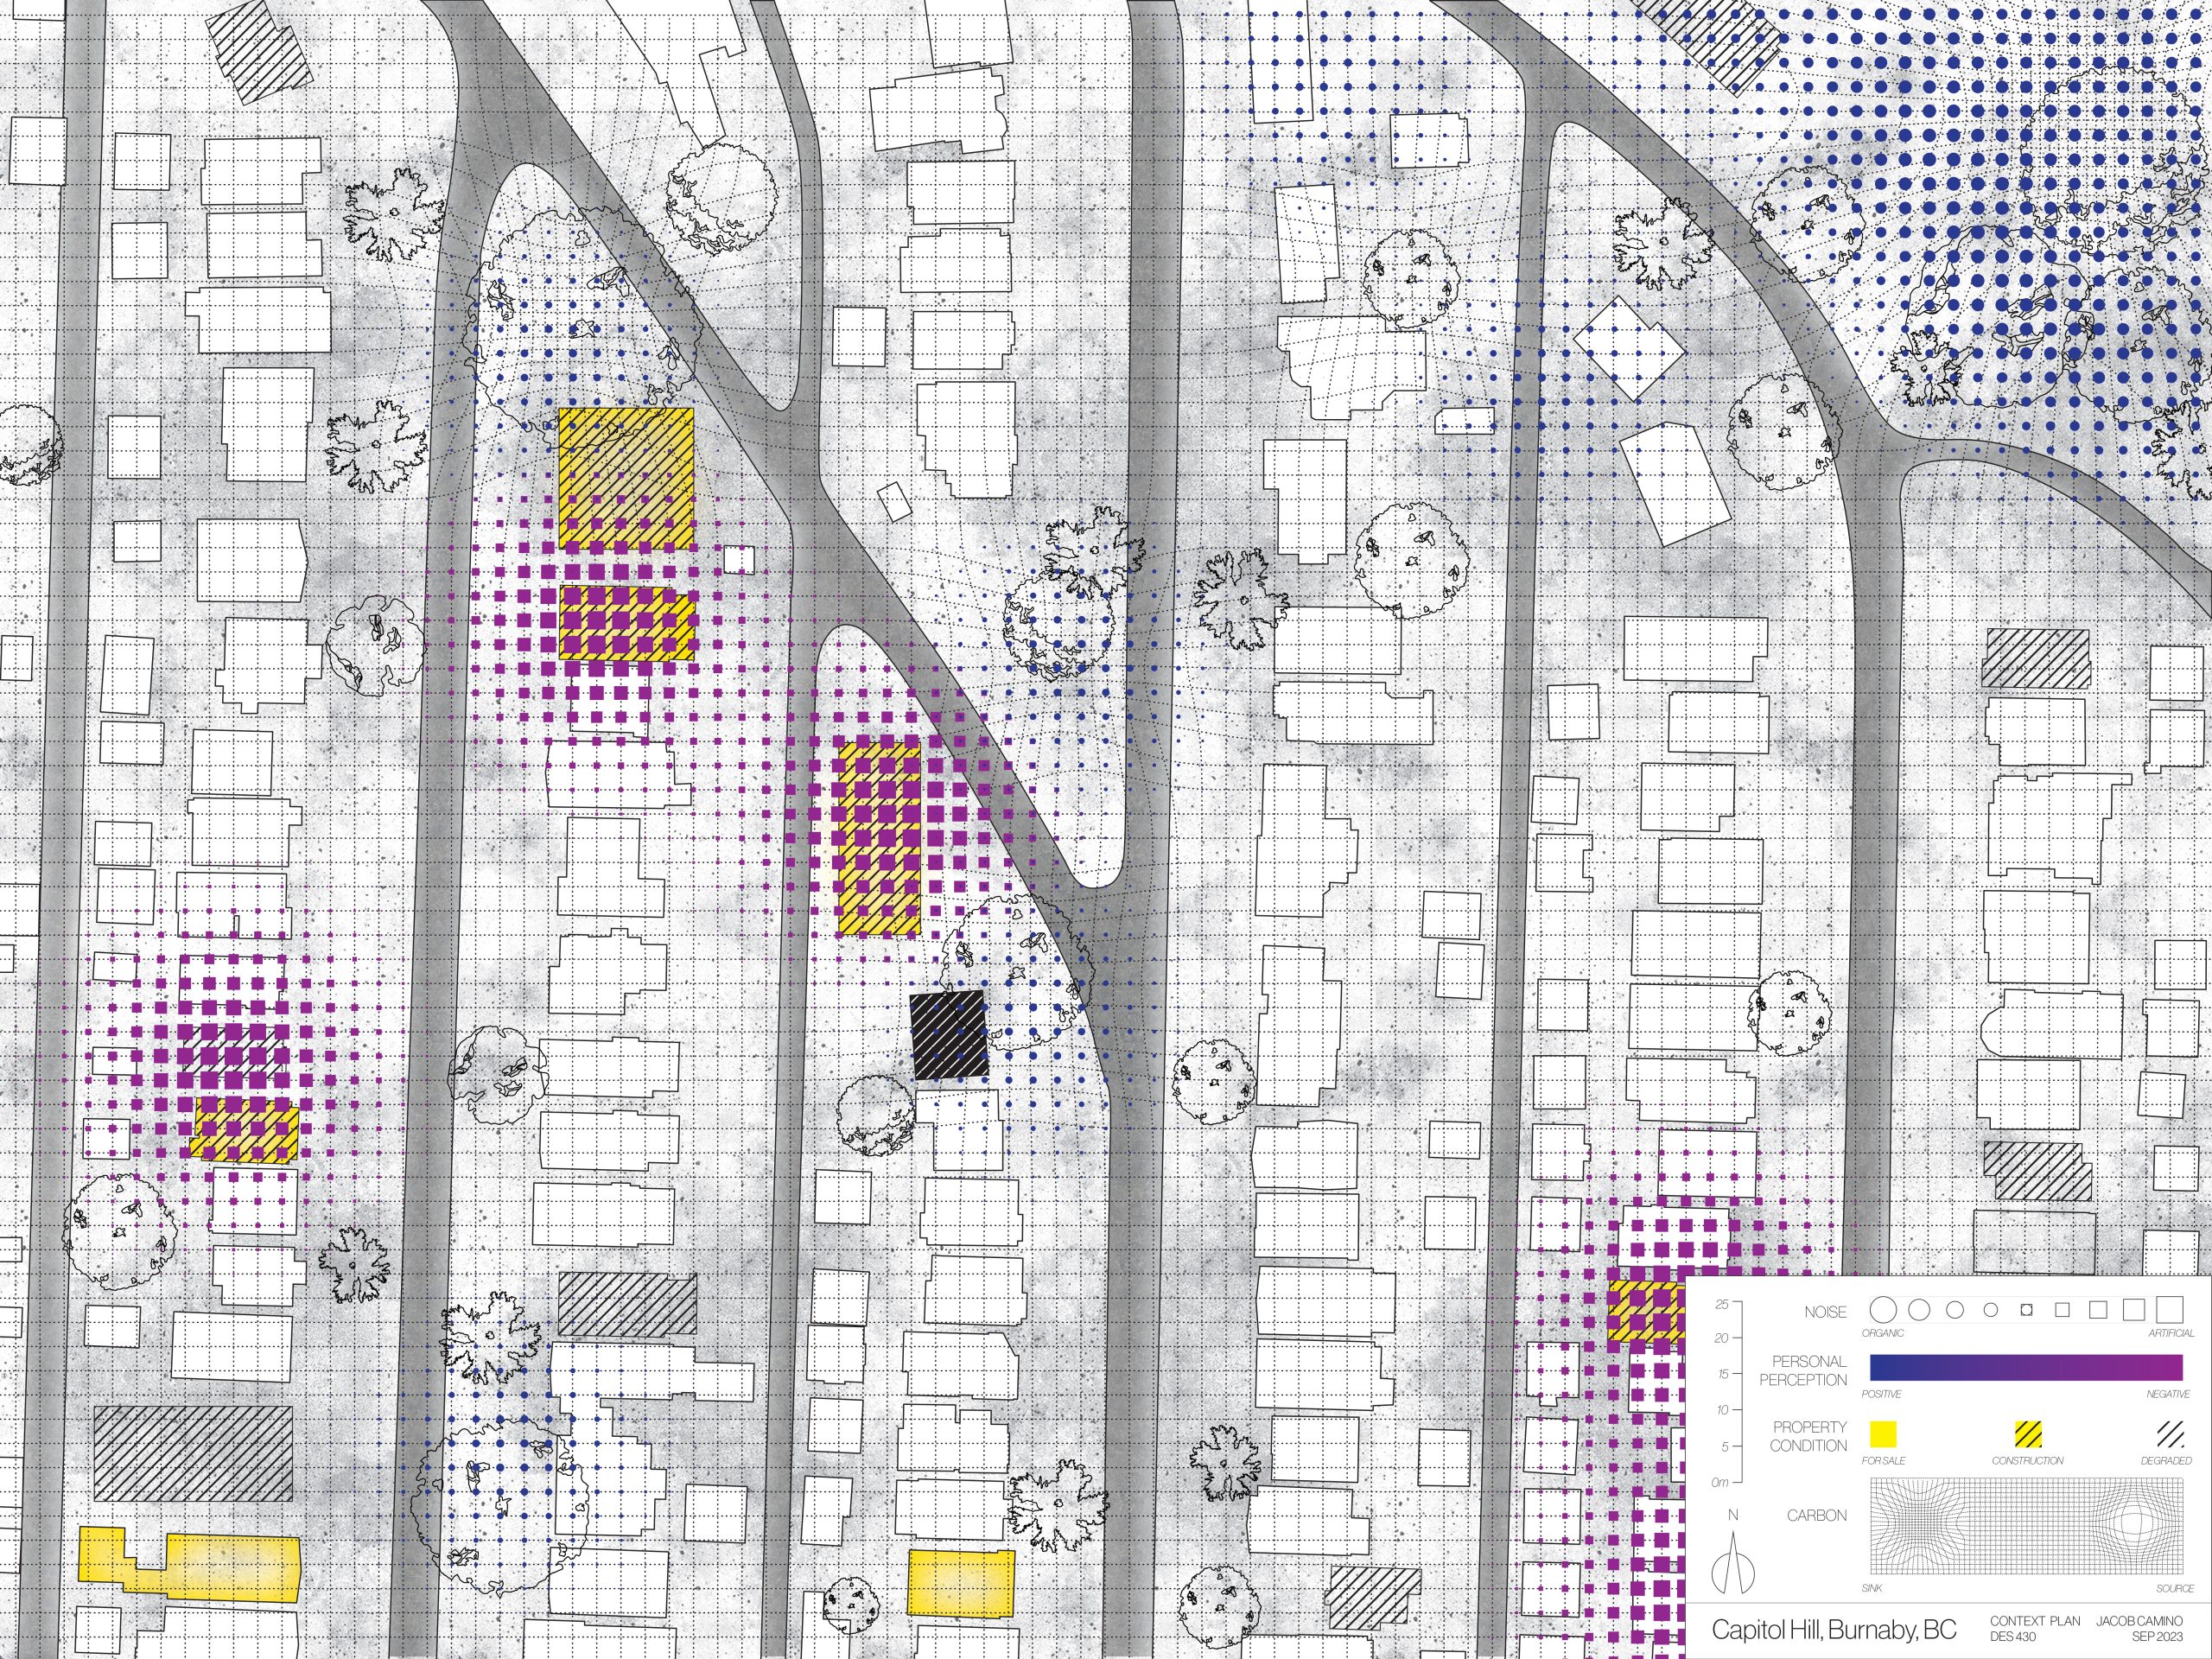
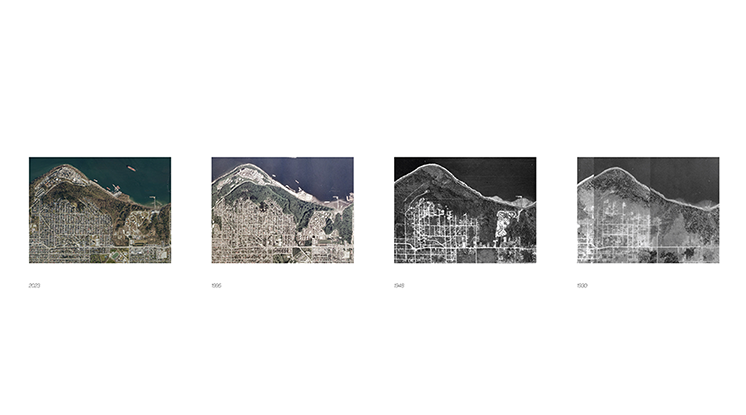
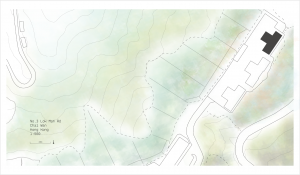
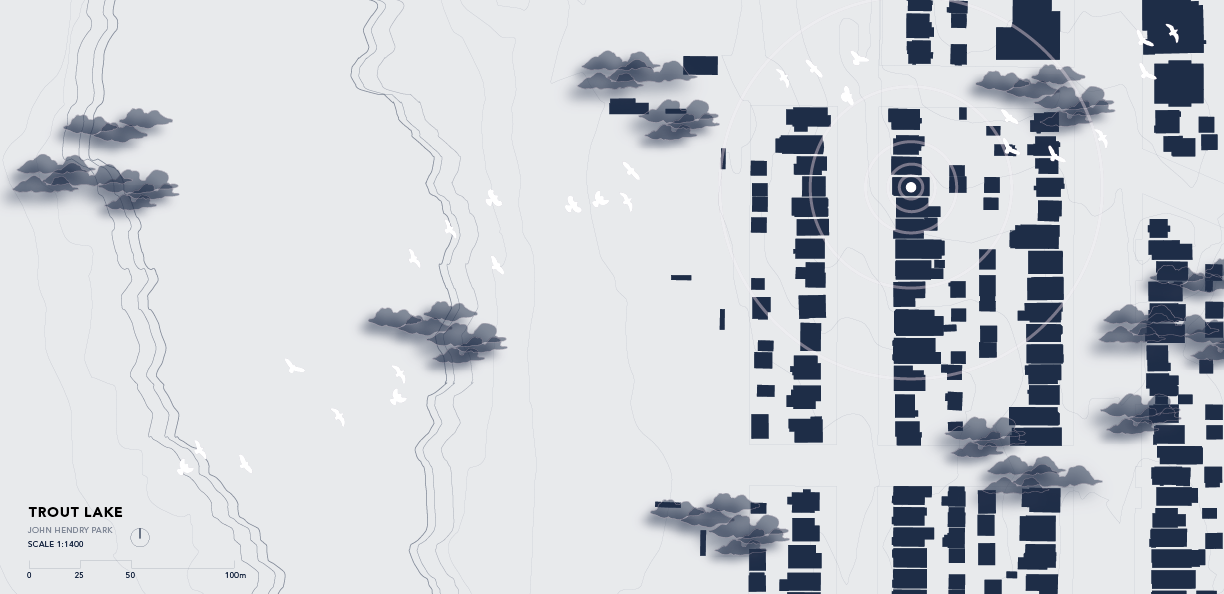
At a larger scale, the context plan shares the cycle of degradation – construction – sale. The various construction sites emit a high level of artificial noise, while the birds residing in the mature trees and the northeast forest manage to compete with their organic singing.
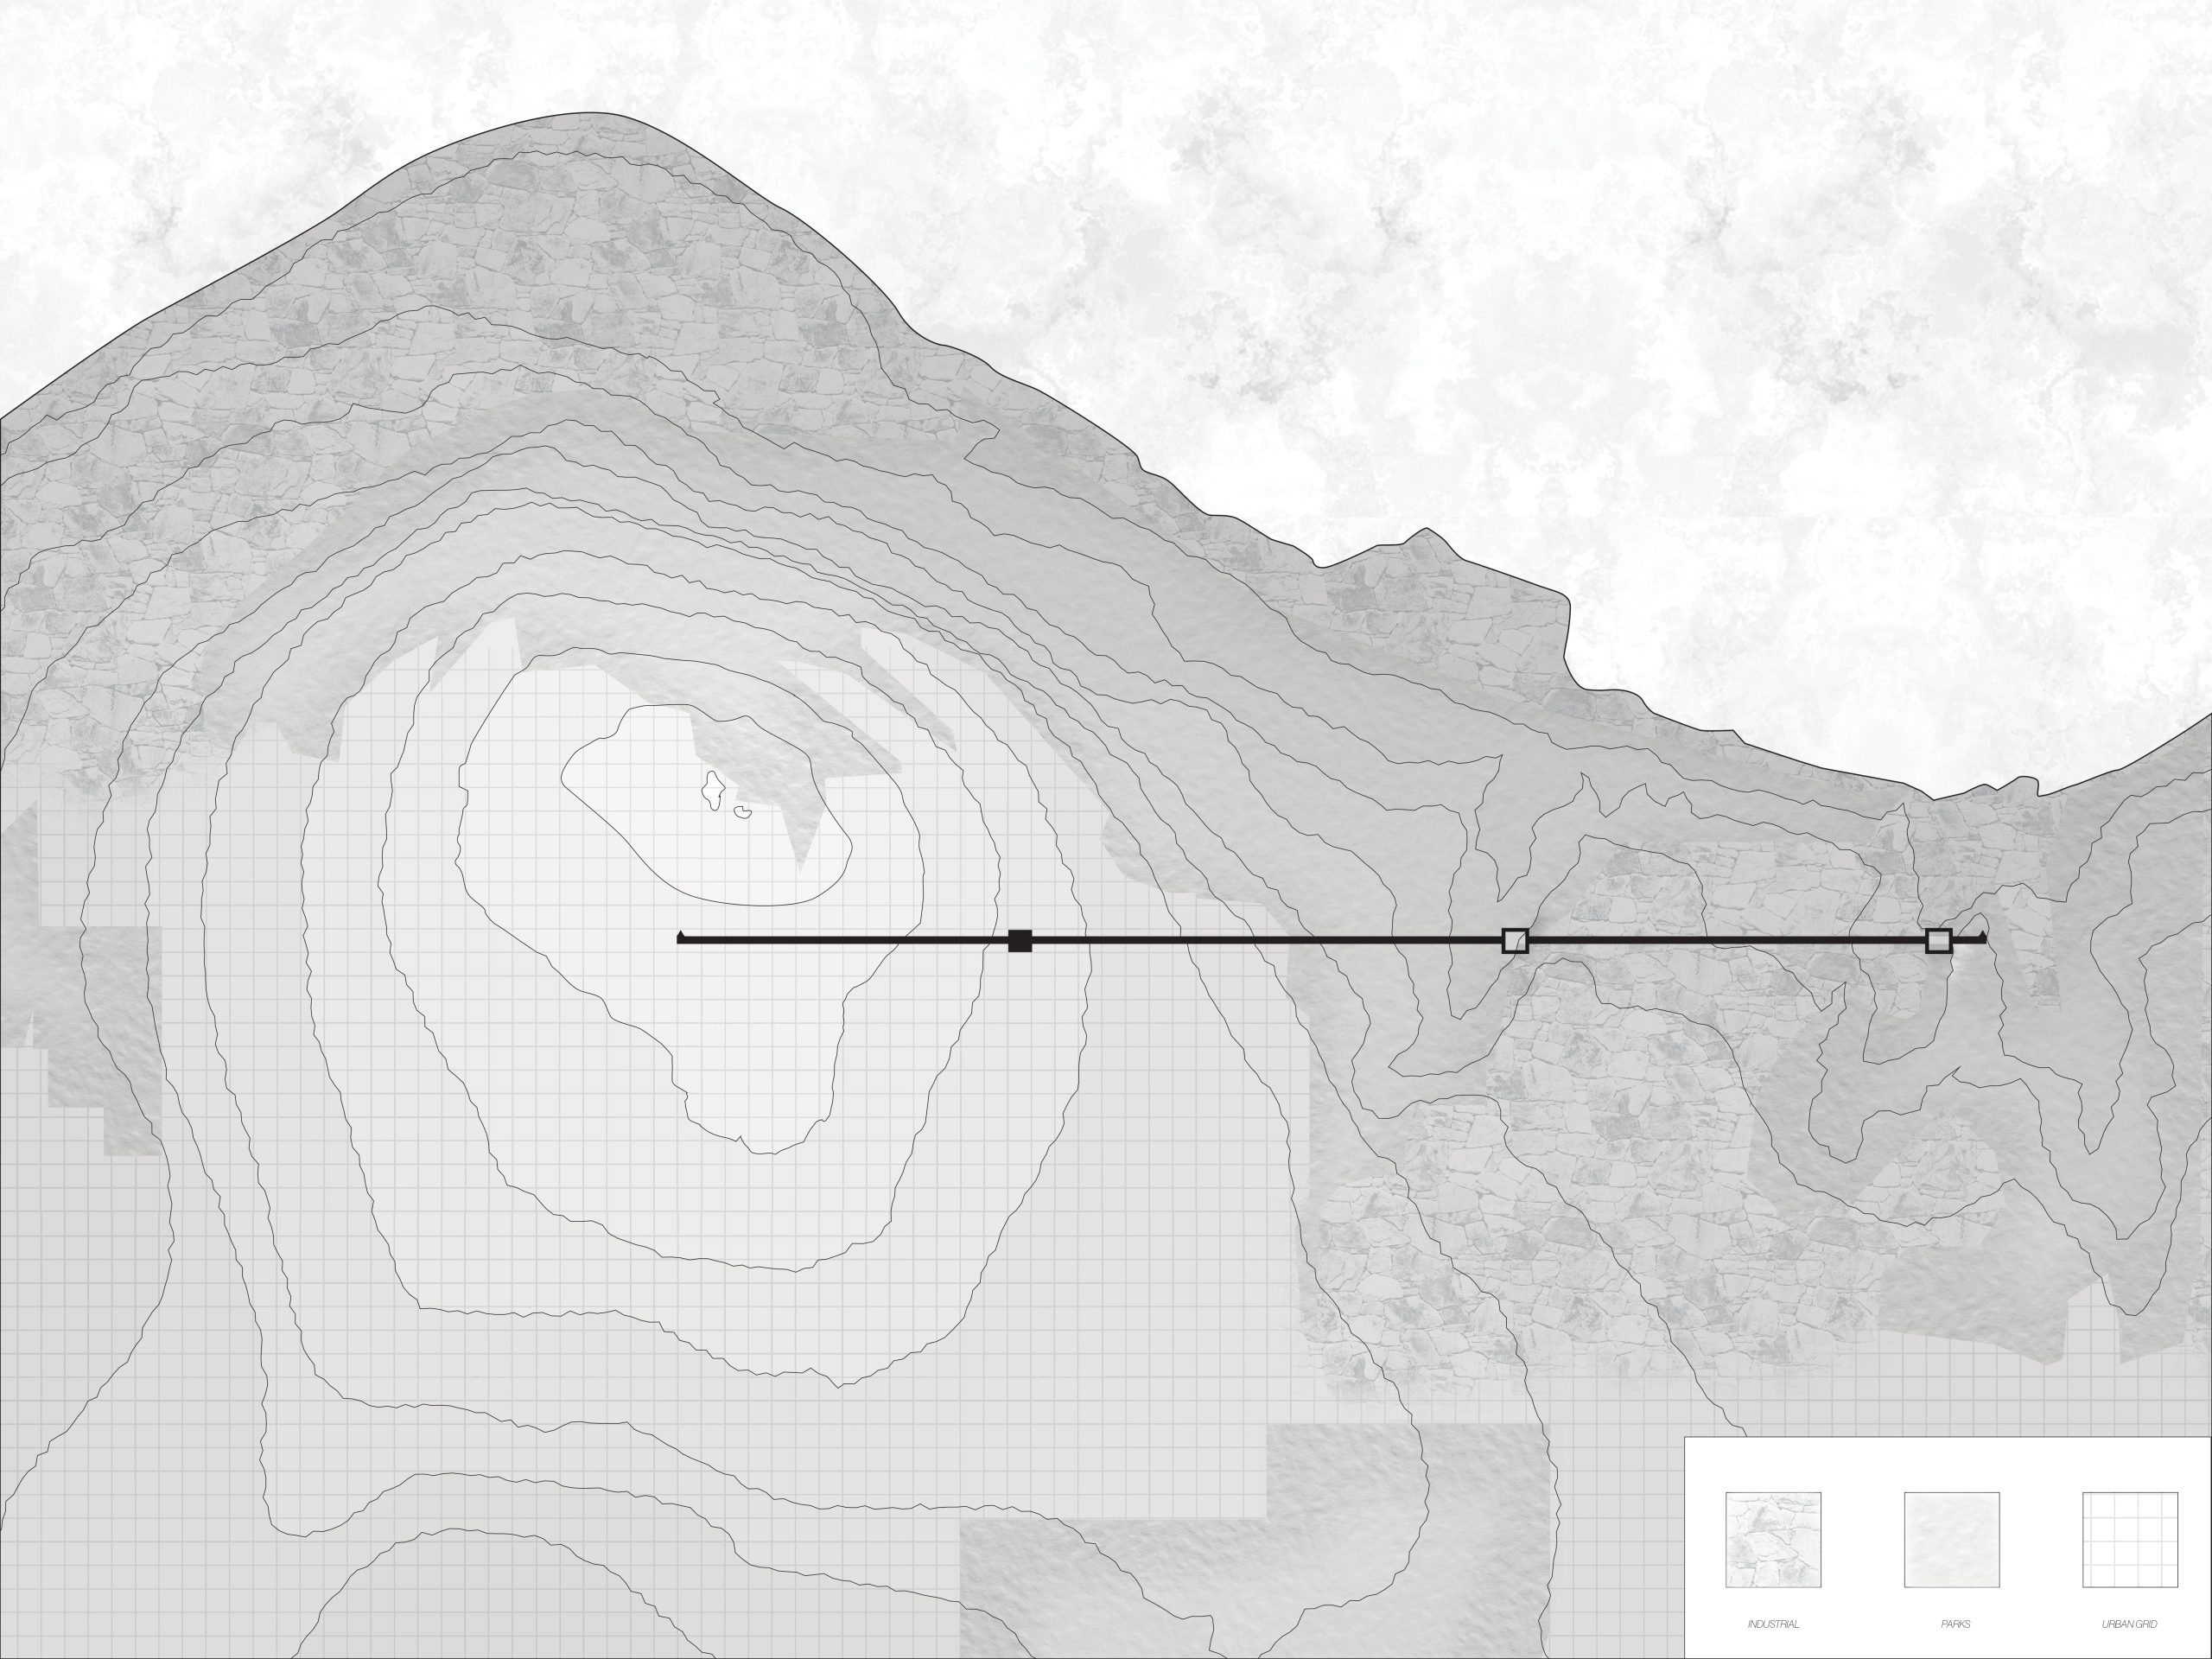
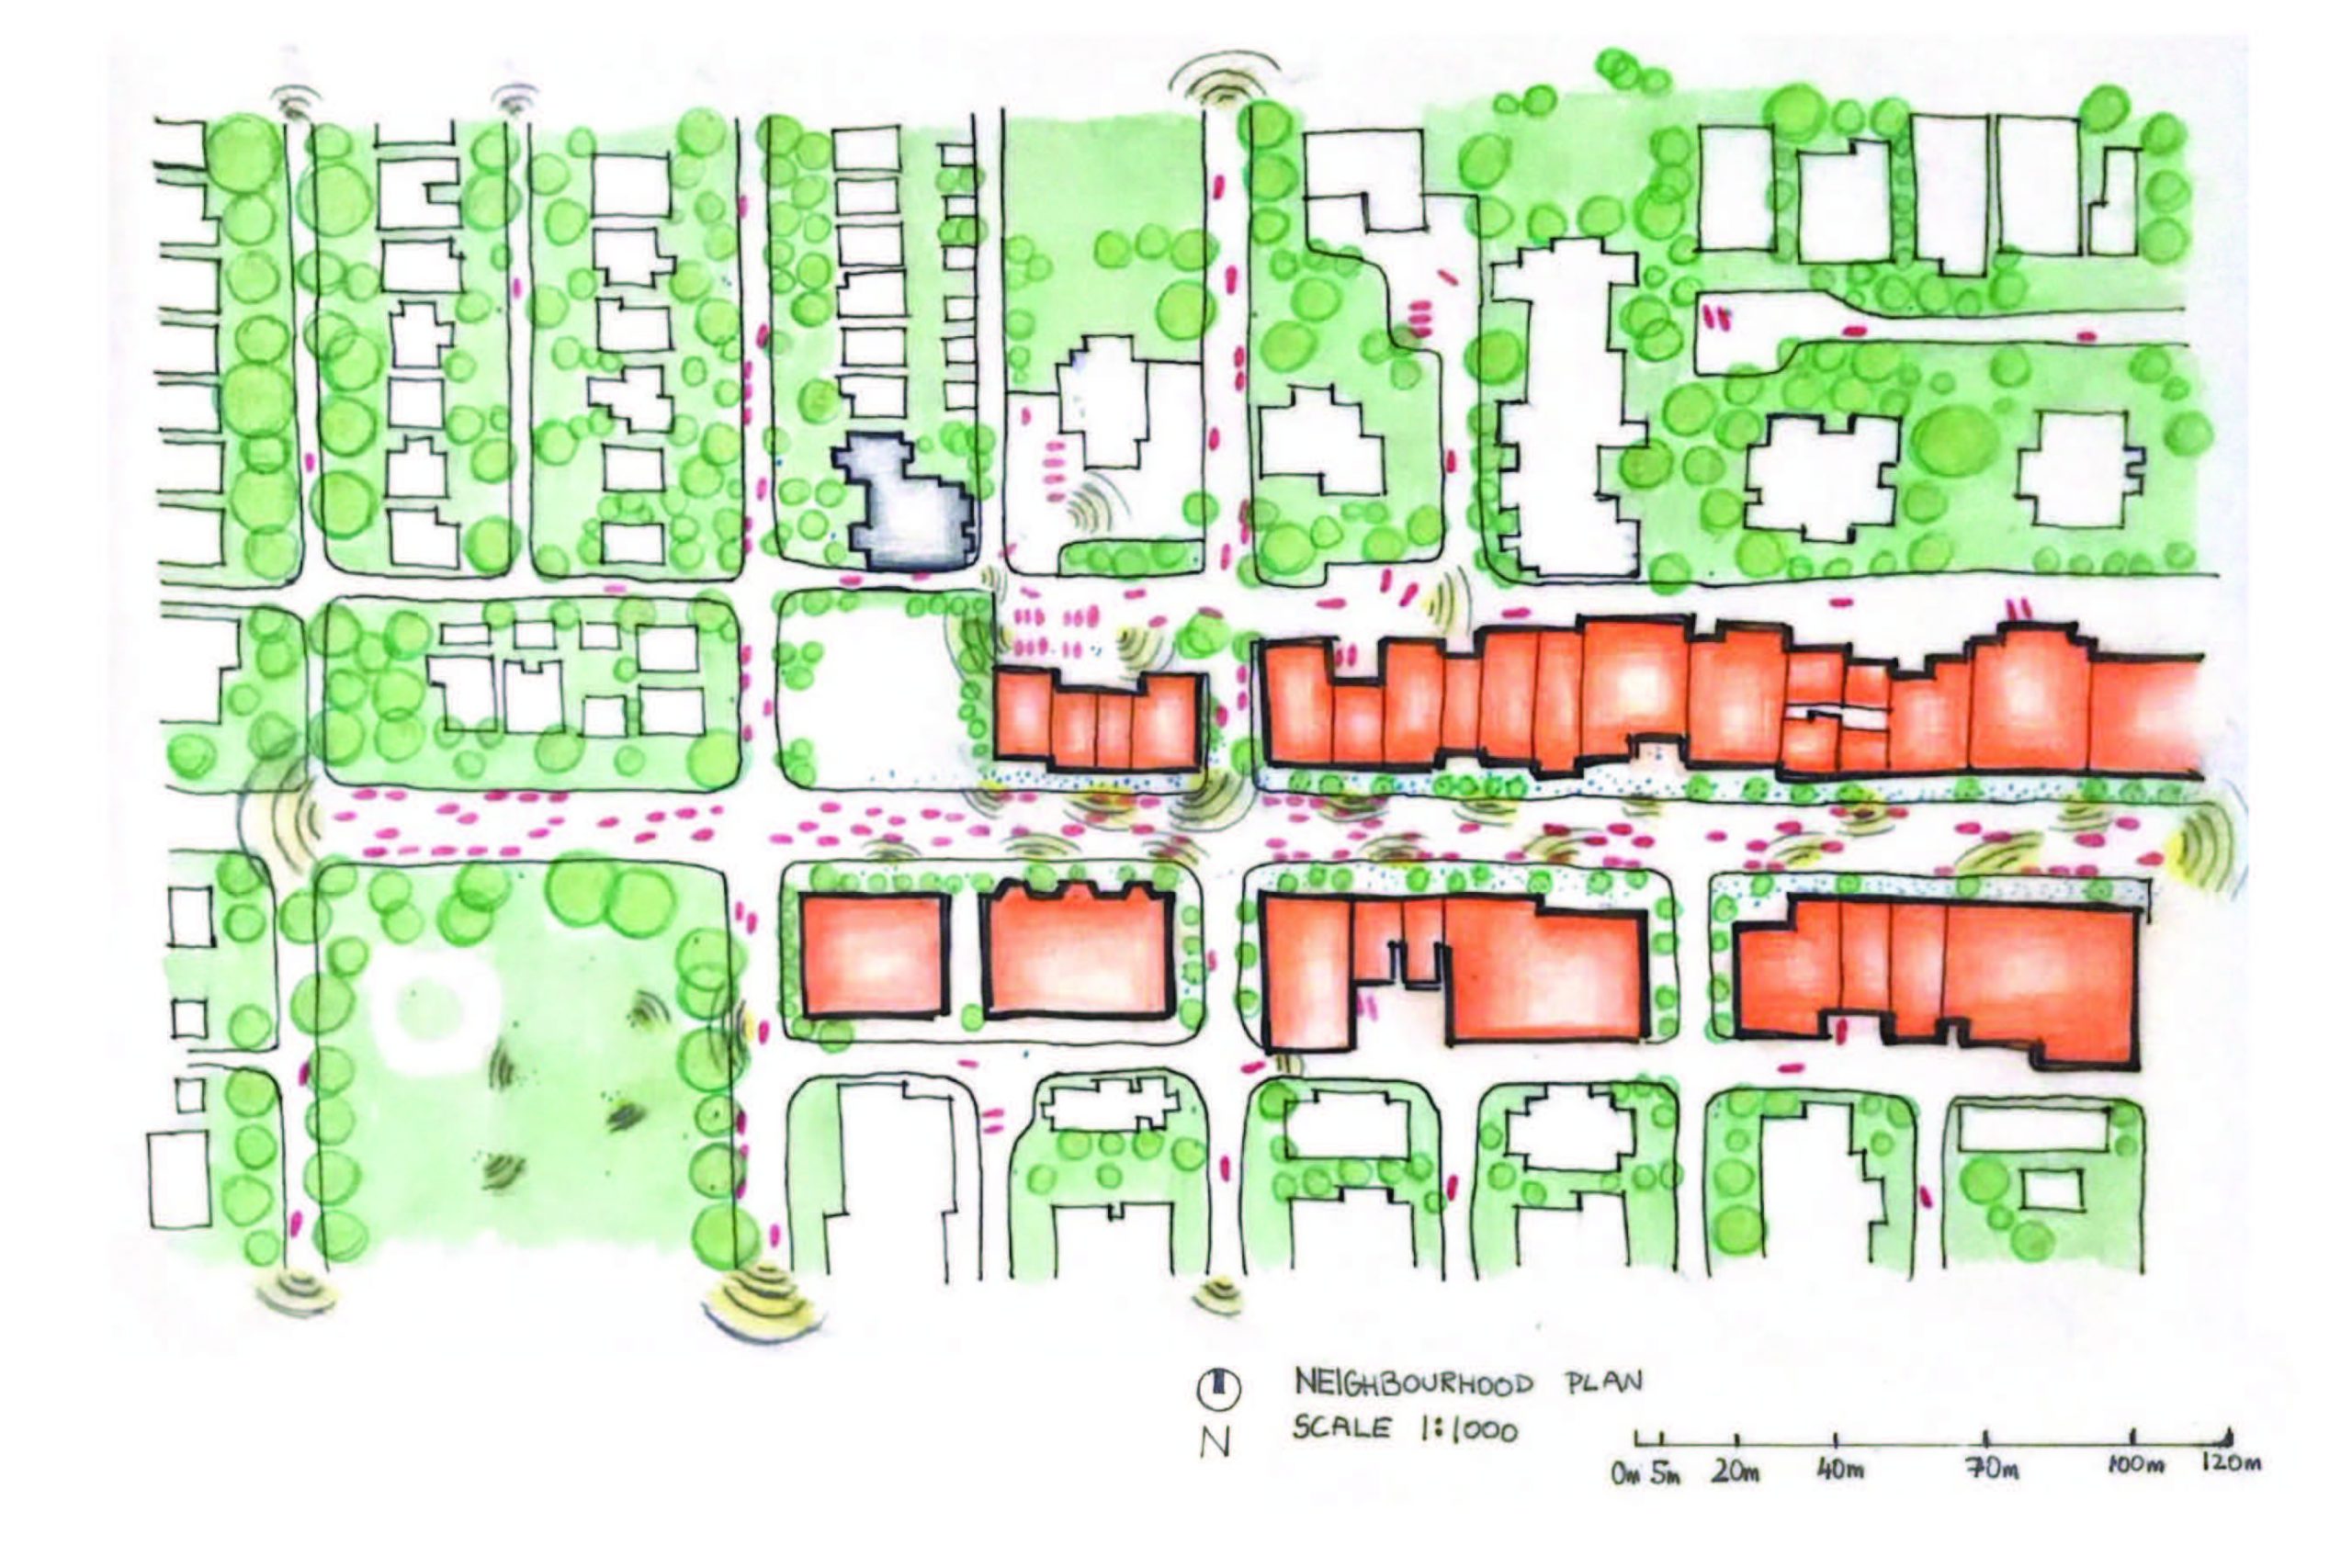
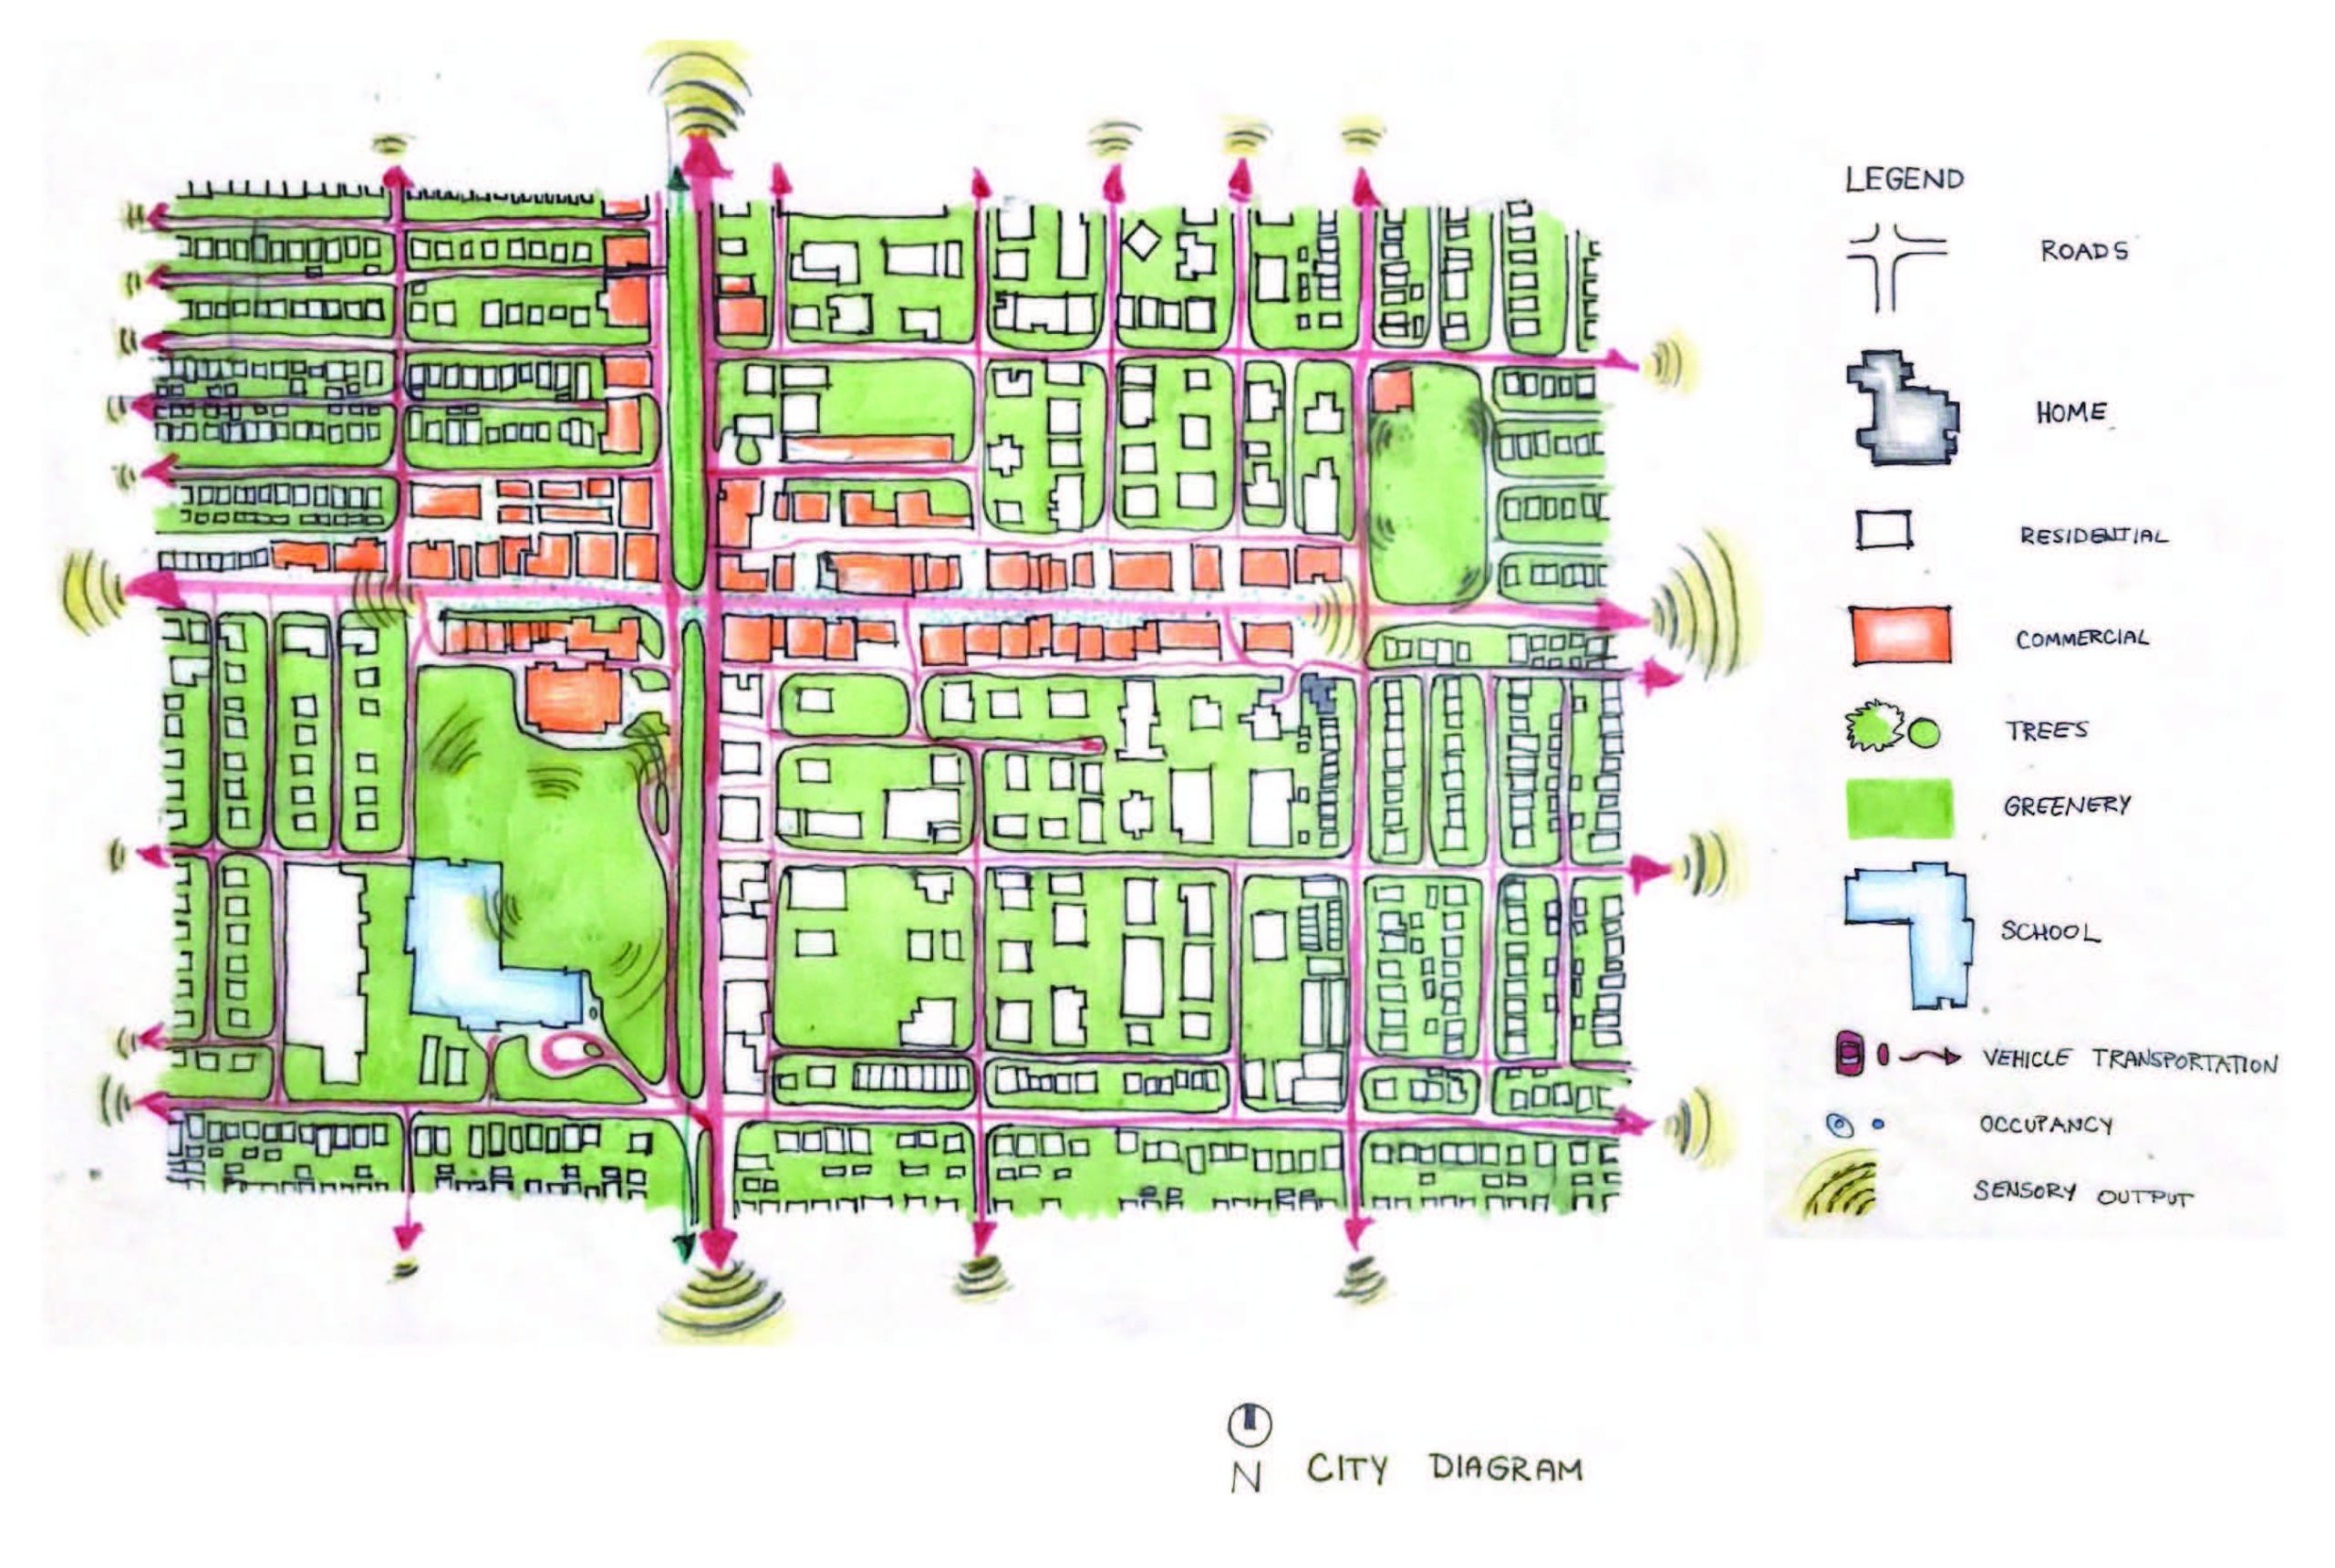
An orthogonal diagram communicating different land-use patterns of Capitol Hill, Burnaby; a section cuts through each category. City Diagram 02 accompanies the section cut of City Diagram 01.

A sectional diagram to document the different changes which occur at different heights within Capitol Hill, Burnaby


Individual – Delivery Time 1 Week
In this assignment, students will observe & record a familiar space.
Objective: Demonstrate your ability to capture a place that is familiar to you at multiple scales. Understand the influence of social, cultural, and environmental phenomena on your perception of space. Use drawings to capture and communicate your understanding of spatial attributes and distribution.
Process:
Deliverables*:
Ensure the scale of your drawing is clear. Include a scale bar and north arrow when appropriate. The deliverables can be drawn analog, digitally or as a combination of both.
Please submit your work to the blog by Tuesday, September 12th at 11:59 pm.
* In general, the number of deliverables is flexible for this course. We encourage students to make their own decision about what drawings are needed; the deliverables are a suggestion. For example, students may wish to alter the scale or add additional drawings to explain their observations.
References:
Required
Roehr, D., (2022). Multisensory landscape design: A designer’s guide for seeing. Routledge.
Recommended:
Badger, E. (2012, November 9). The evolution of urban planning in 10 diagrams. Bloomberg.com. Retrieved from https://www.bloomberg.com/news/articles/2012-11-09/the-evolution-of-urban-planning-in-10-diagrams
Graves, C. (2021, April 15). “Mapping abstract concepts for urban design” a lecture presented to HTWG Konstanz. Looking@Cities. Retrieved from https://lookingatcities.info/2021/04/15/mapping-abstract-concepts-for-urban-design-a-lecture-presented-to-htwg-konstanz-university-of-applied-science-faculty-of-architecture-and-design-constance-germany/
Martin, J., & Bliss, L. (2022, April 18). Powerful maps reflect two years of covid transformations. Bloomberg.com. Retrieved from https://www.bloomberg.com/news/features/2022-04-18/12-personal-maps-capture-covid-life-around-the-world?srnd=citylab-culture