The Principal is responsible for creating and maintaining an environment in the school that supports the holistic development of all students.
Standard 2.1 – Leadership for Learning
Instructional leadership requires on-going monitoring of student achievement using a variety of assessment data to inform decisions around instructional strategies, setting and evaluating goals for individual students, the classroom and the school, to provide engaging and effective programming. Good analysis also ensures that needed interventions and supports are in place for identified students. As part of our school visioning we have a Comprehensive Literacy Model that shows the interrelated components of our program that work together to support student achievement and personal growth.
Literacy Comprehensive Model LK June 12
TARGET 1: Decision making based on student needs
Clearly the foundation of a good program is high quality, engaging classroom instruction using ‘best-practices’ strategies, resources, and assessment methods. In order to monitor clearly the progress of students and the class as a whole, we meet with every teacher for several hours for Class Reviews. These take place over the week or two before each assessment and reporting period. The Leadership Team and the teacher meet to debrief on each student: we look at reading levels and behaviours, math achievement, working grade level for the time period, general academic achievement and any curriculum that needs to be reinforced, assessment practices, attendance, behaviour and extra-curricular involvements. I include below a sample outline of our process and documents required, and a ‘no-name’ Class Review:
Class Review Gr. 1,2 English 2012-2013 no name
Class Review Gr. 8-10 SD NN JAN 2013
If we still have some students who are not achieving we look to our Pyramid of Intervention that guides decisions to ensure all facets of our program – from academic programming, personal development and social responsibility, and language and culture supports are all in place. We can then focus on the specific needs of each student and offer further supports – whether academic or other, to ensure success. As we monitor the student’s progress we might find further intensive interventions are required – targeted, individualized interventions for academics, behaviour or any social or family issues that might need to be addressed with the cooperation of outside agencies and personnel, and parents.
LKDS Pyramid Response to Intervention Apr 2012
The first level of data that we use to make instructional or other decisions is the standardized test data from the yearly AAT, GRADE, and CAT4 assessments . As a staff, we analyze the data, informed by formative and summative classroom assessments, by student, by class, and then generate an overall picture of school-wide trends. From this kind of analysis we set goals for individual students, classrooms and the school. As the year progresses the data and the goals are revisited and any changes that are needed are put in place. Weekly co-planning sessions with teachers, staff meetings and Class Reviews are several of the venues for this work.
Overall, our student achievement results have been improving over the years of the Leadership for Literacy Initiative. Our primary focus for the school has been implementing the research-based strategies in all the classrooms, and to provide timely interventions and support for all students to be successful. We are targeting both literacy and math achievement, and have provided in school PD as well as invited support from the Literacy and Math consultants in the SSDEC. As we dig deeper into the individual student and class results we can generate goals to improve classroom instruction, and target curriculum outcomes that are showing poorly on the tests. I include below a sample of a ‘class by class’ analysis of AAT data; and this year’s analysis of CAT4 data – our first year doing this test:
Lutsel K’e Dene School AAT Analysis 2011-2012
General trends in our data in comparison to the five year average for AAT results. Percentages indicate the number of students meeting or exceeding expectations:
|
GRADE 3 |
Trends |
|
Grade 3 Math is 66.7% –
|
up 39.4% |
|
Grade 3 ELA is 66.7% o Writing is at 100% o Reading is at 66.7% |
up 20% up 37.2% up 14.6% |
|
3/3 grade 3 students wrote |
100% (up 8%) |
|
GRADE 6 |
Trends |
|
Grade 6 Math is 60% –
|
up 19.7% |
|
Grade 6 ELA is 20% o Reading is 40% o Writing is 20% |
down 14% down 20.5% up 1% |
|
5/6 grade 6 students wrote – |
83.3% (same) |
|
GRADE 9 |
Trends |
|
Grade 9 Math is 66.7%
|
up 53.4% |
|
Grade 9 ELA is 0% o Reading is 0% o Writing is 33.3% |
down 20.8% down 20.8% up 4.2% |
|
3/5 grade 9 students wrote –
|
60% (down 14%) |
We have set our current school goals in the context of our analysis of the tests results, with an understanding of the school context and history, and aligned them with regional goals and targets. Below are the current year 2012-2013 school and regional goals:
|
READING |
School Baseline (current) |
School Target |
Regional Target |
|
% of students gaining at least one stanine increase on the GRADE assessment in 2012-13 (AA)2011/2012: Stanine ≥4 = 69% % students with ≥ 90% att gaining 1 year growth (stanine) 67% % students achieving ≥stanine 7 17% – 20% (2010/11-2011/12) |
2011-2012 Gaining ≥ 1 stanine = 29%
|
35% |
15% |
|
AAT Results: % of students reading at or above the Canadian average in 2012-13 AAT results |
Gr. 3 – 66.7% Gr. 6 – 20% Gr. 9 – 0% |
Gr. 3: 70% Gr. 6: 40% Gr. 9: 25% avg=50% |
80% |
|
MATH |
|
|
|
|
% of grades 3, 6 & 9 students meeting or exceeding the AAT math standard than the current multi-year average |
Gr. 3 – 66.7% excel. 33% Gr. 6-60% Gr. 9 – 66.7% |
68% |
61% |
|
CAT 4 target in Sept 2013 |
overall 59% of students performing at or above average participation=50% |
65% |
? |
|
SOCIAL RESPONSIBILITY |
|
|
|
|
% of students achieving at least 90% attendance in 2012-13 |
2010/2011 25% ≥90% 2011/2012 7%≥90% |
30% |
57% |
|
% of parents completing the parent survey in 2012-13 |
2009/2010 – 60% 2010/2011 – 38% 2011/2012 – 48% |
55% |
55% |
We have a large percentage of our students on SSPs – over half this year. This continues to be a challenge in terms of planning and delivering a high quality Tier 1 program in the classroom. It also presents challenges for providing targeted support for so many individual needs in all the classrooms. One solution is we have used small group work to support some student needs. We see the impacts of poor attendance catching up with many students, in addition to learning disabilities and FASD issues. I attach below some our SSP data:
TARGET 2: School Improvement
There are many interrelated components of school improvement – student achievement and growth, staff professional development and overall satisfaction with their work, parent and community engagement, partnerships and support of the school by stakeholders and other community organizations.
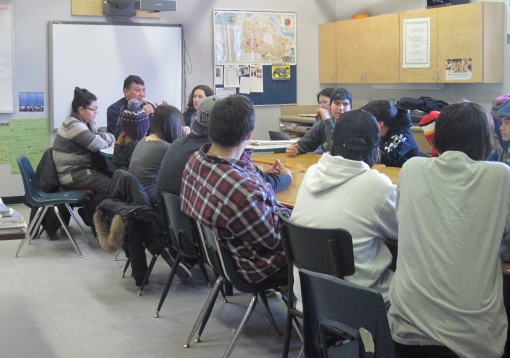
Student Achievement data from the GRADE, AAT, CAT4 standardized tests done yearly provide us with our main source of information to analyze individual and class achievement and identify any issues and skill gaps that arise. The goals established above assist in our planning of classroom instruction, student groupings, interventions for specific student needs, and any staff PD that might be indicated. We also get feedback from our Community Meetings that happen several times a year and are focused on specific issues that come up from parents or DEA. In February our Community meeting focused on attendance and the impact of low enrollment on the ability of the school to staff classrooms and provide adequate support. Although it has been the experience of other small school that have added Gr. 11,12 that it may take 4 – 6 years for the first Grade 12 students to graduate Grade 12; community members are understandably concerned that we have had one Gr. 12 graduate since we added the higher grades in 2009.
Once our students reach grade 10 they have difficulty maintaining focus and the students we have had graduate Gr. 10 tend to stop there. Students start families and working full time. What re the issues? Although our elementary staff is very stable, we have had higher turnover in the high school; after last year’s drop in enrollment it is difficult to offer a quality program after losing two teachers. The DEA has talked about offering more of an ‘alternative’ structure in the high school to support the busy lives of many of the students. This is something we will explore before the next school year.
Community Education Planning happens twice yearly. Our process has always been interactive and welcoming to the community. We generally set up at the Community Hall, and staff and other community organizations set up booths for information and feedback. We usually have a presentation and focus questions, and we break out into focus groups, and we also ask for feedback about programs and issues at each booth. We provide a few snacks and generally we have well over 100 people that attend. Generally the LKDFN Band office and the store close for the afternoon for our events. Our CEP/Leadership for Literacy Plan outlines our goals and vision for the school, incorporates as much as possible all the suggestions and ideas that we receive from the community, and provides us a general timeline for our implementation and analysis of our yearly program. Below is one of our agendas for this year, a parent survey from June 2011, the Parent Ballot from Fall 2012 CEP, and our current CEP Plan:
Community Education Planning Meeting Agenda and poster
Integral to our continuing improvement is professional development of the staff. Our teach-model-practice approach to professional development ensures that learning is authentic and occurs in context. With a full time Literacy coach the PD for staff runs into hundreds of hours. This year with a less than half time Coach we have been doing significantly less PD with staff, but the PD that has happened has been targeted to individual teacher needs. TMP data clearly shows that student achievement is correlated with staff PD hours at the school level.
PD Plan
Program Initiatives:
One of our main priorities at the school is to integrate the Dene Language and culture in a meaningful way. We developed a Culture year Plan to guide Dene Kede Implementation in the classrooms and to help visualize our yearly cultural on the land activities.
CULTURE Year Plan Aboriginal Language & Culture Lutsel K 2012-13
The Nature Conservancy Program with the LKDFN. This funding was secured in partnership with the First Nation to help develop culturally integrated curriculum units and activities for students at the school. One of the high school teachers was dedicated half time to developing curriculum using community resources and current technology to ensure authentic, culturally relevant activities for Science, Socials, ELA, History, and Math. This project was also focused on authentic assessment and tying many of the activities and learning to current community issues like protection of water and other resources, mining impacts and negotiations, caribou and 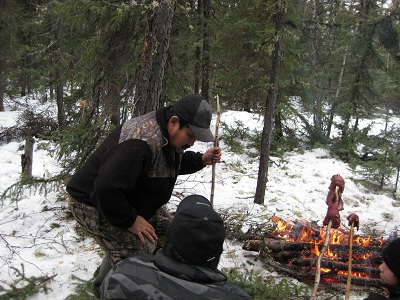 environmental monitoring, and climate change research.
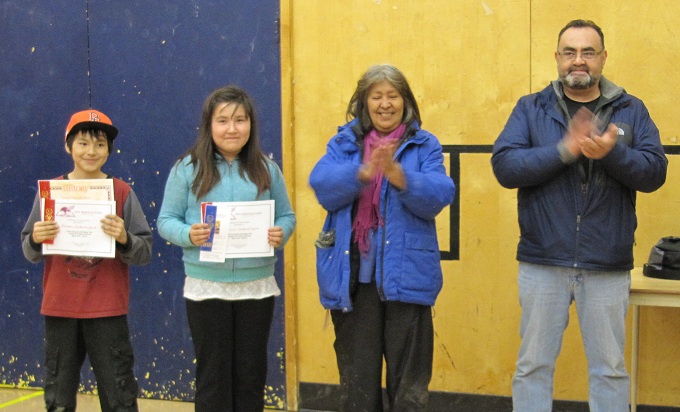
The Heritage Fair
This interdisciplinary project is an excellent opportunity for students to explore their interests and tap into community resources. Elder and family interviews, photos from the archives, internet research are activities that help students learn more about their DENE heritage. Students are encouraged to be creative in their presentations. This year several students presented video interviews with people attending the Spring Hunt, videos demonstrating traditional skills like preparing caribou hides for use, or researching the roots of traditional games and then demonstrating them to judges and viewers. The projects encourage ownership and pride in culture as students are expected to be able to talk knowledgeably about their topic and make personal connections. The projects encourage presentation skills, confidence and responsibility for learning. Attached below is our Heritage Fair rubric and some of the identified learning outcomes for Grades 4 – 7 that intersect with Heritage Fair projects:
Artillery Lake Spring Hunt, Trapping Program, Spring Canoe trips – integrate language and culture with science, socials, history and many other curricular outcomes – including developing student civic responsibility, leadership, confidence, and presentation skills.
In March this year, students spent a week out at Timber Bay, Artillery Lake with family members, community resource people, caribou monitors from ENR, and camp workers responsible for ensuring the safe and smooth running of the camp, and local hunters responsible for taking all students out hunting and teaching them how to travel safely, cut caribou to take the hides, prepare the meat for transport, and prepare meat for cooking and for smoking and drying. Many of the students documented their experiences using video, video interviews, and digital photography which was then the basis for their heritage Fair projects. Students and instructors are evaluated using a rubric, and students who demonstrate effort and mastery in most of the skills and attitudes at camp are given the CTS credit Wilderness Experience.
TARGET 3: Advocacy for Students
The Principal leads a school community that uses school and outside resources to implement effective programs for all students. Partnerships with community organizations and businesses are vital to provide this support.
As an IBA community Lutsel K’e has a relationship with several diamond mines that includes supporting education and community development. BHP has been very generous with our school over the past few years and have donated a computer lab and presented substantial funding to support cultural programming in the school. The mines also provide yearly visits for high school students that provide career information on opportunities available in the mines and the education required to take advantage of these.
The school also works with various partners in and out of the community to offer special events and travel opportunities and special courses. Some examples from this year are:
Heritage Fair, Career Fair, School teams, After School programs – Kids in the Kitchen, Drop the Pop workshops – Health & Social Services – Wellness and Healthy relationships programming, Sports and Recreation, Sport North, Dene Games, DiscoverE Science Program, Junior Rangers, Ekati Mine Trip, Page Program, TAP Program, Rik Leaf Video Workshop, Clara Hughes, Spring Hunt, Trapping trips, DeBeers Books in Homes and Career Fair, Canoe Trips – Wildlife, Special Courses – GPS, Wilderness First Aid, Food Safe with Aurora College and the Yellowknife Health and Social Services.
The school is involved with visioning the Community Wellness Plan with LKDFN and H&SS and other organizations to maximize the community’s ability to meet all the needs. Parent surveys are also used periodically to gauge parent understanding and support of school programs. I attach a copy of the Draft Wellness Plan:
Lutsel K’e Community Wellness Plan – DRAFT
LK_Student_Surveys_All_Students
The students generally indicate that they are learning and have good support from the teachers. This survey from last year indicated 25% of the students felt insecure and were concerned about bullying – along with students in every other school in Canada! It is clear the students have heard conversations about the school renovation and are looking forward to a nice gym, library, and viewing spaces for families to watch sports. Our efforts to upgrade our computer lab (thanks to support from BHP) and install SMART Boards and acquire laptops for high school students has been appreciated. But like the staff, they wonder why the school and community should have such slow internet speed compared with Yellowknife and other larger centres.
The parents seem very happy overall that education in the community has improved over the past number of years. In particular they are very pleased with the elementary program and the excellent student achievement in those grades. There are a few concerns with bullying of the younger students by the older students, and with occasional inappropriate teacher reactions to difficult student behaviour.
We are working to monitor bullying in every classroom and space in the school and any student reported is called to task and parent contact is immediate. In addition to our EBS foundation, teachers follow the Second Step Program to help students learn self-control, and develop the ability to ‘reflect’ on their emotional and mental states. The teachers model and help students practice strategies to deal with their experiences and take responsibility for their actions.