Cool demonstration of how different locations could affect the quality/expressions of sound!
Monthly Archives: May 2017
 Follow
Smelly Maps
I found myself in a bit of a smell-mapping wormhole after listening to Act Three of episode 110: Mapping of This American Life (I live in Hastings-Sunrise, so am subject to the putrid smell of the West Coast Reduction on north-west windy days.) In doing so I stumbled upon the work of Kate McLean, “an artist and designer, creator of smellmaps of cities around the world.” McLean’s full portfolio of work is available HERE.
“Smell remains an under-valued and under-researched sense which possesses the capacity to induce time-travel and momentary location-displacement, translating anonymous space into personalised place.” – McLean, K (2013) PhD Abstract Version 3
Related Resources:
Lee, Vivian. 2014. “Data for a New York ‘Smellmap’ Collected Sniff by Sniff” New York Times. https://www.nytimes.com/2014/09/12/nyregion/the-data-for-a-map-collected-sniff-by-sniff.html?_r=1
Young, Molly. 2011. “The Smelliest Block in New York.” New York Magazine. http://nymag.com/guides/summer/2011/smelliest-block/
McLean, Kate. Daniele Quercia, Rossano Schifanella and Luca Maria Aiello. 2015. “Smelly Maps: The Digital Life of Urban Smellscapes” In Proc. of the 9th International AAAI Conference on Web and Social Media (ICWSM).
Daniele Quercia, Luca Maria Aiello, Rossano Schifanella. 2016. “The Emotional and Chromatic Layers of Urban Smells” In Proc. of the 10th International AAAI Conference on Web and Social Media (ICWSM).
Good City Life. Smelly Maps. http://goodcitylife.org/index.html
Enlarge

Enlarge

Enlarge

40 Maps They Didn’t Teach You In School
http://www.boredpanda.com/fun-maps-they-didnt-teach-you-in-school/
This site above has a good collection of interesting and fun mapping projects that can help ignite some inspiration for the next project. It covers all kinds of studies from the map of Pangea to a more serious map of beer names in Europe.
Just a little lol
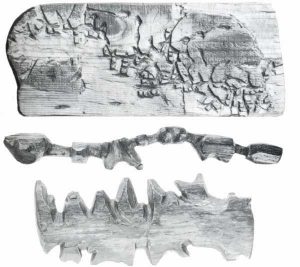
Inuit Carved Maps
HUMAN AS SENSOR 2
Geo-blog from MIT Senseable City Lab
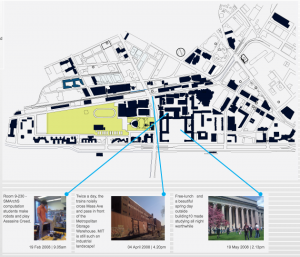
Geo-blog is a web-based platform for geo-tagging and sharing user generated content on the one hand and retrieving the shared, geo-tagged content based on current location on MIT campus at any given time on the other hand. The platform is open to MIT community for the content contribution part and open to public as a location-sensitive content viewing platform.
Aris Venetikidis: Making sense of maps – TED TALK
“Map designer Aris Venetikidis is fascinated by the maps we draw in our minds as we move around a city — less like street maps, more like schematics or wiring diagrams, abstract images of relationships between places. How can we learn from these mental maps to make better real ones? As a test case, he remakes the notorious Dublin bus map. (Filmed at TEDxDublin)”
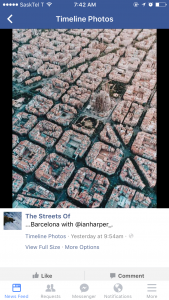
Barcelona from above
A Bias for Whales
A local visual artist, Natasha van Netten, explores mapping from a whale’s perspective:
My current drawings and paintings revolve around the largest, most illusive creatures alive—whales. In the advancing field of Cetology (the study of whales) data is scarce and research is often speculative and hypothetical. My work translates this scientific information into a language of accumulated marks and brush strokes to give clinical data a visual meaning while exploring this mysterious space between known and unknown information. (van Netten)
In her series titled Cetacean: Chartwork (samples below), she inverts what is positive and what is negative between water and land forms. It makes me think of an interpretation of the Nolli map. One version can be occupied by humans, and another by whales.
To see more of her mapping work:
https://natashavannetten.com/cetcean-chartwork/
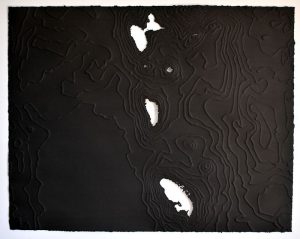
Dominica: -61.339, 15.447
22″ x 28″, India ink on embossed paper, 2016
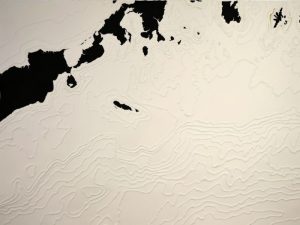
Bering Sea: -161.411°, 54.795°
22″x30″, gouache on embossed paper, 2015
Paula Scher: Great design is serious, not solemn | TED Talk
Ted Talk to watch:
Good article to read:
https://www.theatlantic.com/entertainment/archive/2011/10/paula-scher-makes-enormous-maps-that-are-only-sort-of-right/246880/