A Bias for Whales

A local visual artist, Natasha van Netten,  explores mapping from a whale’s perspective:

My current drawings and paintings revolve around the largest, most illusive creatures alive—whales. In the advancing field of Cetology (the study of whales) data is scarce and research is often speculative and hypothetical. My work translates this scientific information into a language of accumulated marks and brush strokes to give clinical data a visual meaning while exploring this mysterious space between known and unknown information. (van Netten)

In her series titled Cetacean: Chartwork (samples below), she inverts what is positive and what is negative between water and land forms. It makes me think of an interpretation of the Nolli map. One version can be occupied by humans, and another by whales.

To see more of her mapping work:
https://natashavannetten.com/cetcean-chartwork/


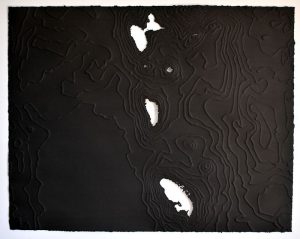
Dominica: -61.339, 15.447
22″ x 28″, India ink on embossed paper, 2016


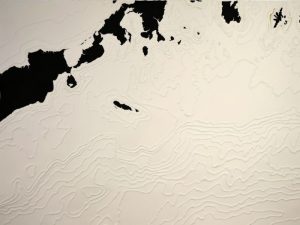
Bering Sea: -161.411°, 54.795°
22″x30″, gouache on embossed paper, 2015

Weed Maps App

Disclosure: I’m not promoting or condoning this app- I just happened to see 2 billboards for it over the long weekend and thought it was funny enough to share it. The first “High Vancouver” billboard was spotted driving back into Vancouver from YVR, perhaps banking on cannabis tourists arriving to the city. The second was in Brewery Creek – an area full of  breweries and a number of dispensaries.

Available in the App Store or visit directly here.

Are the maps we take to be unbiased truly unbiased? – Indian Borders according to Google.co.in versus Google.com

These two maps reflect the Indian Northern Border as depicted on Google.com (the American reflection of Google Maps) and Google.co.in (the Indian reflection of Google Maps). This ambiguity is hugely important and affects huge amounts of people. What are the implications when we take maps the Google maps to be objective and true?

Sam

https://i.redditmedia.com/Y9_kGExGF1M8Rjx_KdiRQgG9aeOO8dPuUoGaR5YiSfg.png?w=750&s=7503e960fa5b2fb16d751900801cc6e2

Dialect Maps

Over the long weekend, I completed a New York Times Survey, that takes your pronunciation of words, and specific terms for things like a long sandwich, or the strip of grass in the middle of road, and uses your answers to place you/or where you’re from. Turns out the world I use for something located diagonally across a street, “kitty-corner”, was able to pinpoint me to either Seattle or Tacoma (sadly this was only an American Map).

Take the quiz here: http://www.nytimes.com/interactive/2013/12/20/sunday-review/dialect-quiz-map.html

Also very interesting is the similar vein of research being done at Cambridge that maps all world Englishes. You can contribute your own personal answers, or simply confirm, for example, that ‘washroom’ really is a Canadian thing! See below

http://www.tekstlab.uio.no/cambridge_survey/

Map of Curaçao- 1758

From: http://www.goldenageofpiracy.org/dutch-republic/curacao.php

When the Dutch arrived in 1634, they built forts at key points around the island to protect themselves from foreign powers, privateers, and pirates. Six of the best preserved forts can still be seen today: Waterfort (1634) Fort Amsterdam (1635) Fort Beekenburg (1703)[30] Fort Nassau (1797) Riffort (1828) Piscadera Bay Fort (built between 1701–1704).

To continue reading about the Dutch Forts and how they’re mapped visit the site noted above.

Exhibition Audio _ SOAK:Mumbai in an Estuary

If it interests you,  here is my interpretation of Anuradha Mathur and Dilip Da Cunha’s digitally constructed maps produced as a reaction to the 2005 floods in Mumbai.

Their work was originally displayed at the national gallery in New Delhi, and therefore i have opted to present their work as an exhibition.  In a gallery setting,  the artist rarely gives an oral account of their work (perhaps to allow the viewer to construct their own conclusions); however sometimes an artist’s work is supported by audio (often to provide context).

This recording is intended to serve as a jumping off point for a discussion with you: So please have a listen (IMG_1120), or just look (SOAK), and I would love to discuss their work with you after.

IMG_1120

Janet Cardiff & George Bures Miller’s Audio / Video Walks

Canadian sound artists Janet Cardiff and George Bures Miller have developed a series of audio and video walks that occupy the disconnect between space as a lived phenomenon and a recorded map.

Within the work, visitors are invited to trace the same route that Cardiff herself had completed within a particular space (here, Alter Bahnhof in Germany), experiencing her own audio commentary and “live” video recordings through the space.

The work becomes complicated and provocative through its focus on time-based media within the diegetic world of the video. Cardiff brings the viewer’s attention to the ephemeral and fleeting live performance of buskers and ballerinas (which are unlikely present in the contemporaneous setting the viewer occupies) , just as she focuses on historic maps and encased documents within the site, which themselves make visible the lapse between past and present.

What else does this call to mind for you? What other examples are there of maps that exploit the potential of portable and new media?

Has anyone actually experienced one her and Miller’s “live” works before?

Read more about Cardiff and Miller here:

‘Pleasure Principals: The Art of Janet Cardiff and George Bures Miller’, Border Crossings (2001)

An investigation of a physical installation by the duo, and Cardiff’s discussion of the “physical aspect of sound.”

‘Janet Cardiff by Atom Egoyan’, BOMB Magazine (2002)

An interview with Cardiff by the Canadian filmmaker.

Janet Cardiff, George Bures Miller and the Power of Sound, The New York Times (2012)

A NYT profile on the artists and their personal and professional partnership.