Category: 02
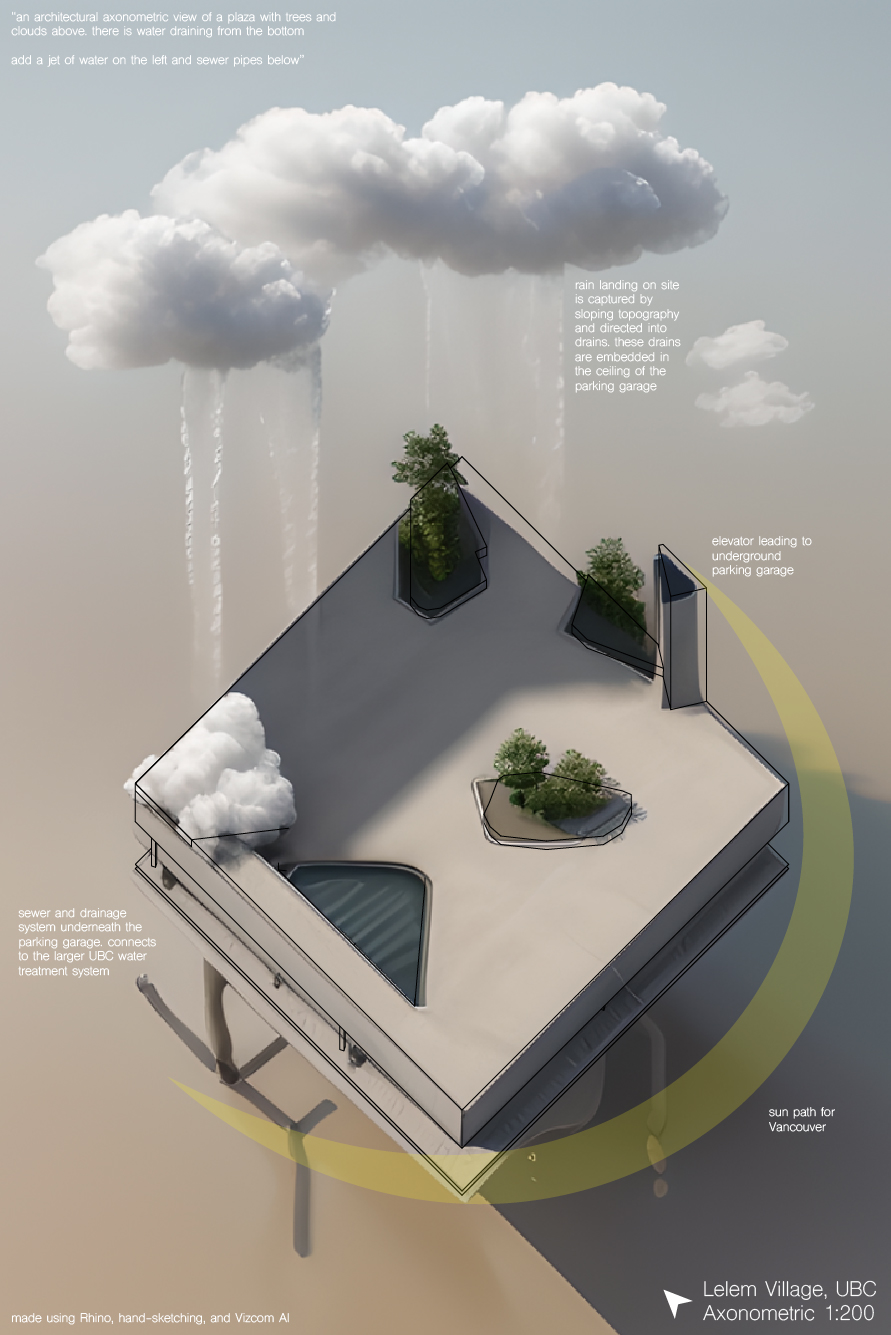
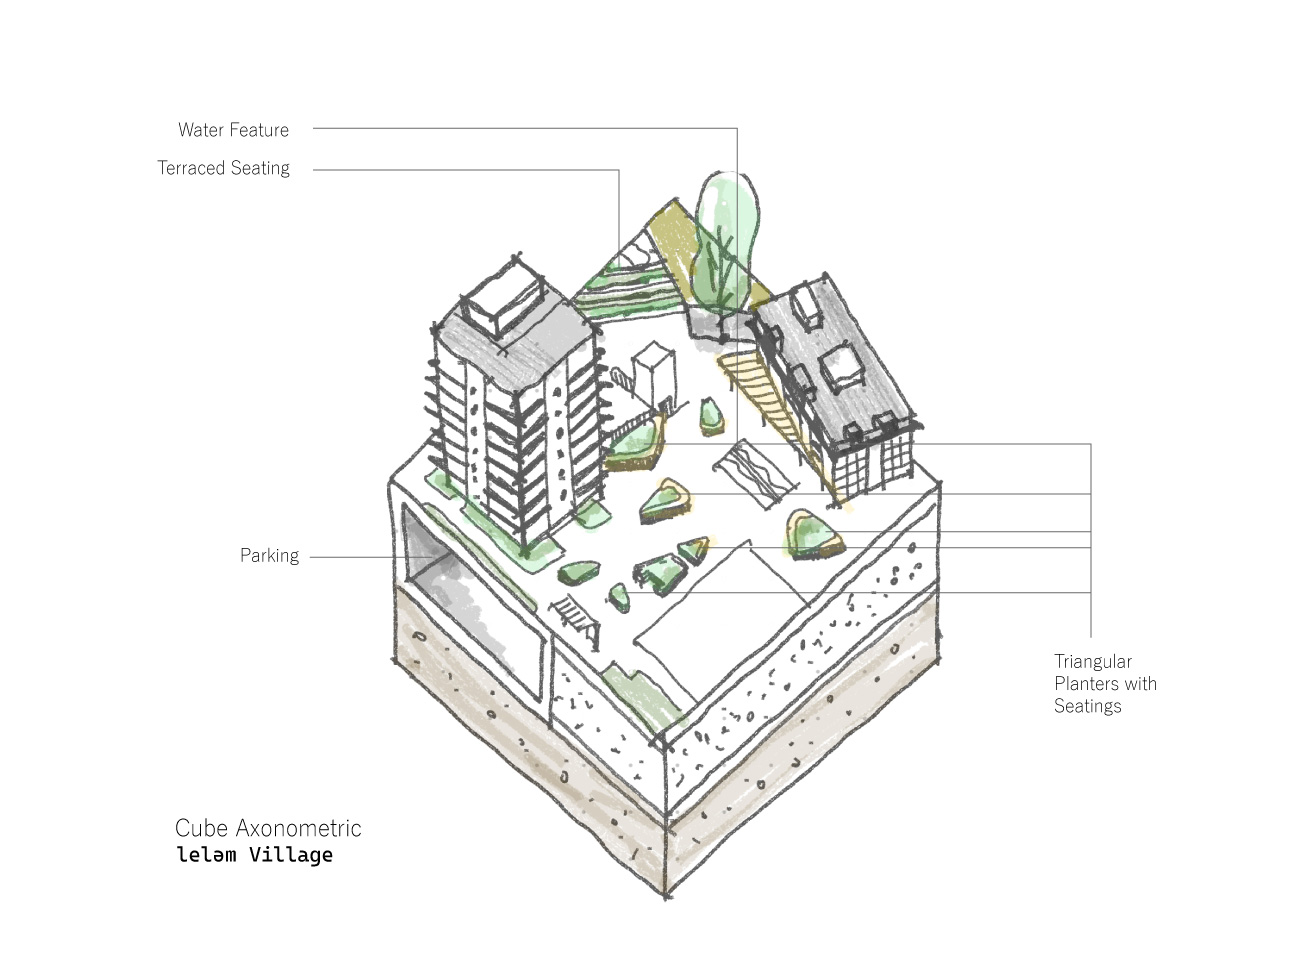
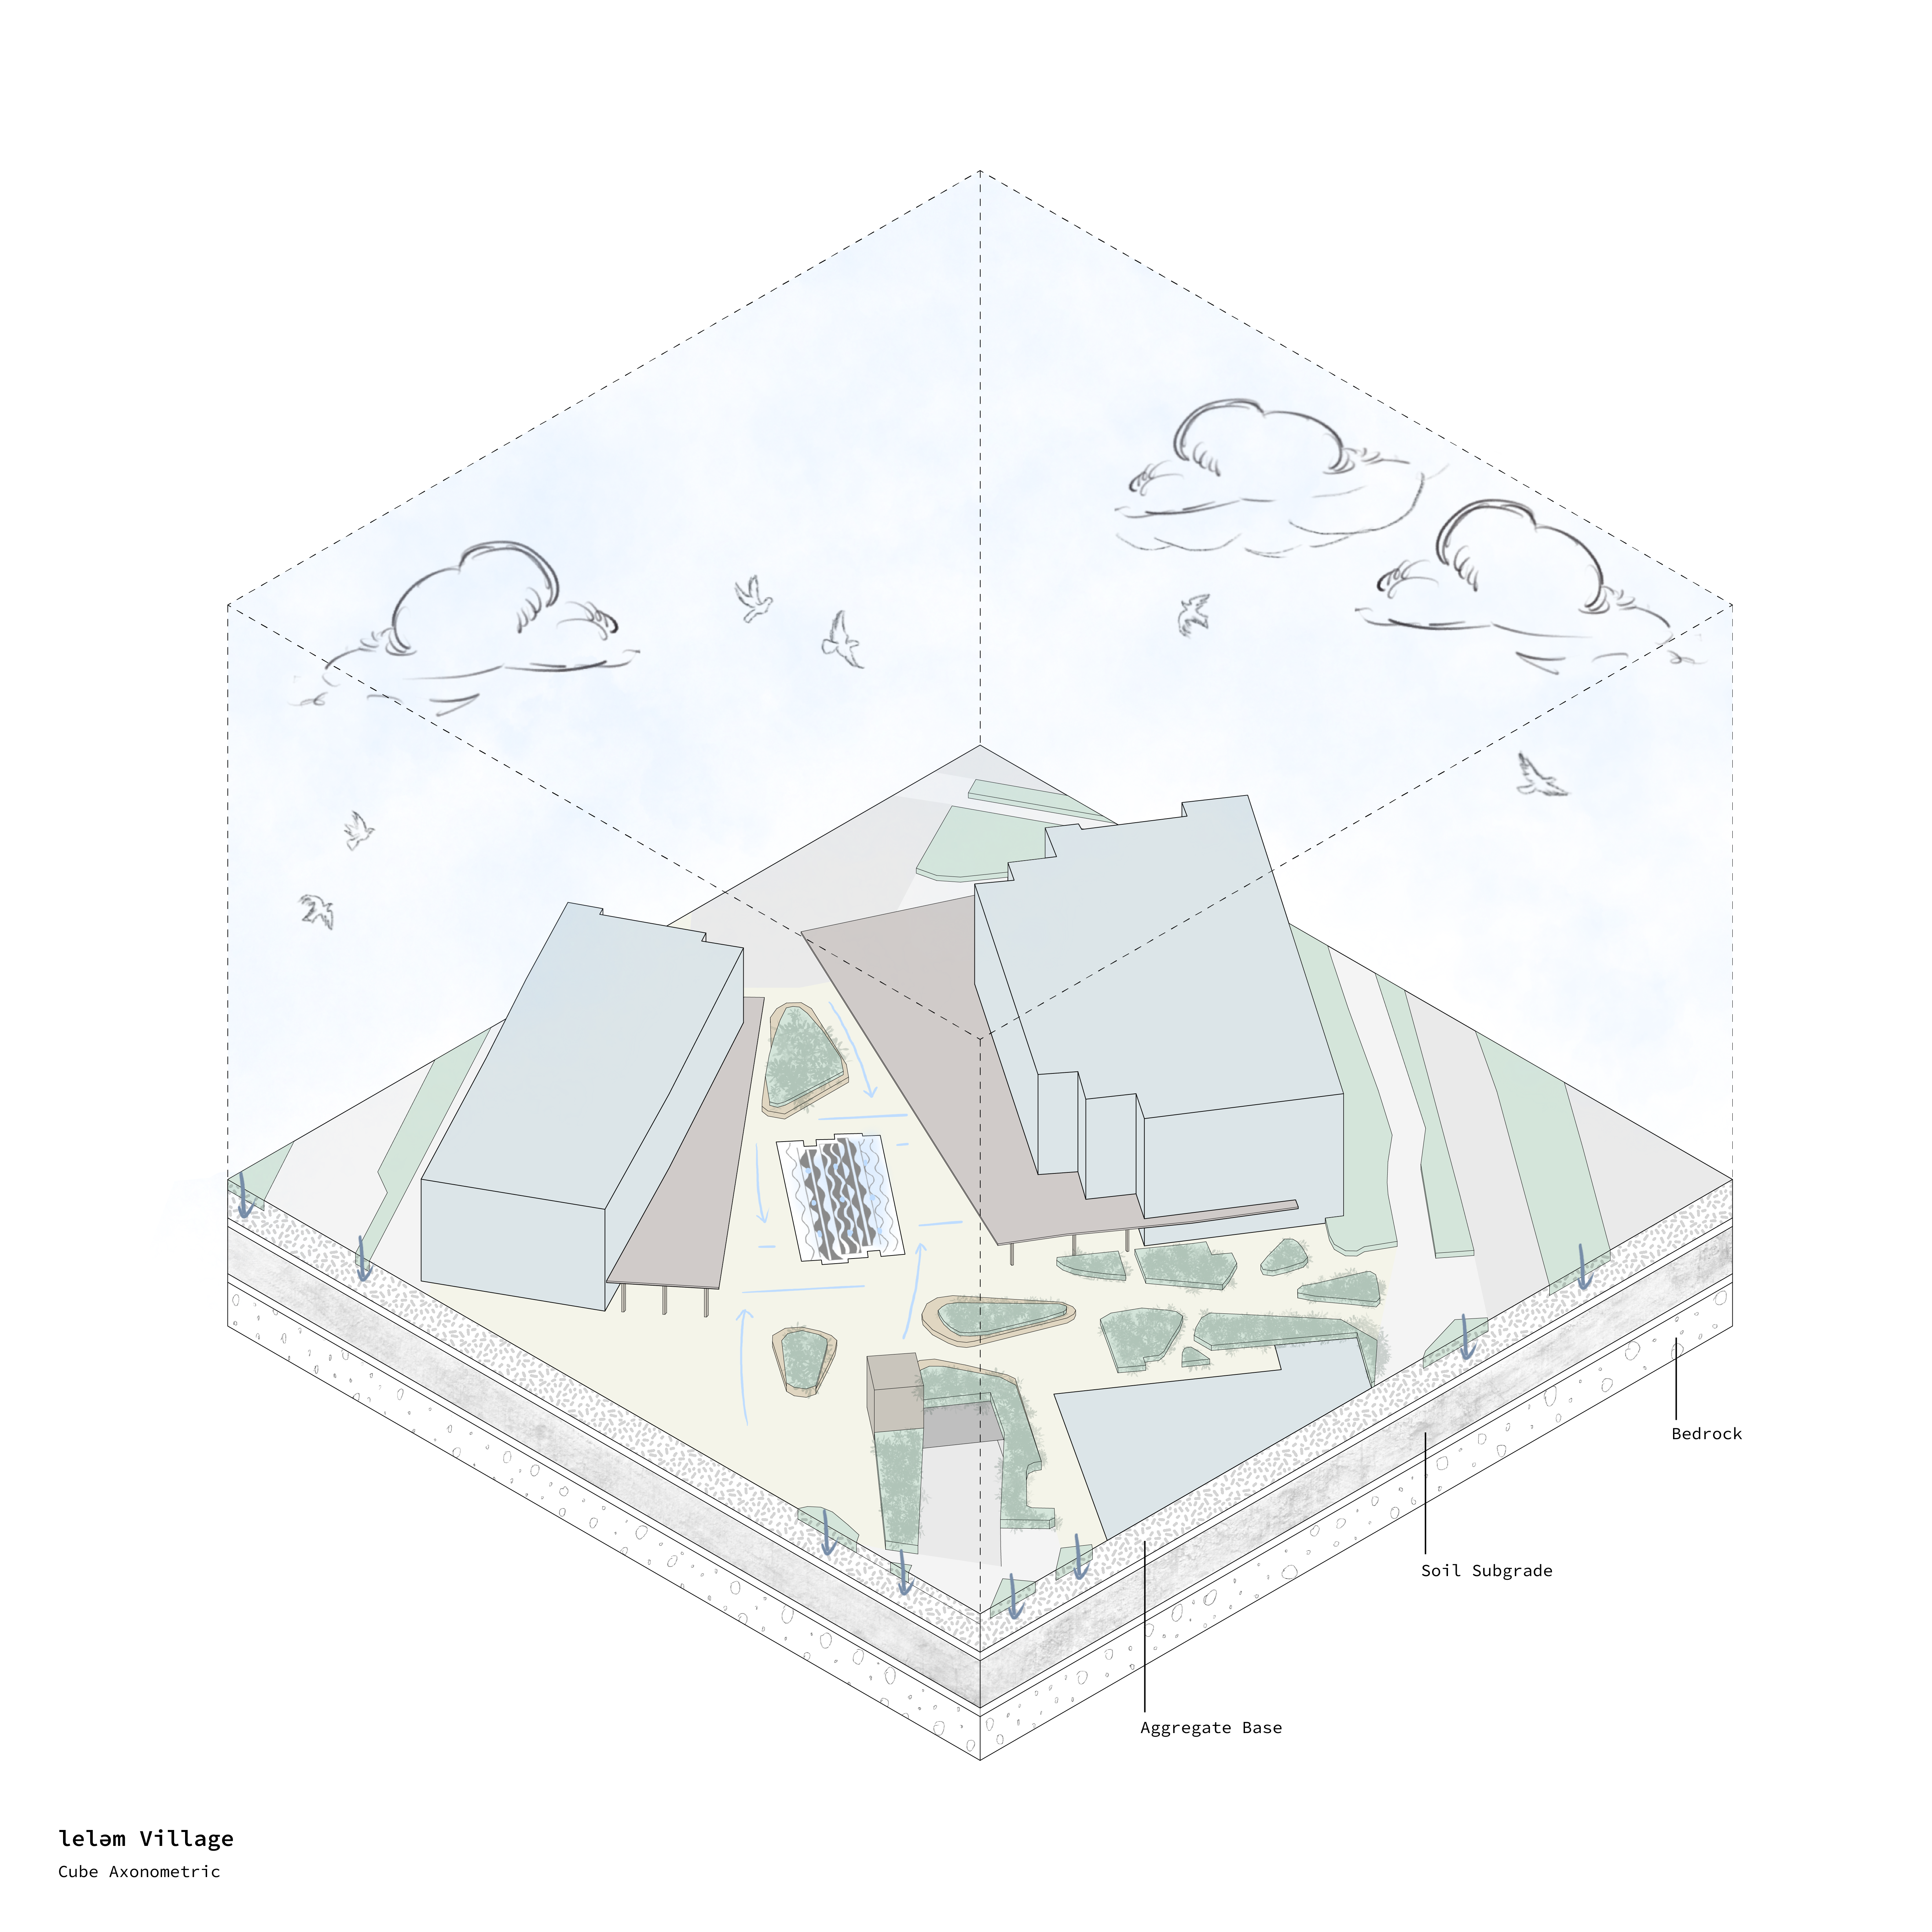
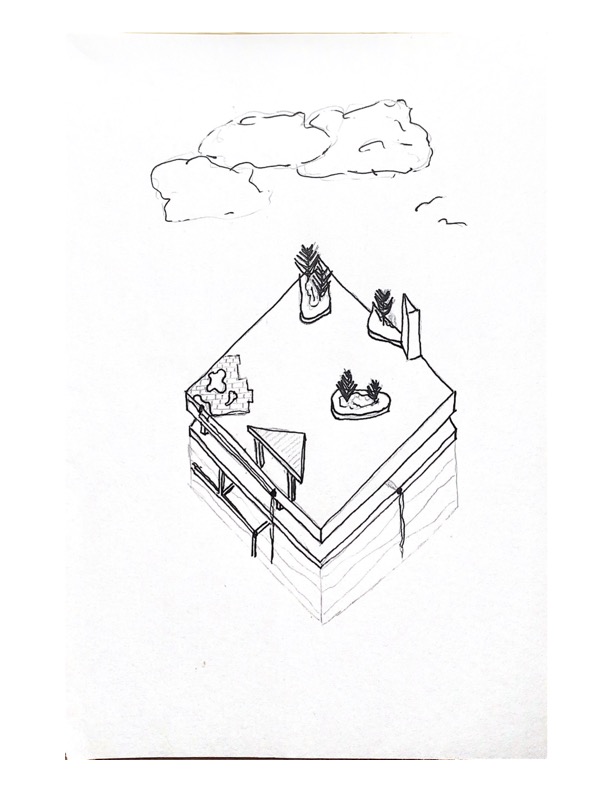 AI Axo cube drawing was made using a Rhino model, hand sketching/tracing, and Vizcom AI. The prompts used are on the final Axo drawing above.
ASSIGNMENT 2 – FABIEN KWAN


A02 – Freya Savage
A2 – Arevik Petrosyan
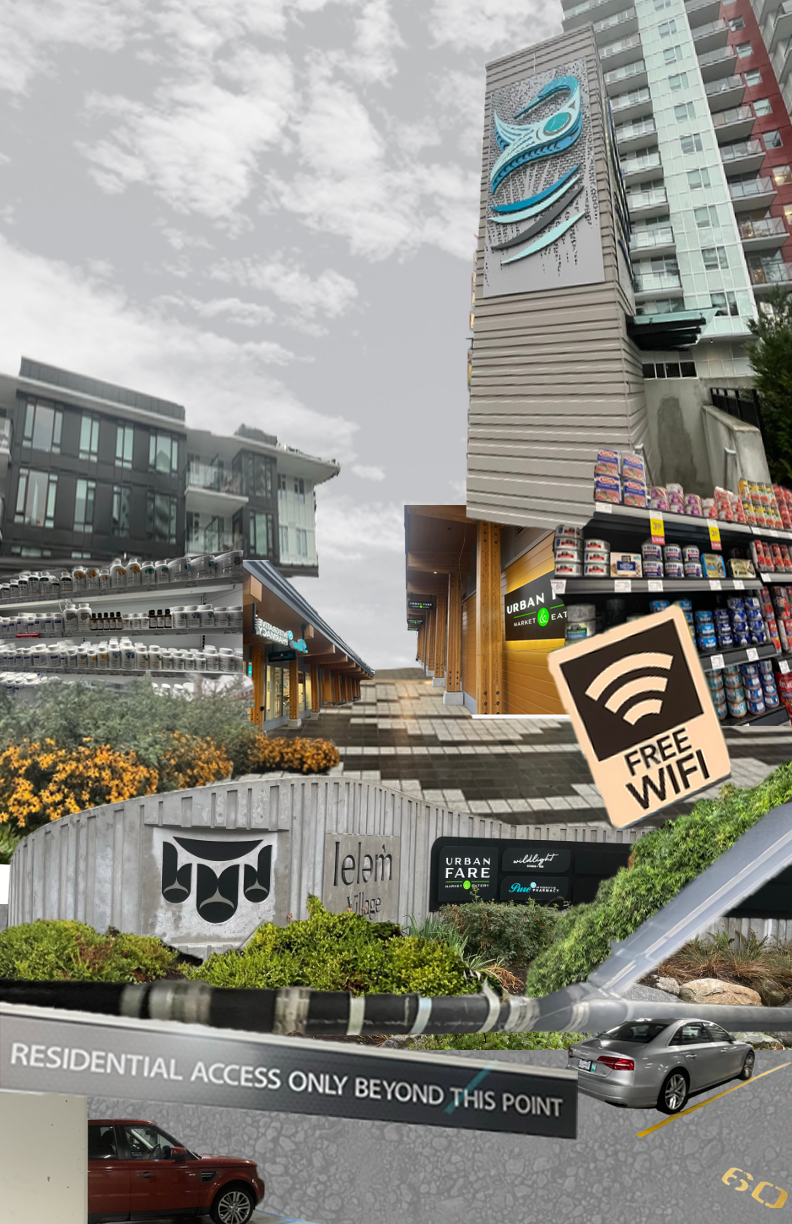
My analysis focuses on cellular network connection on site.


Assignment 2 – Edita Martina Hruskovec

Assignment 2: Cube Method
Assignment 2 – Makena Smith
Assignment 2 | Sharon Cheng

Bella Gigone-Assignment 2

Assignment 2 – Cynthia San
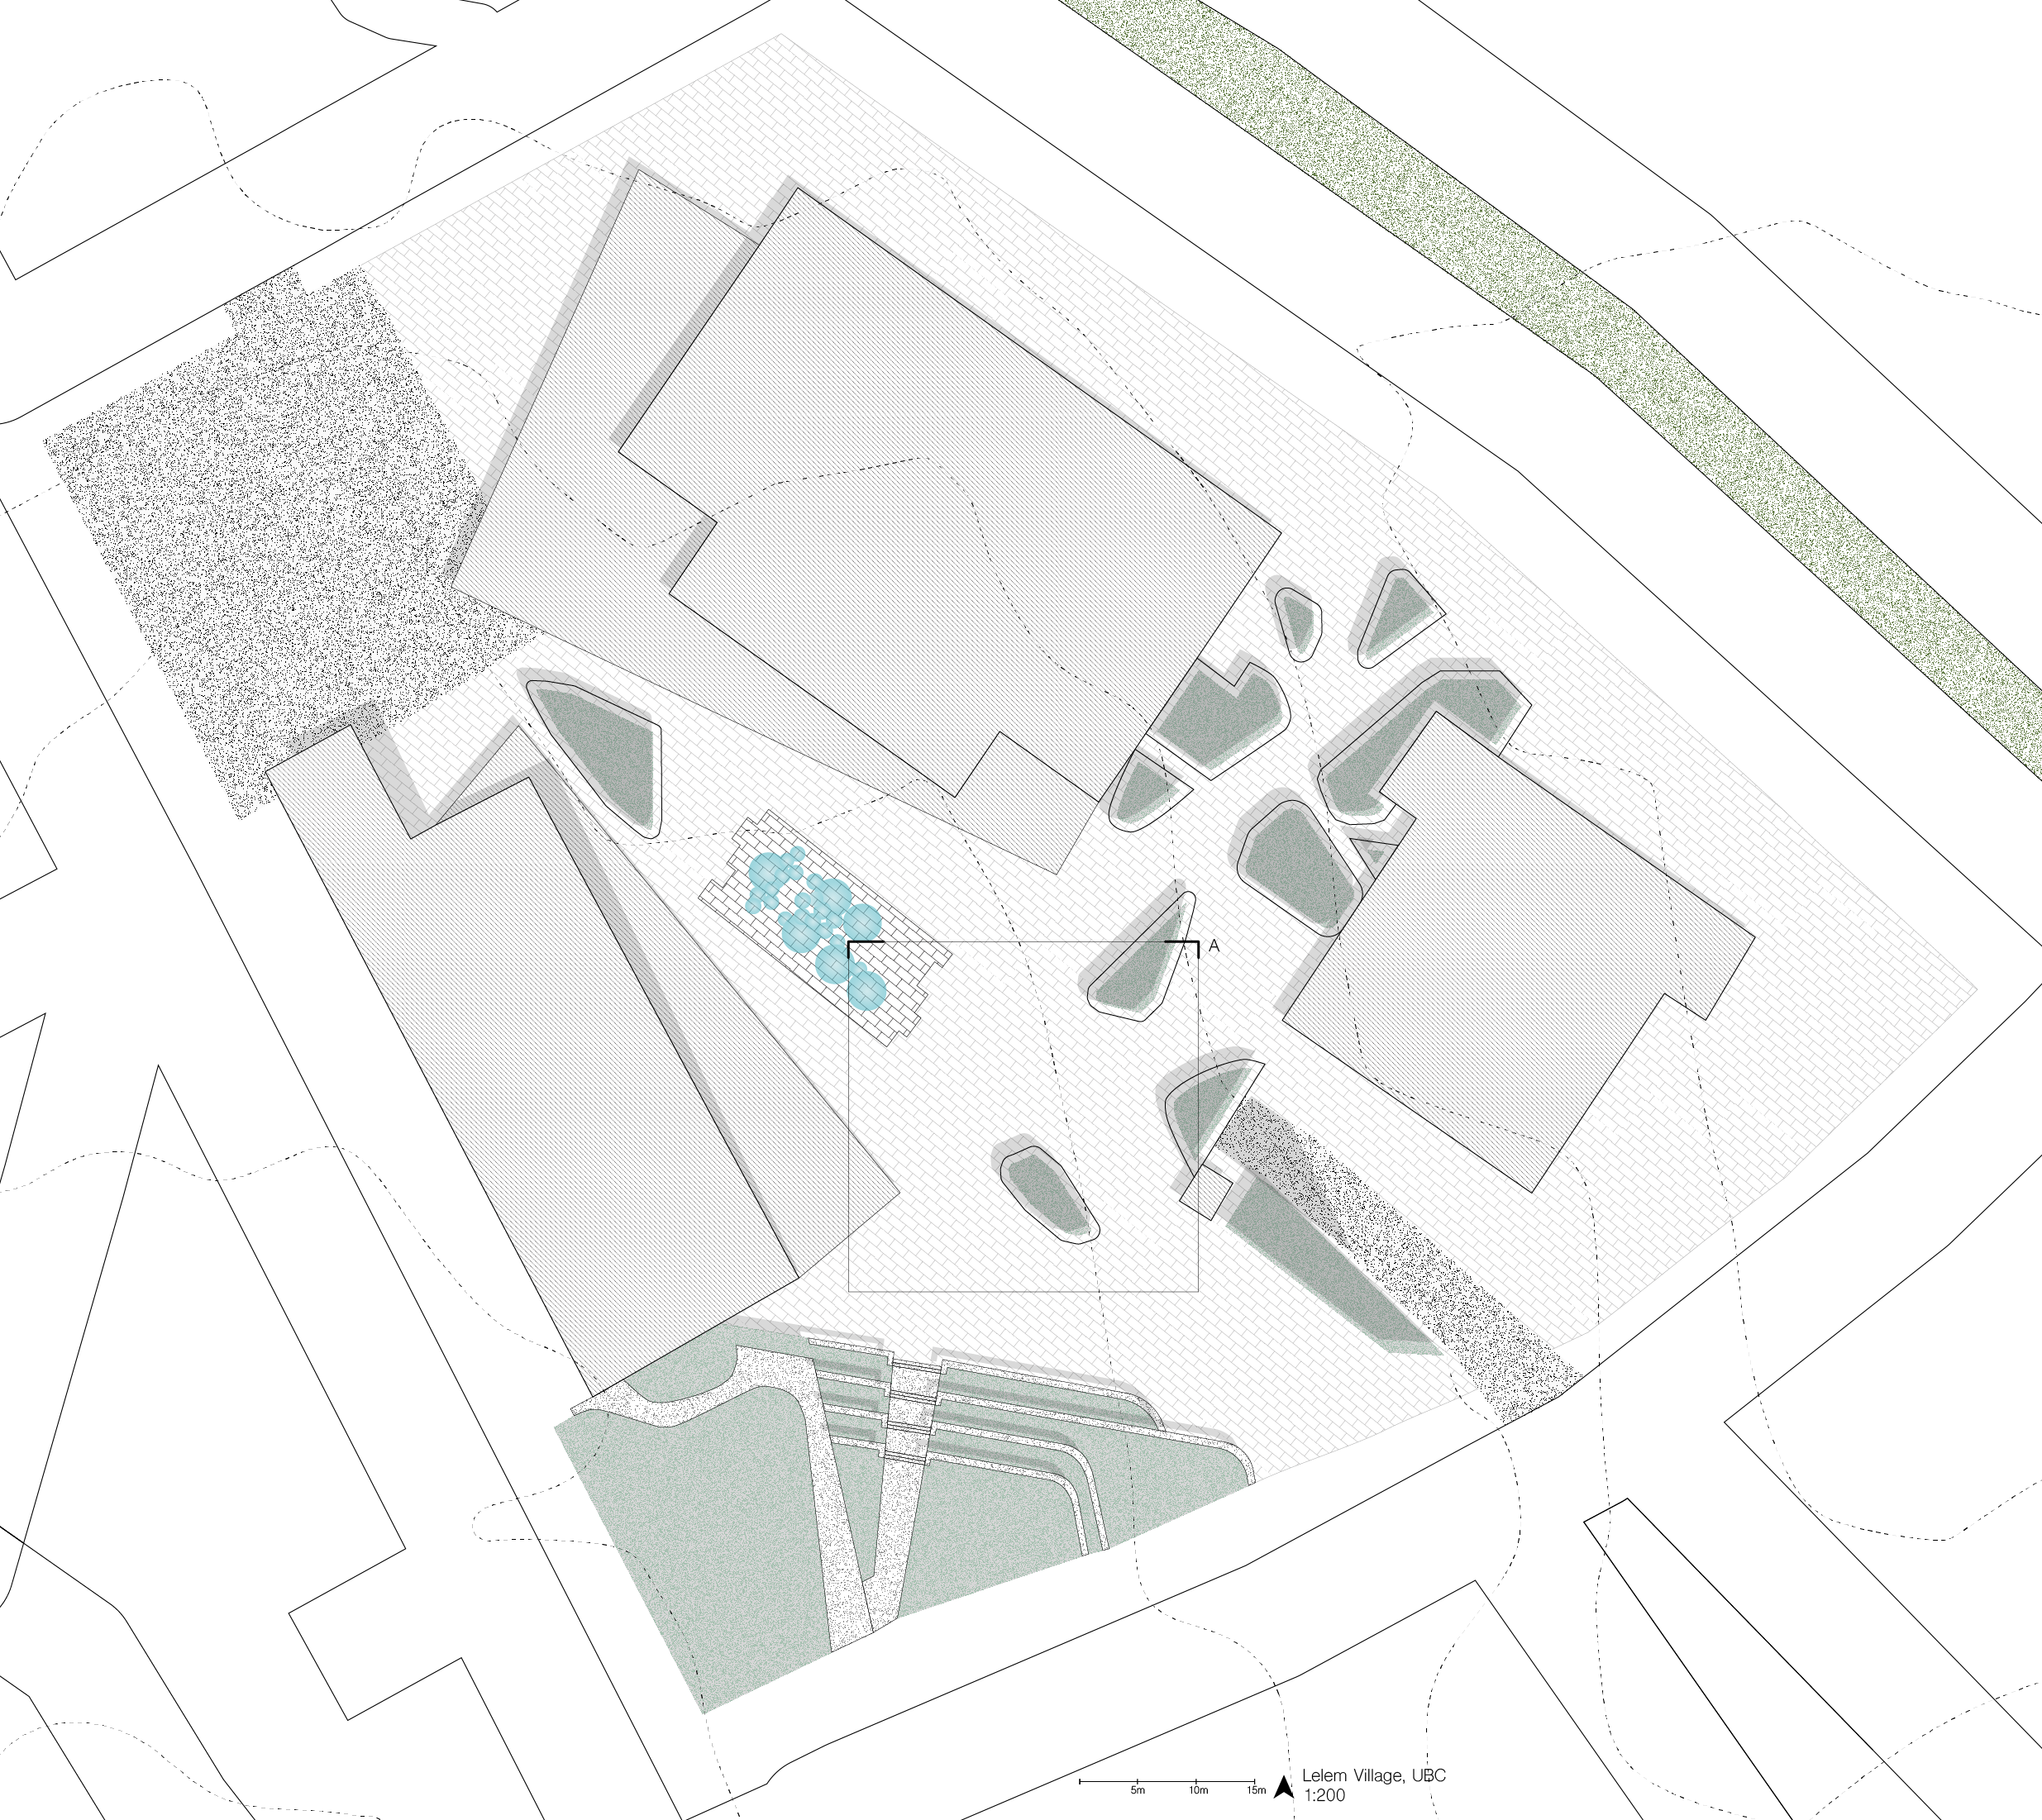
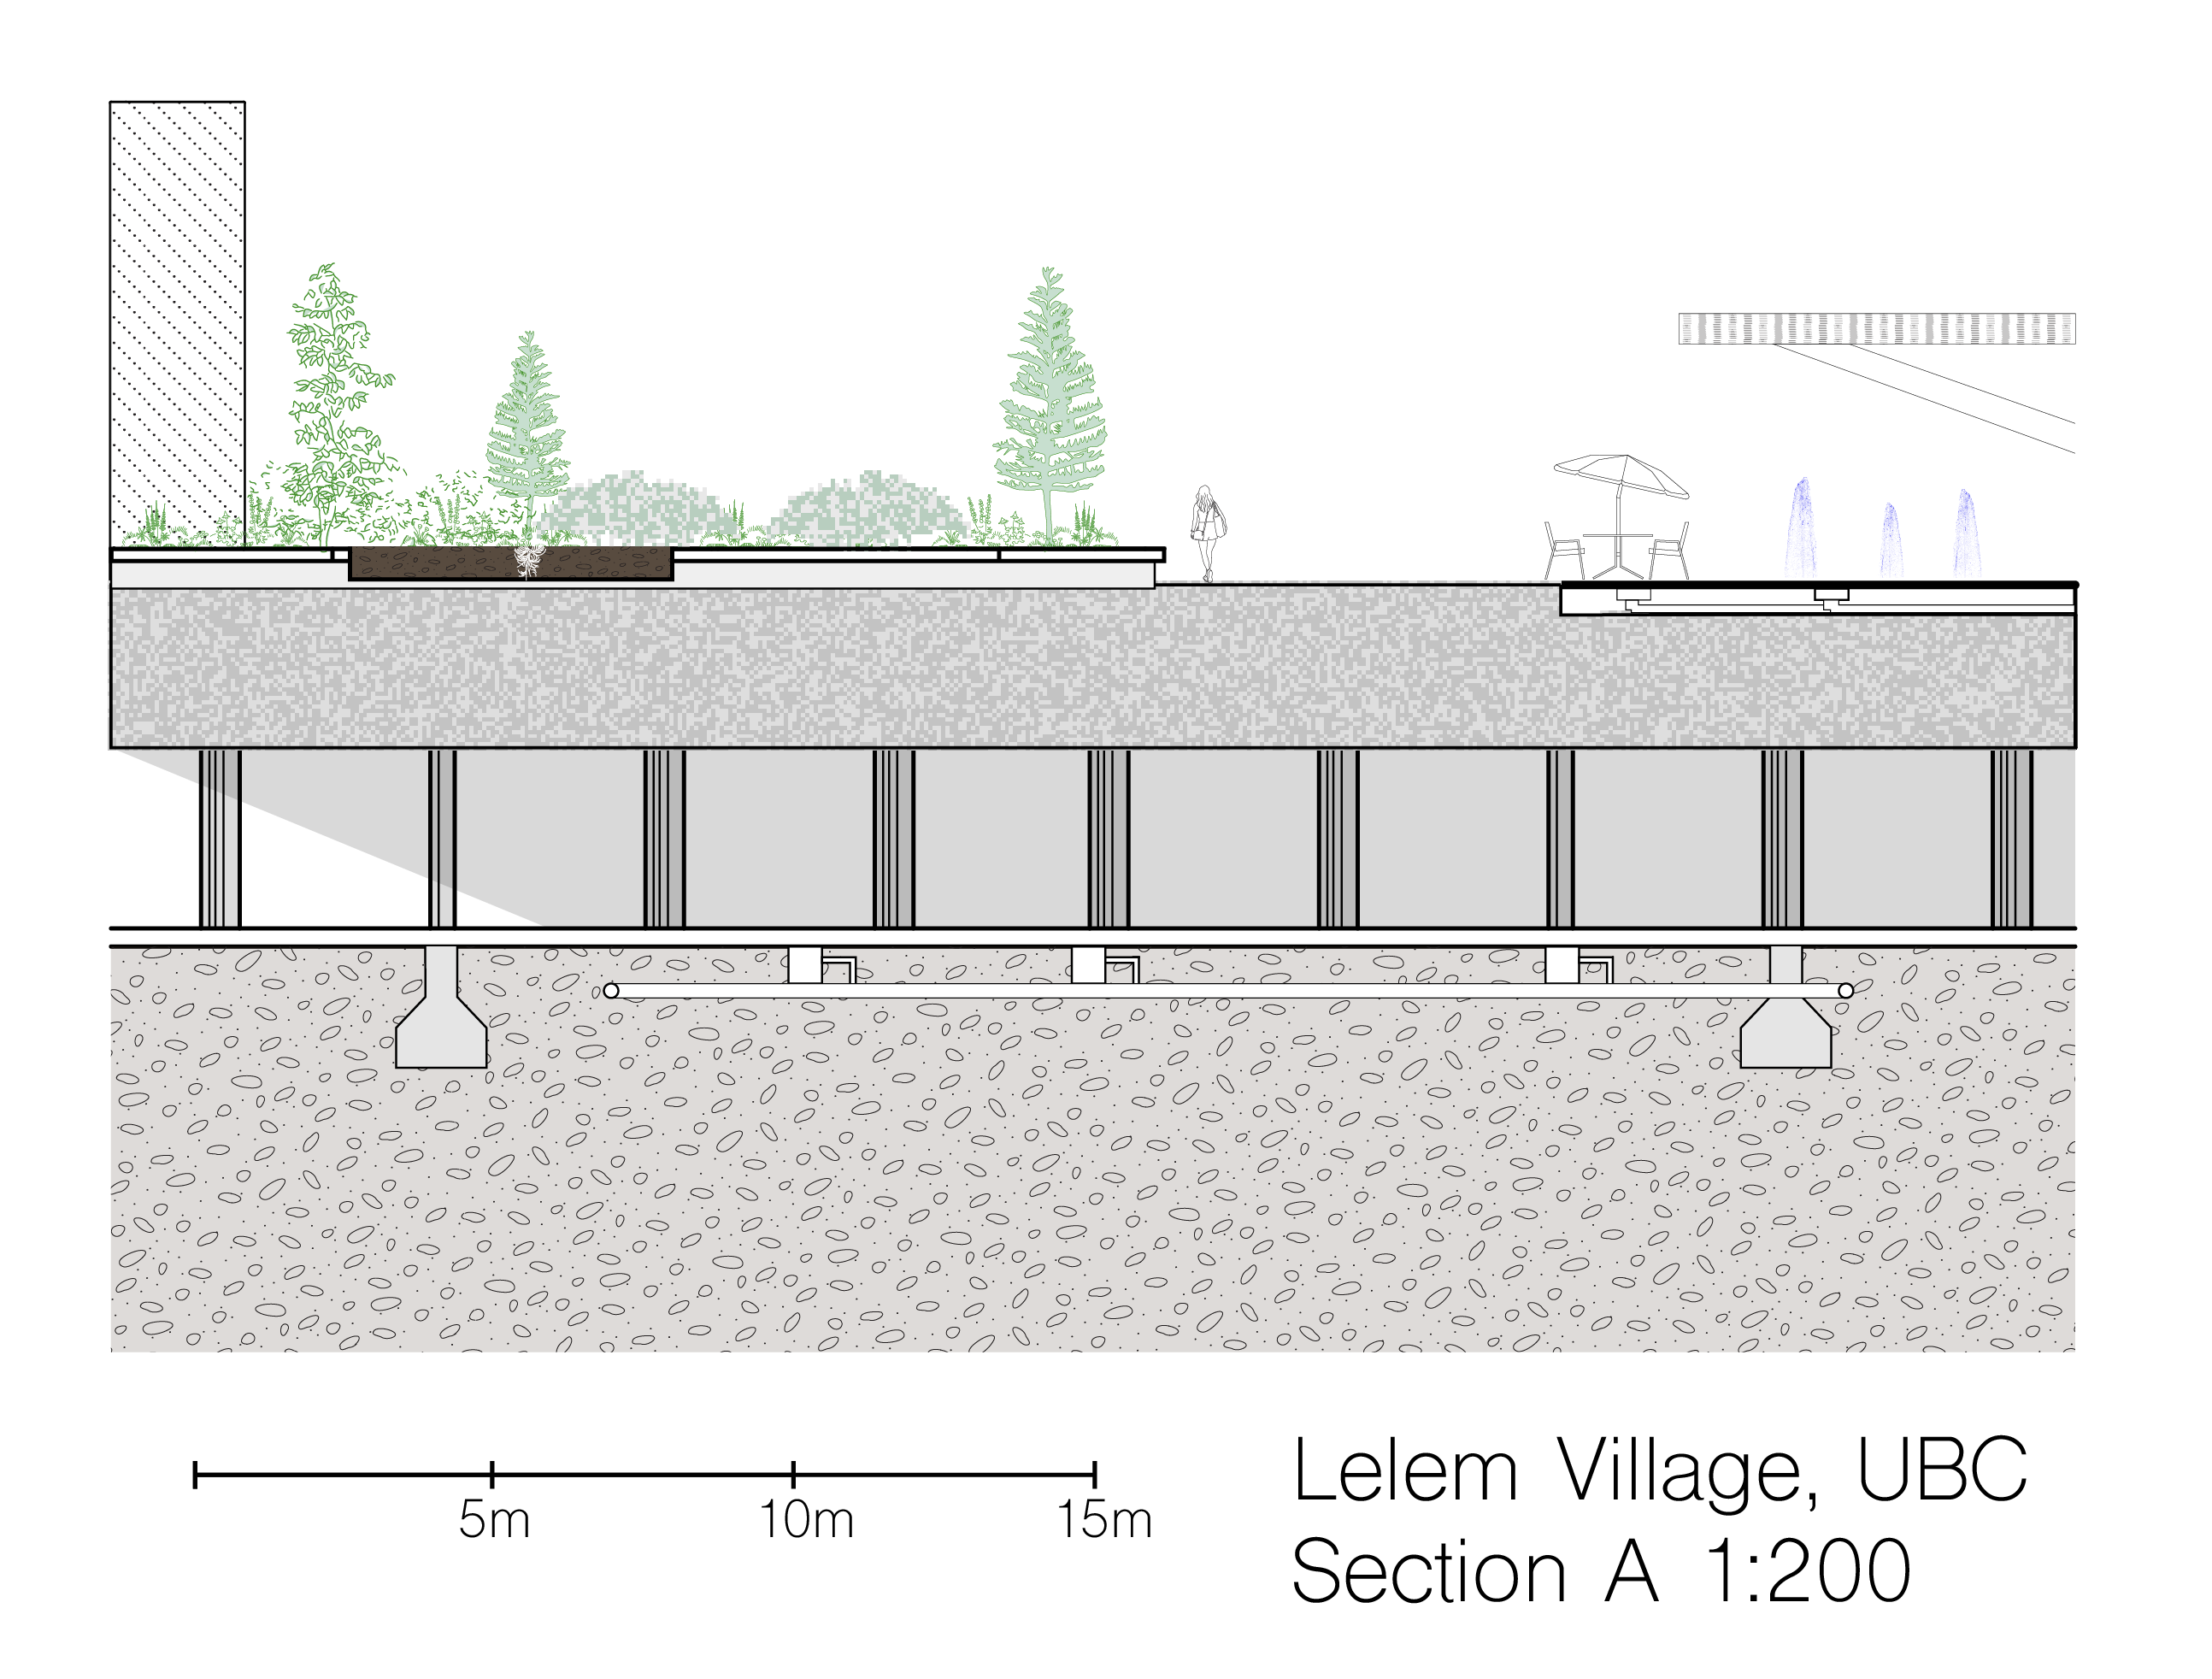
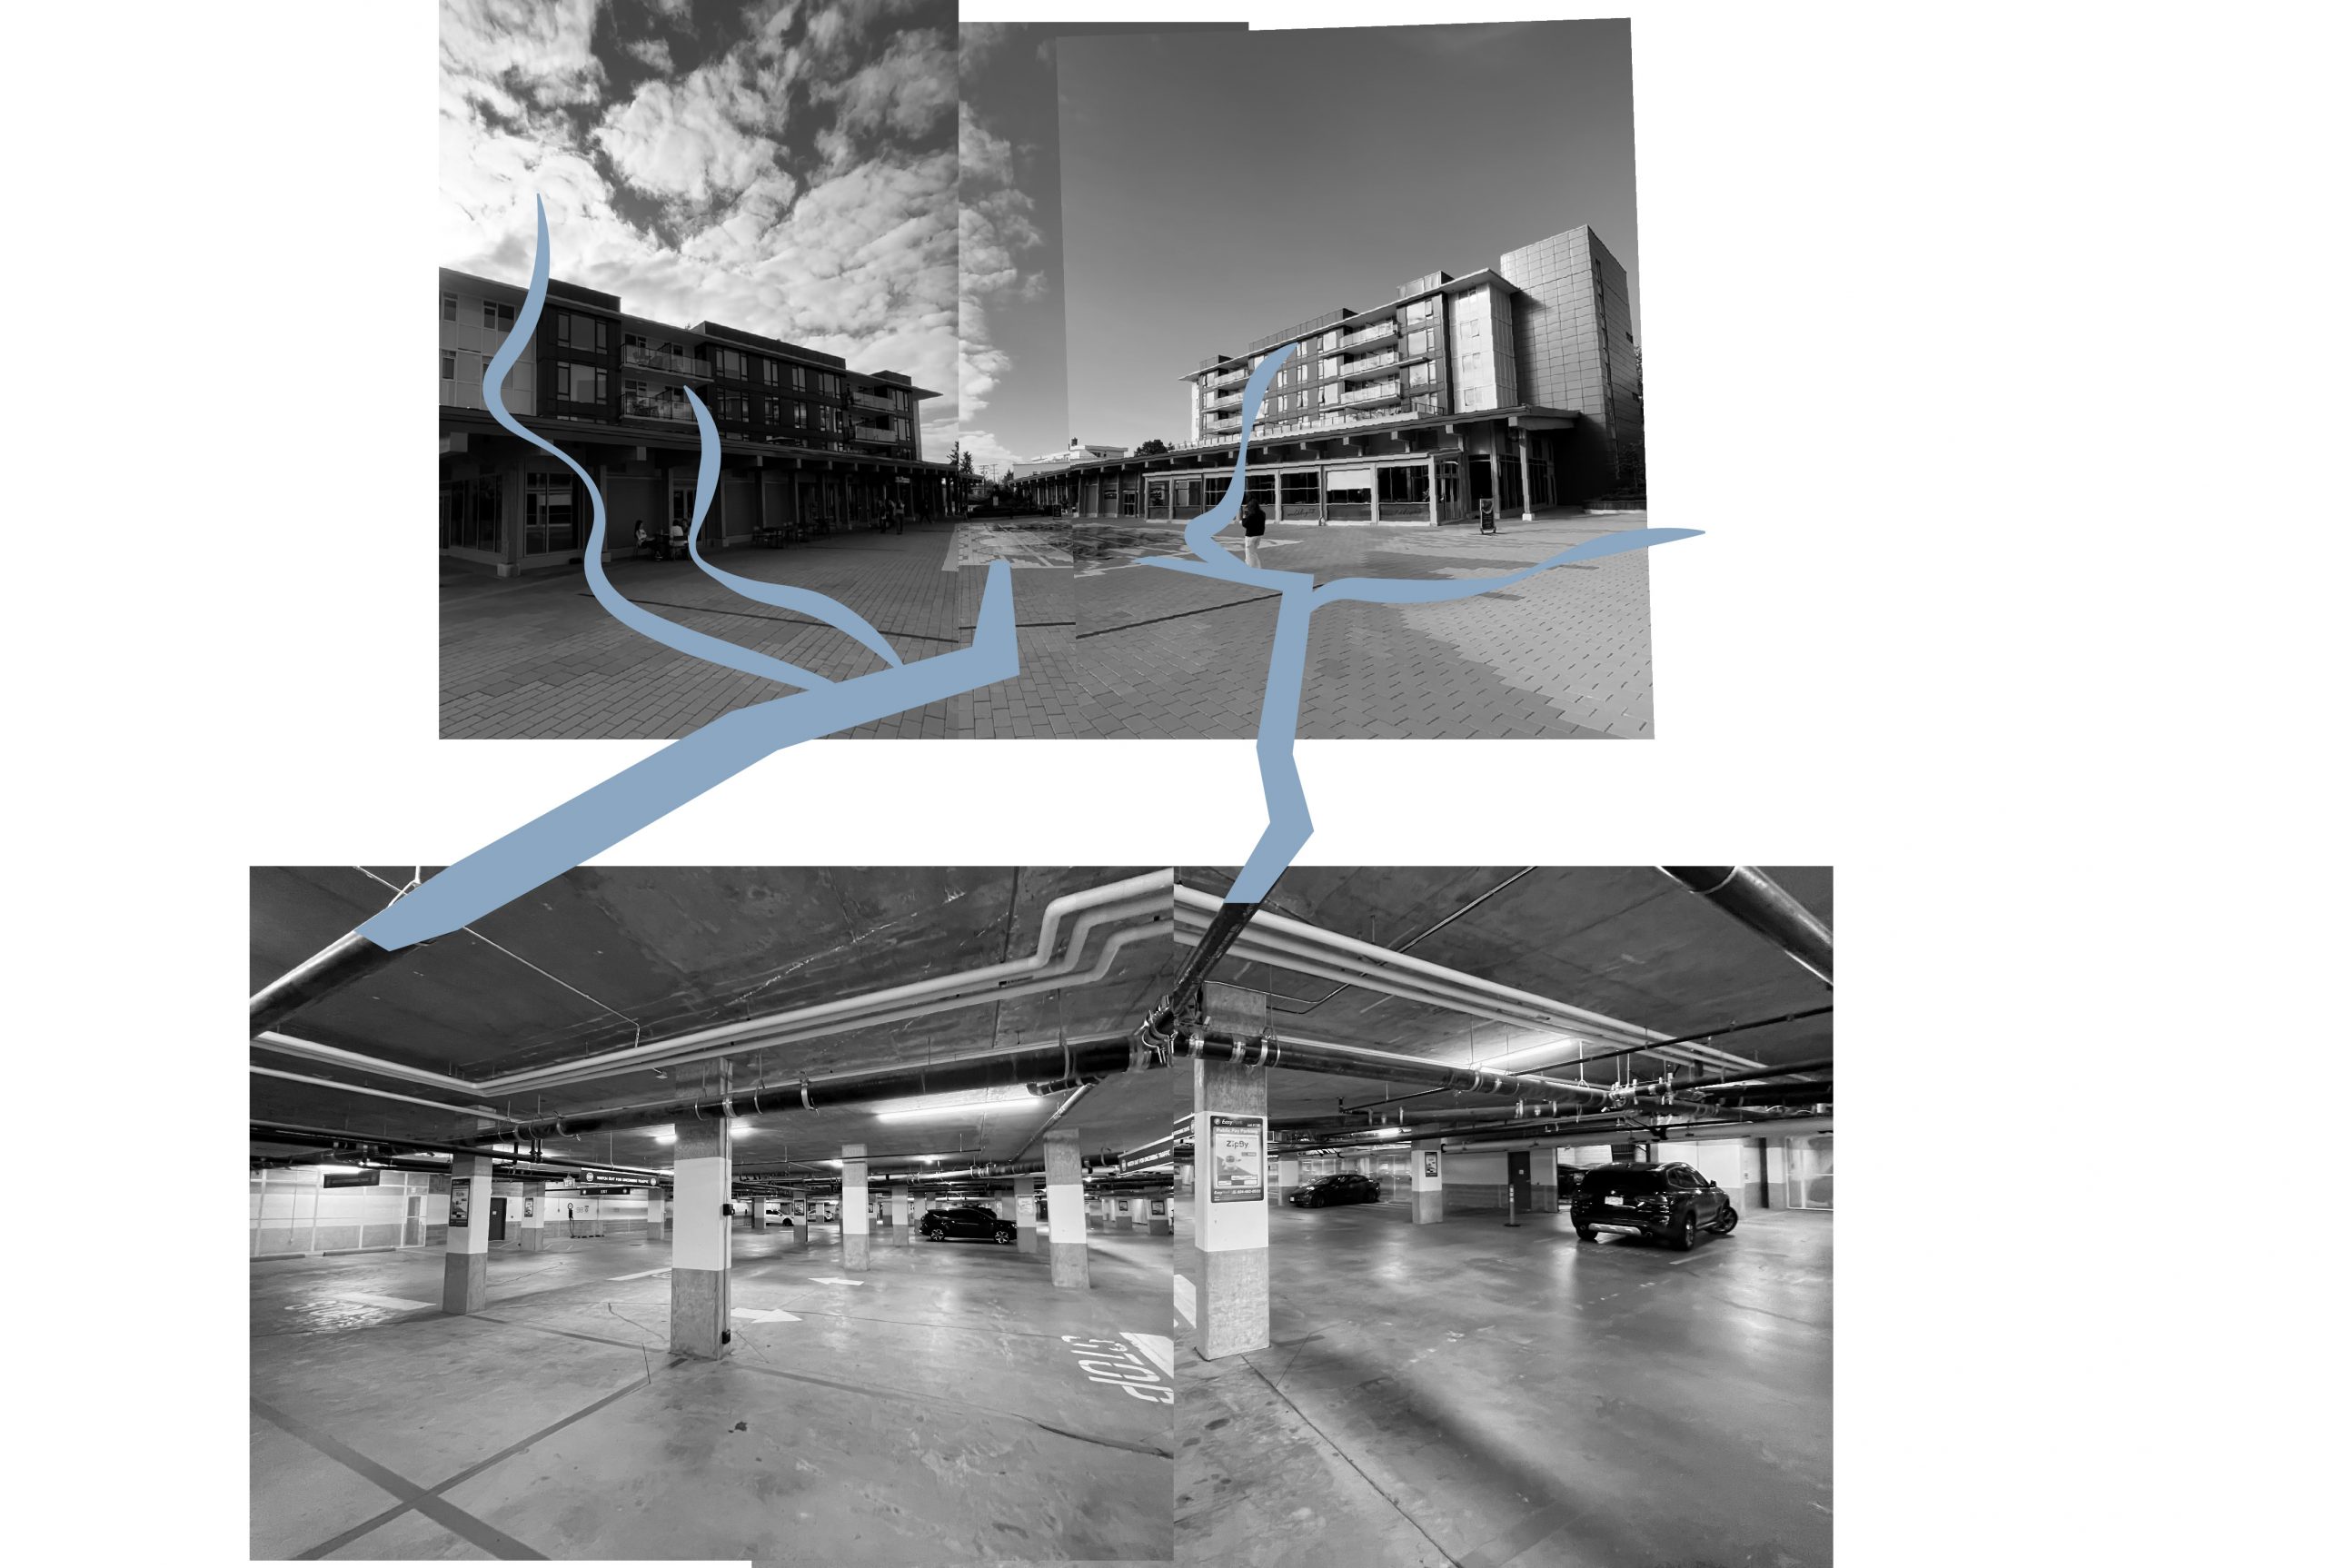
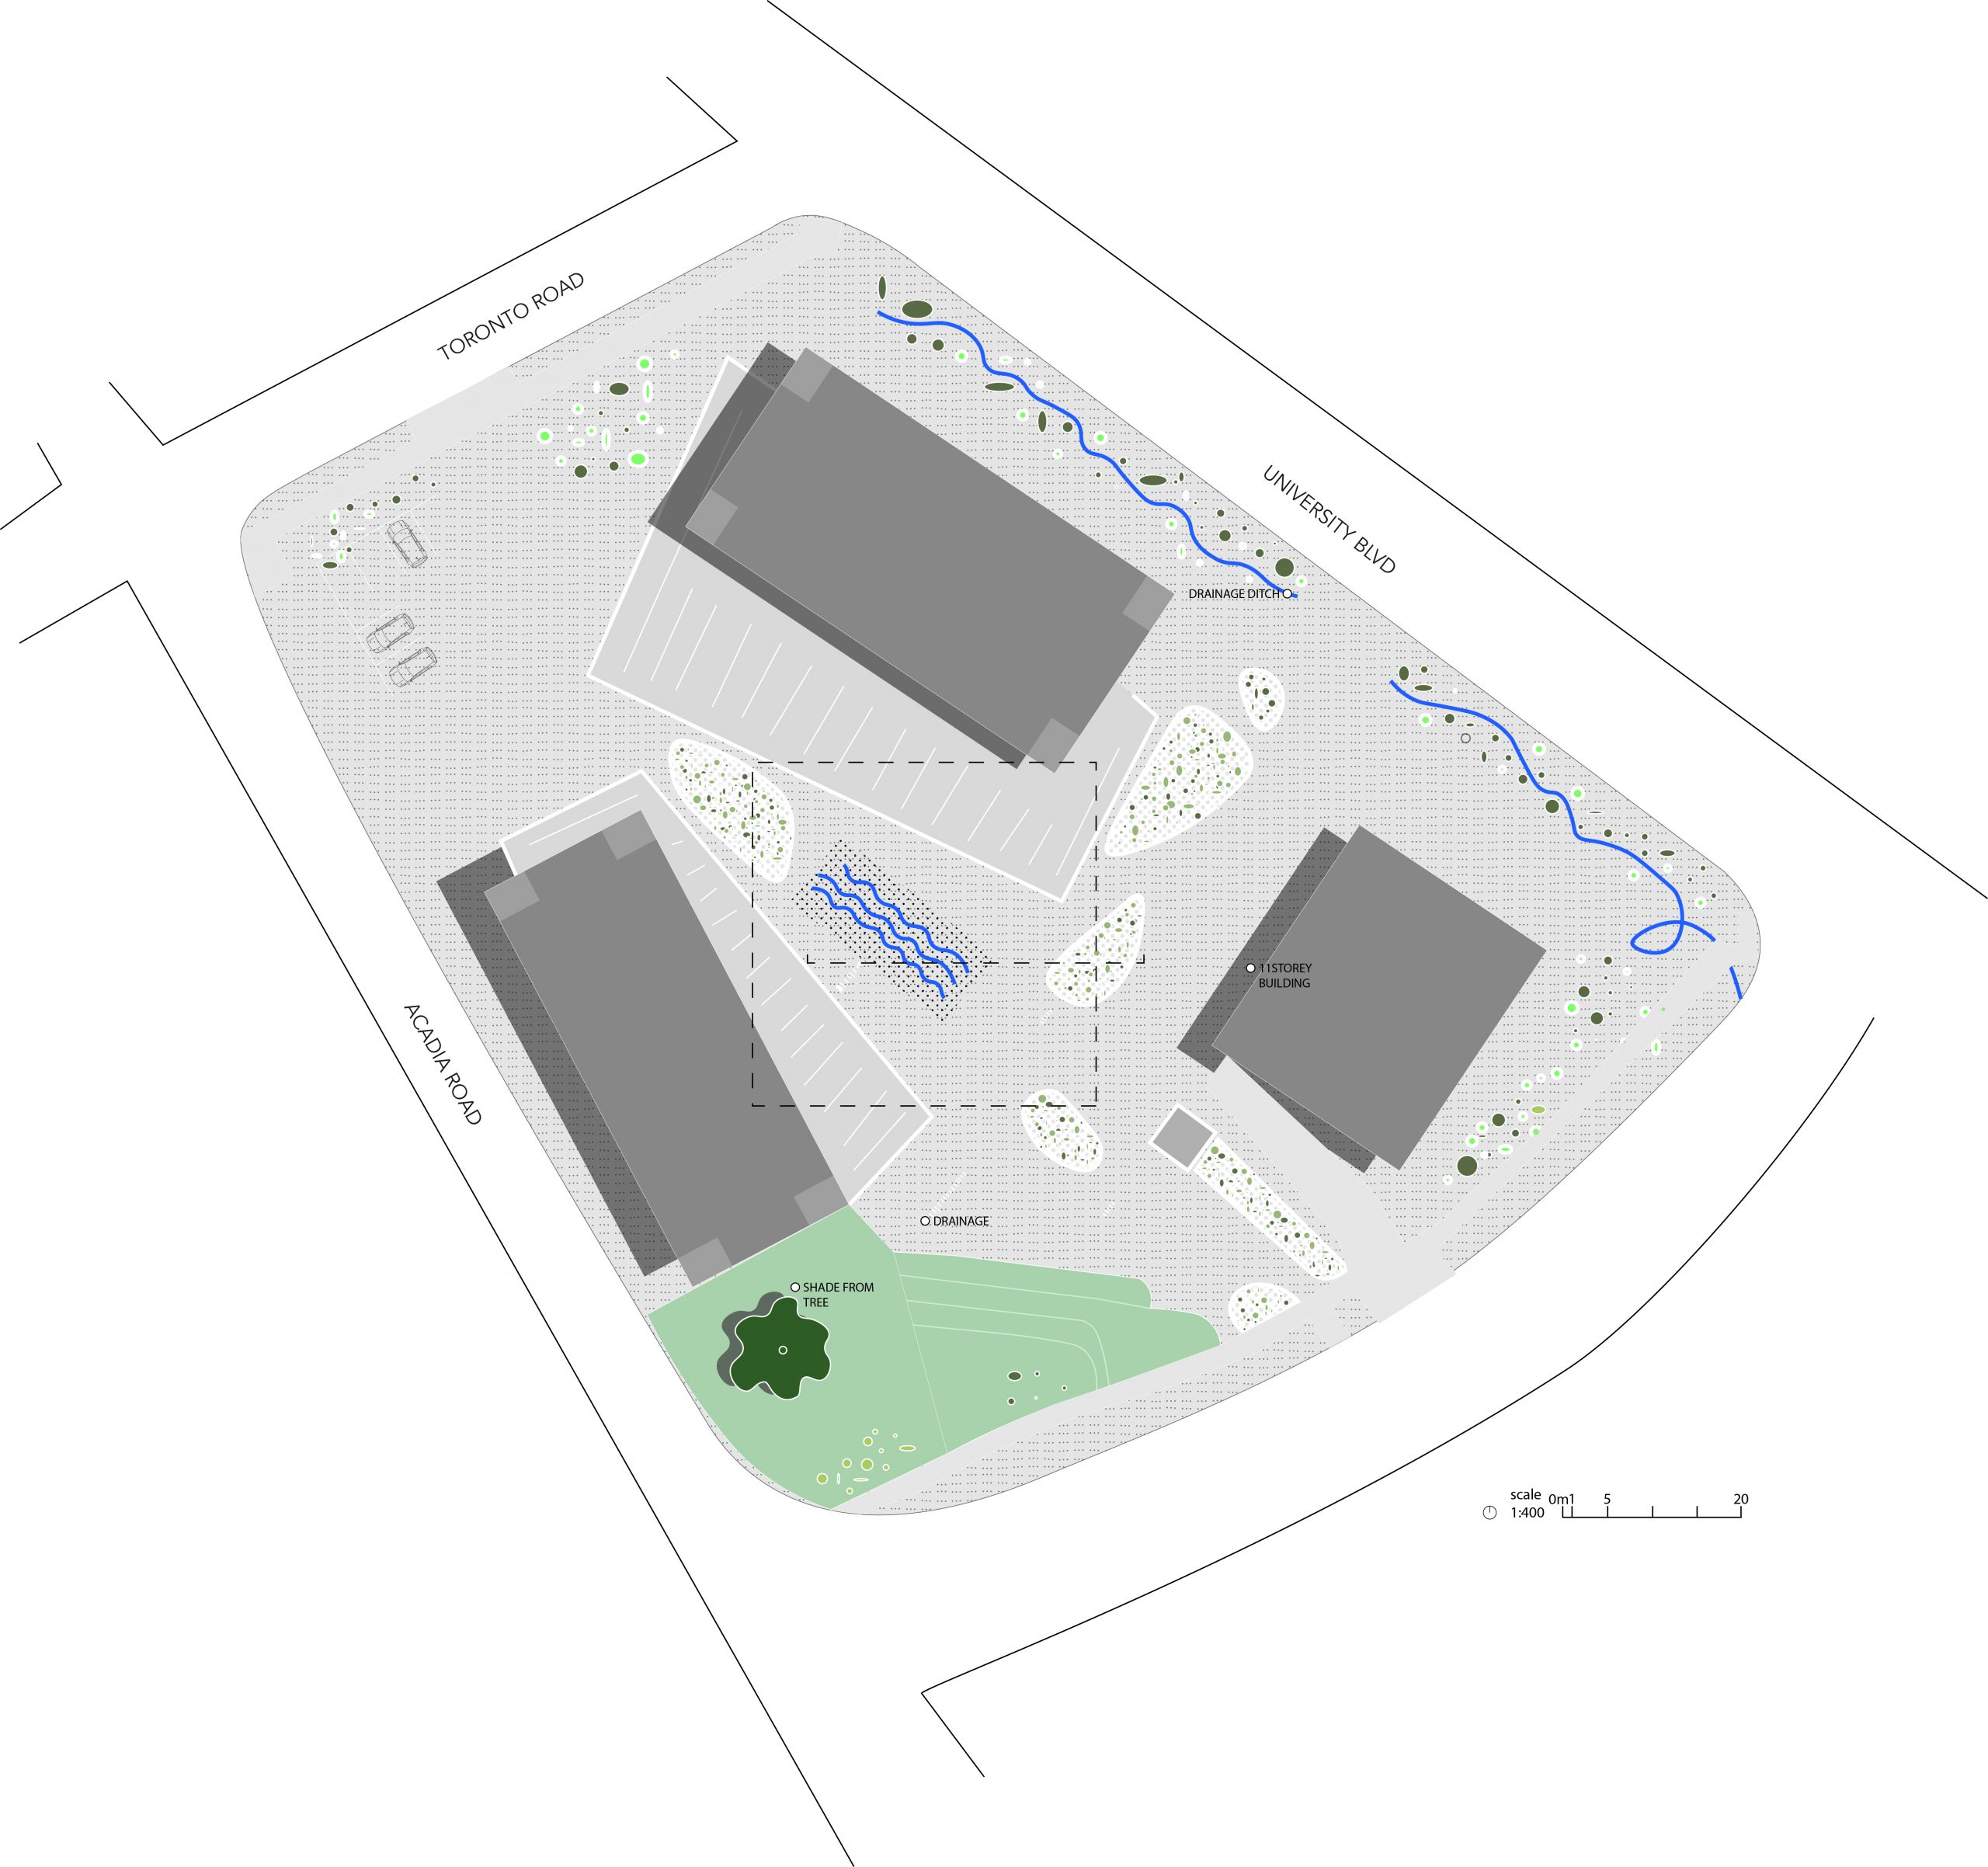
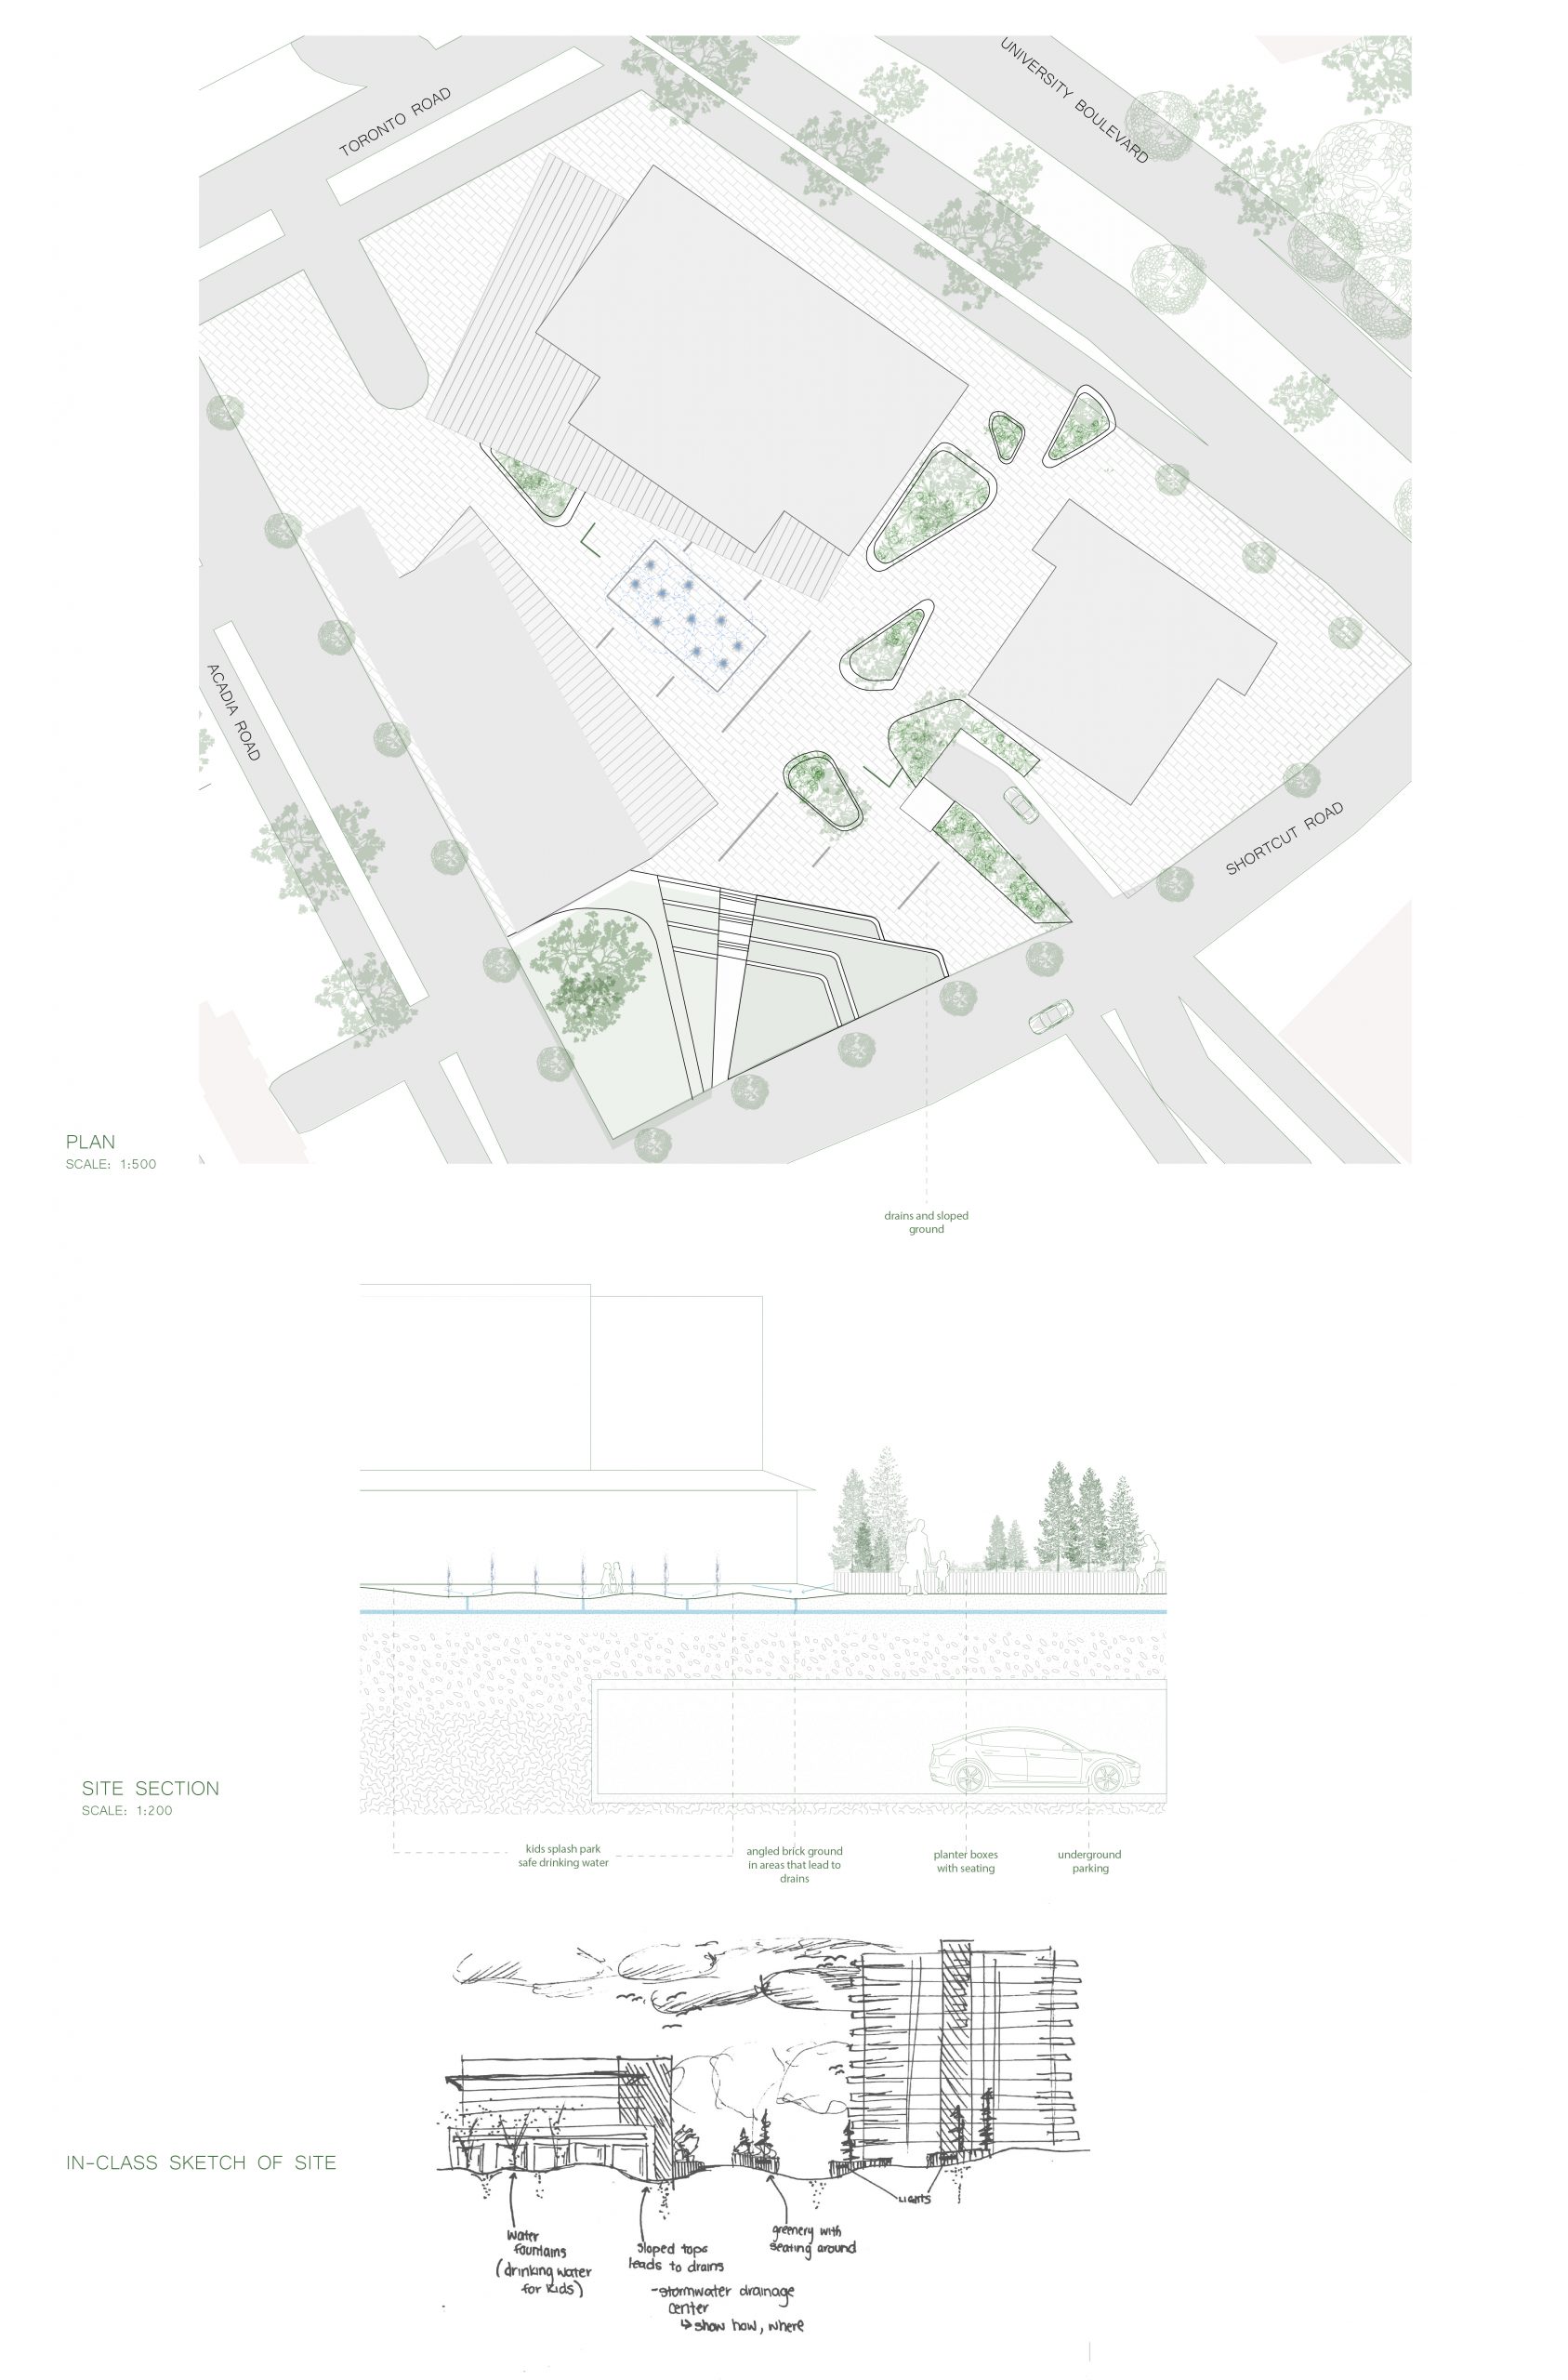
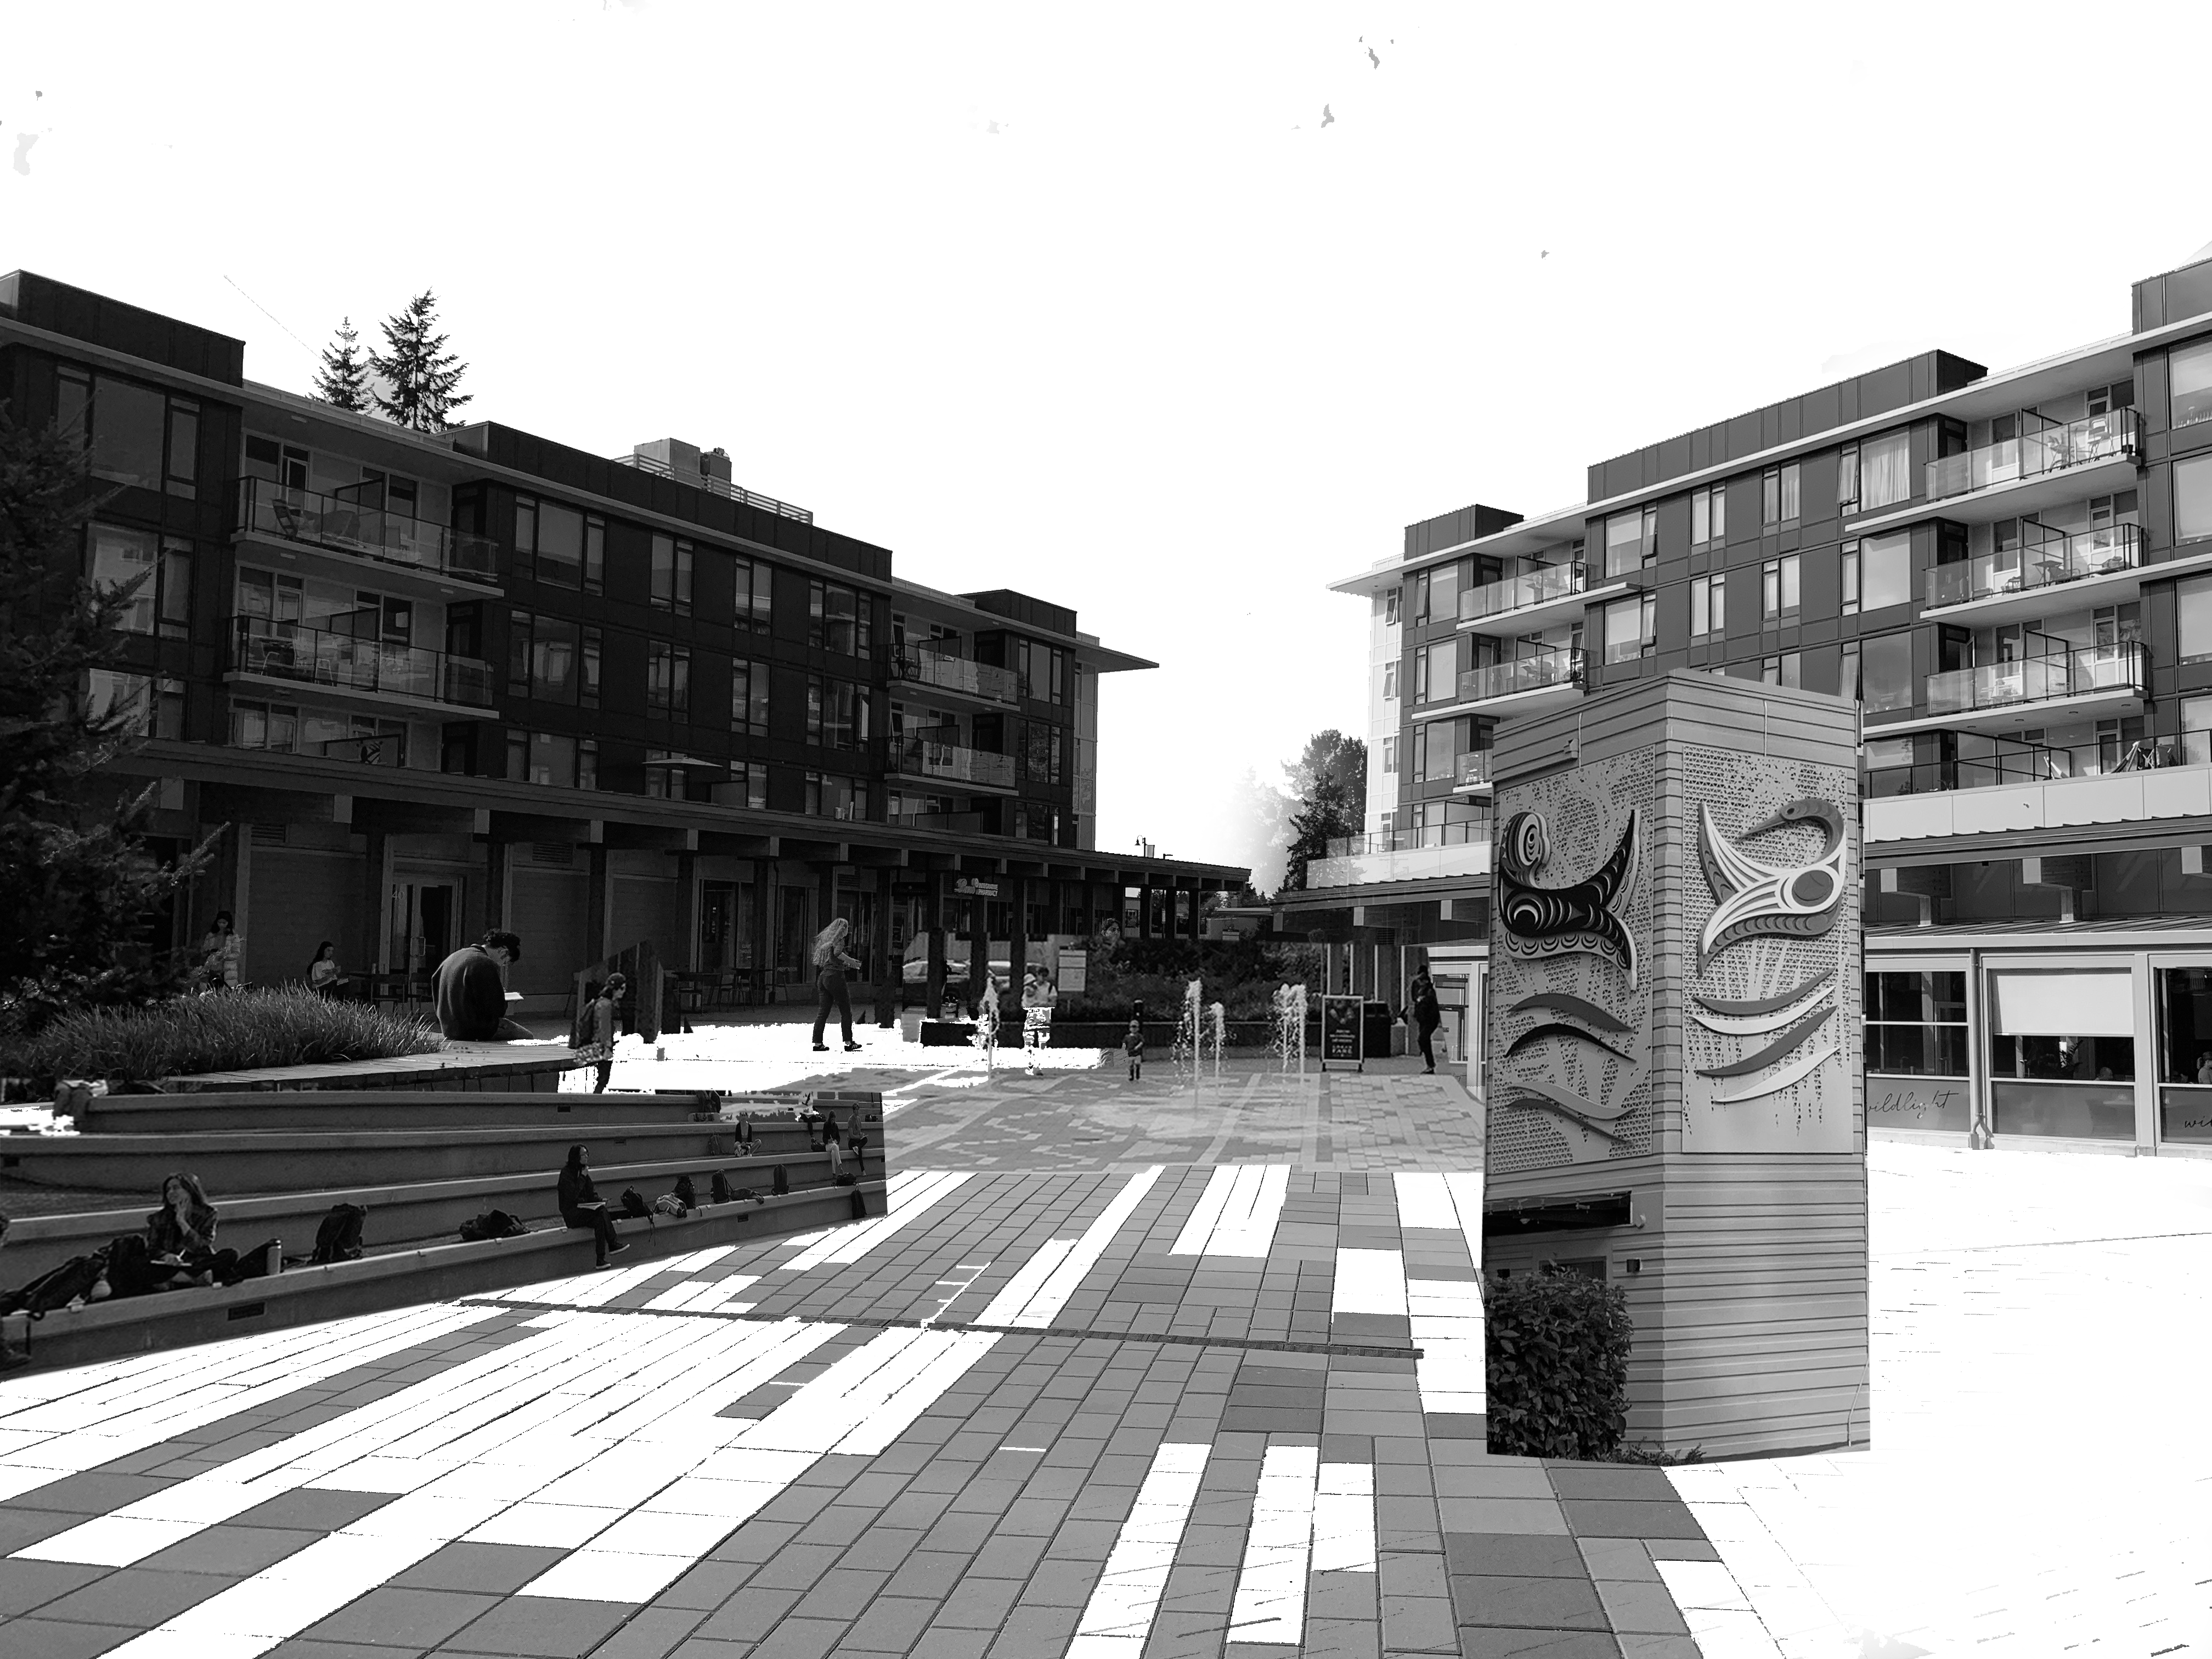
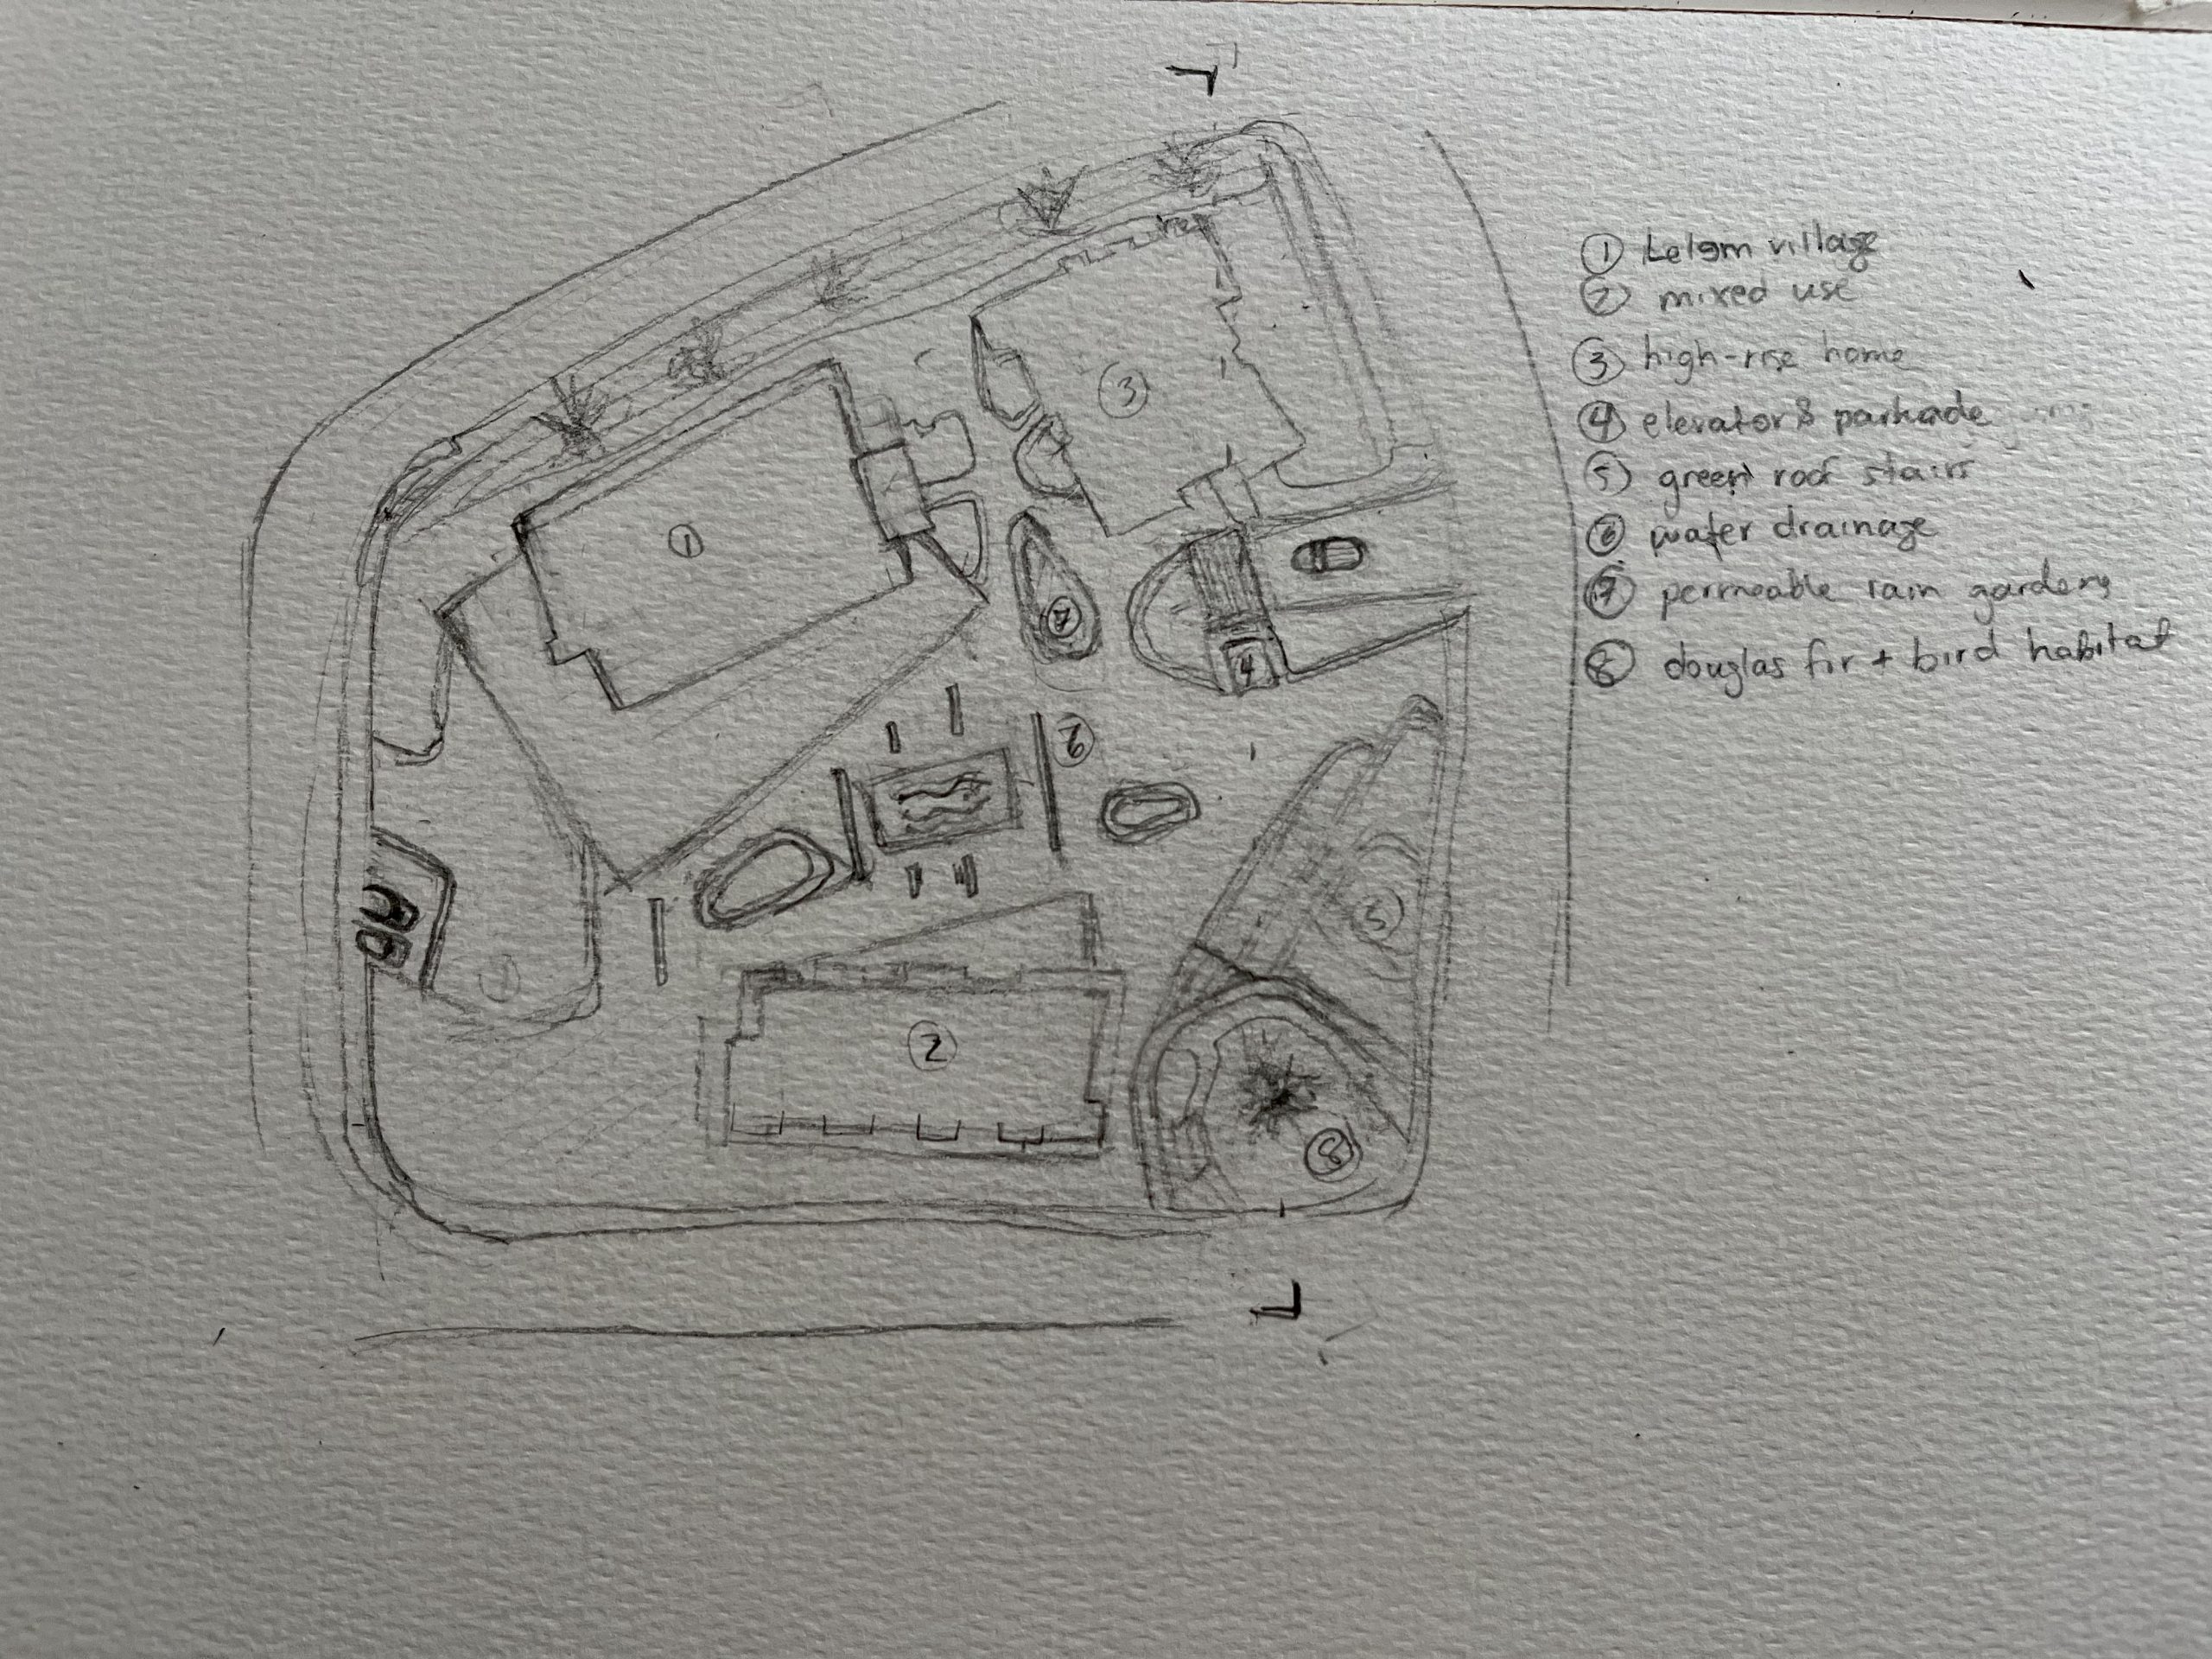
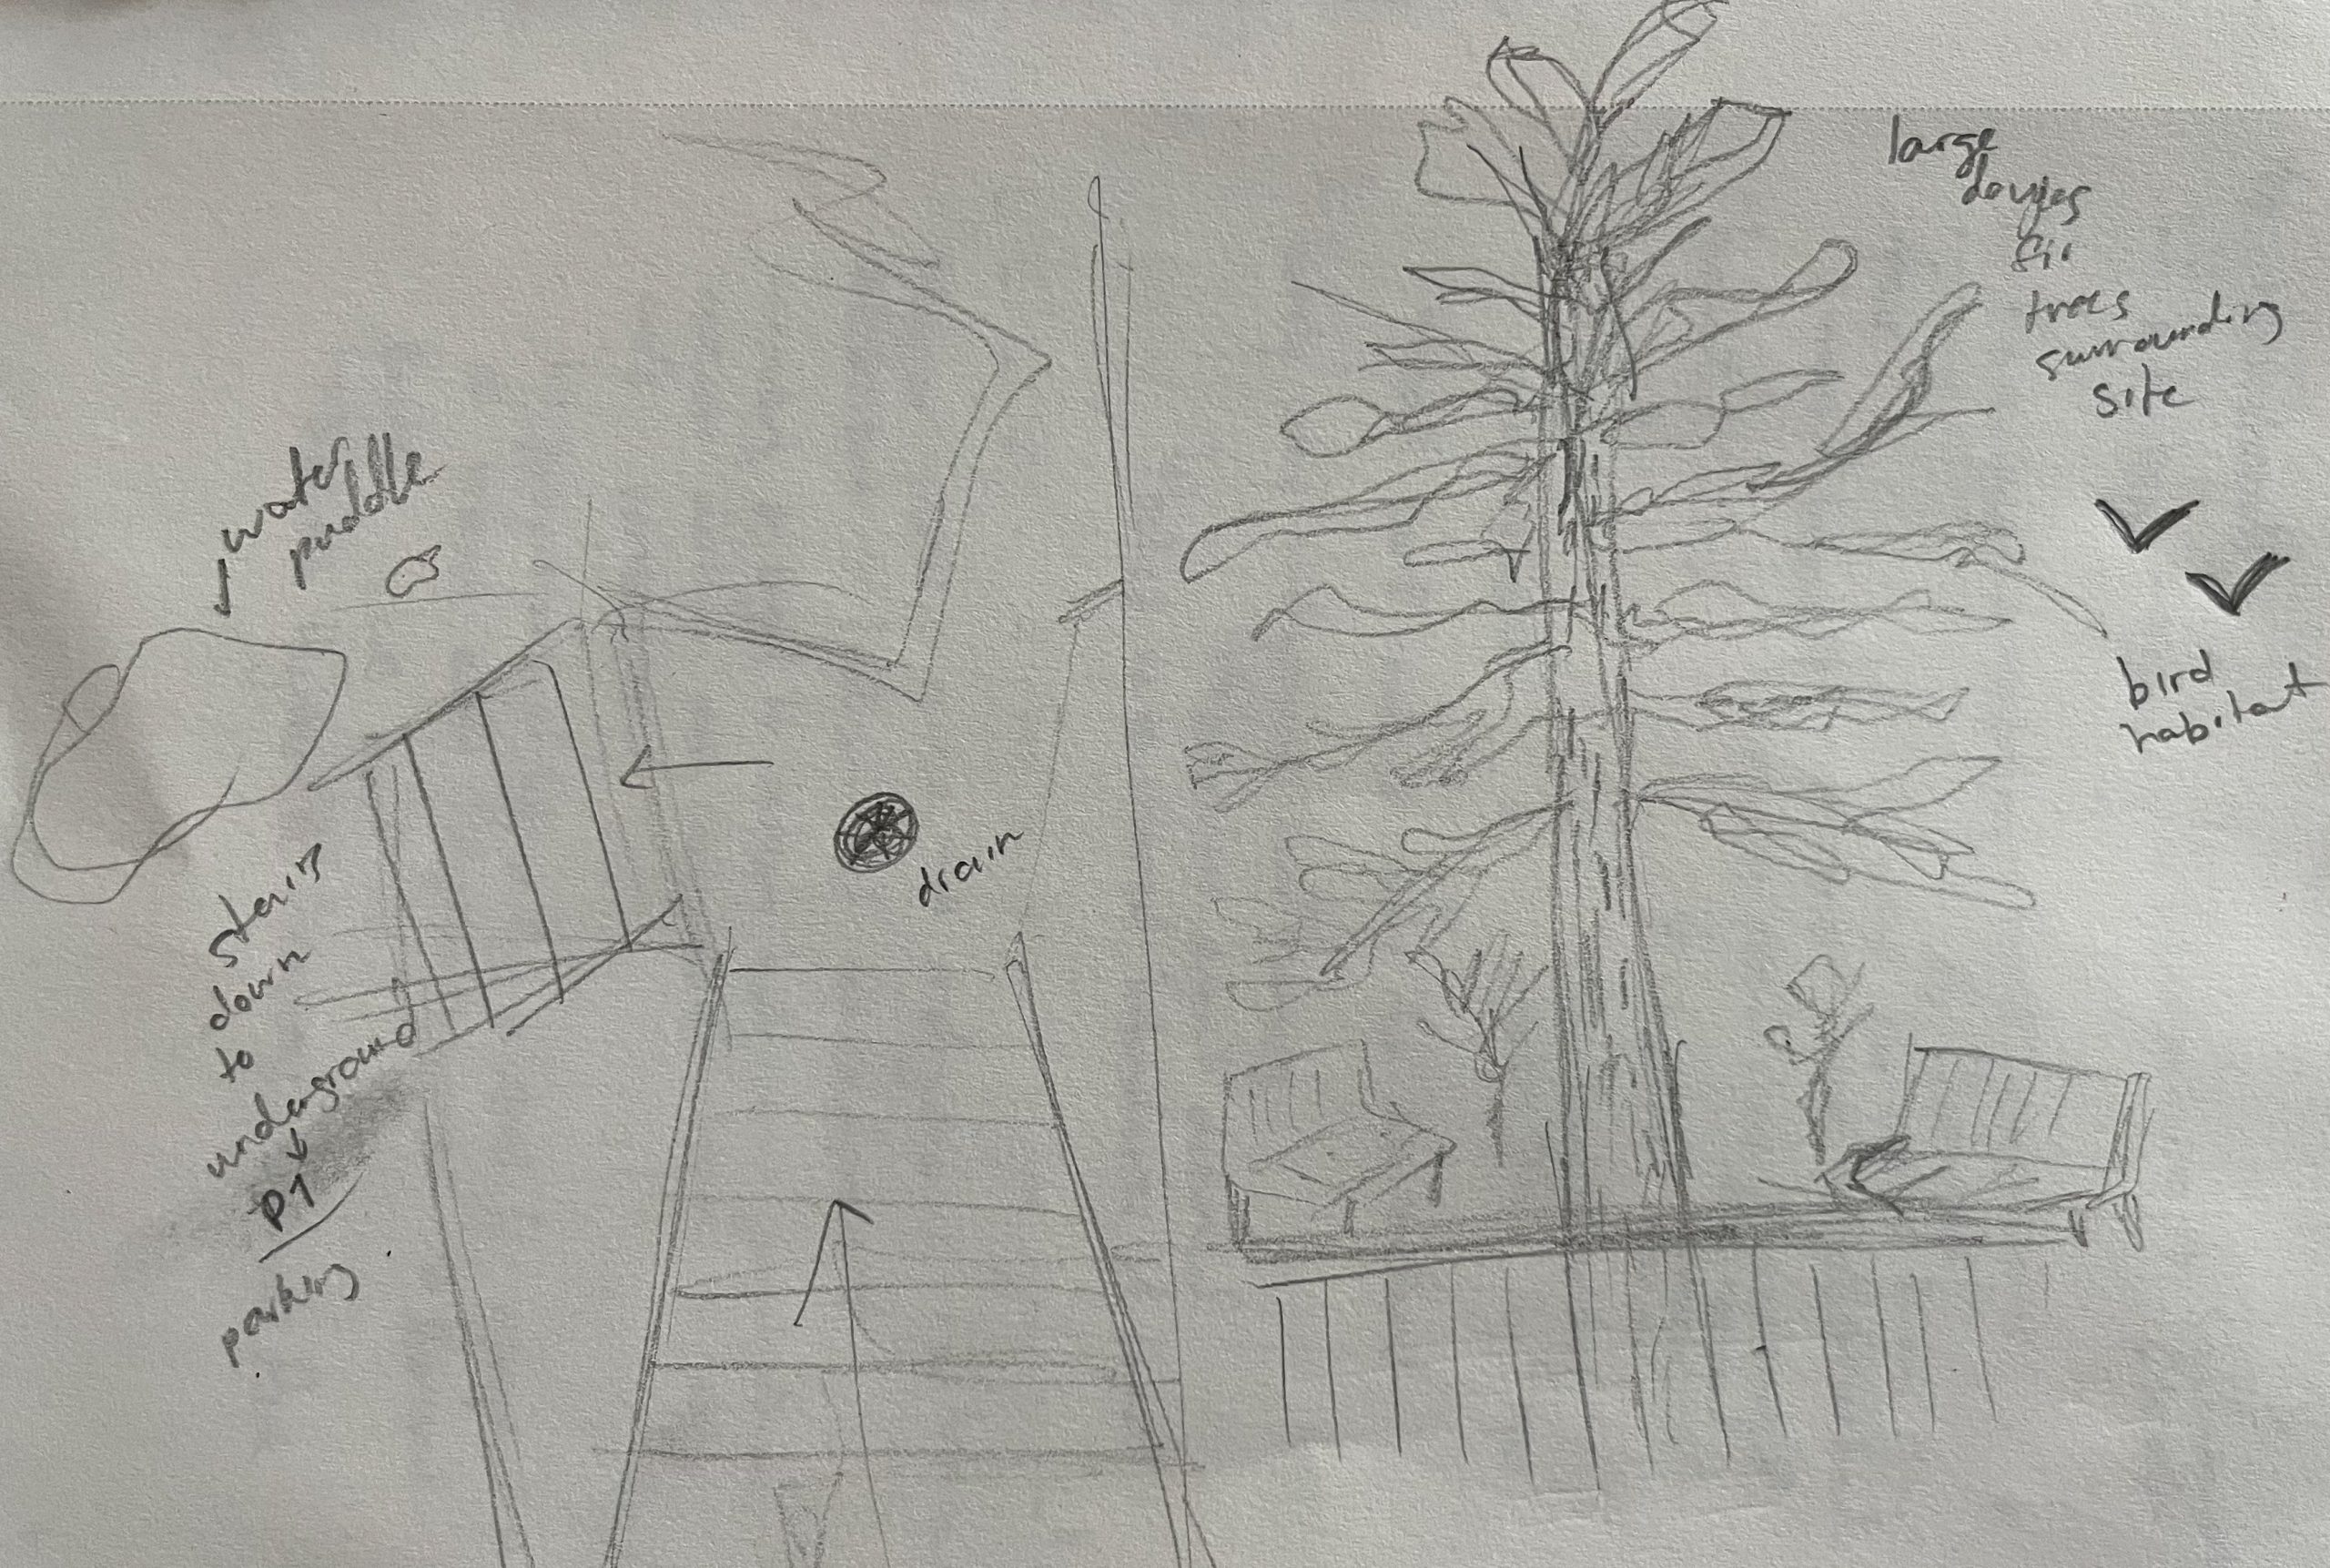
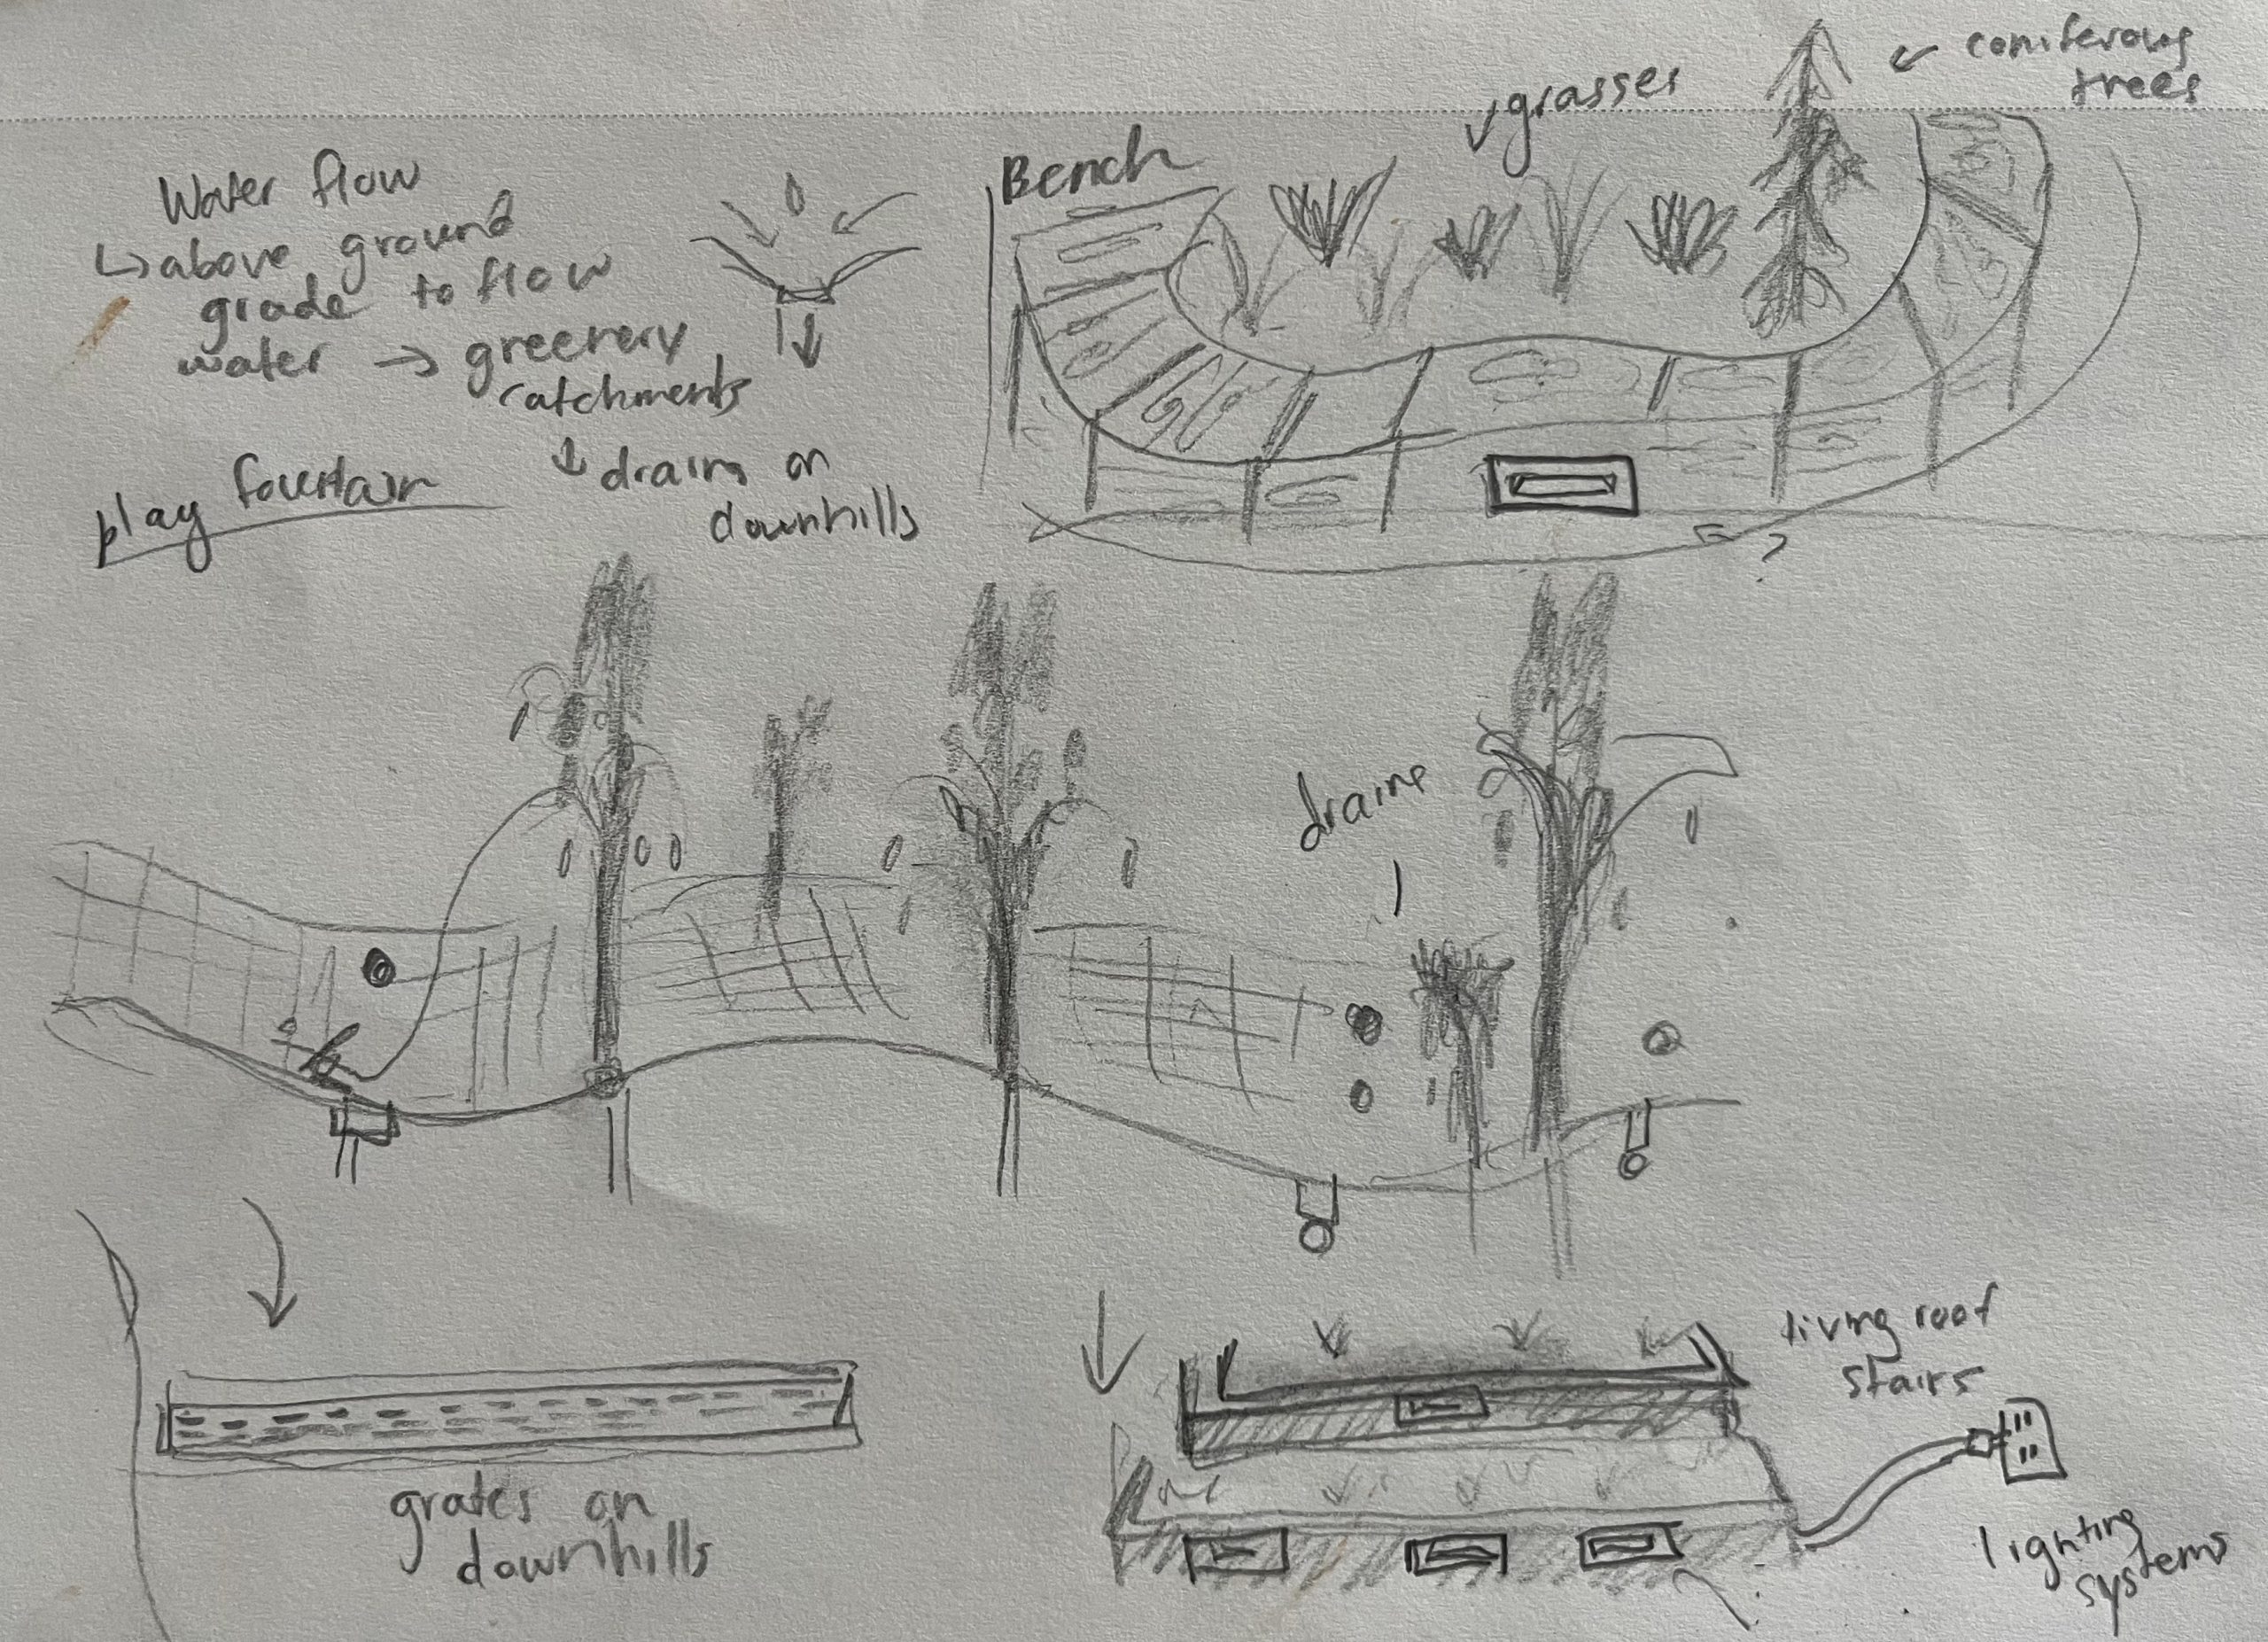
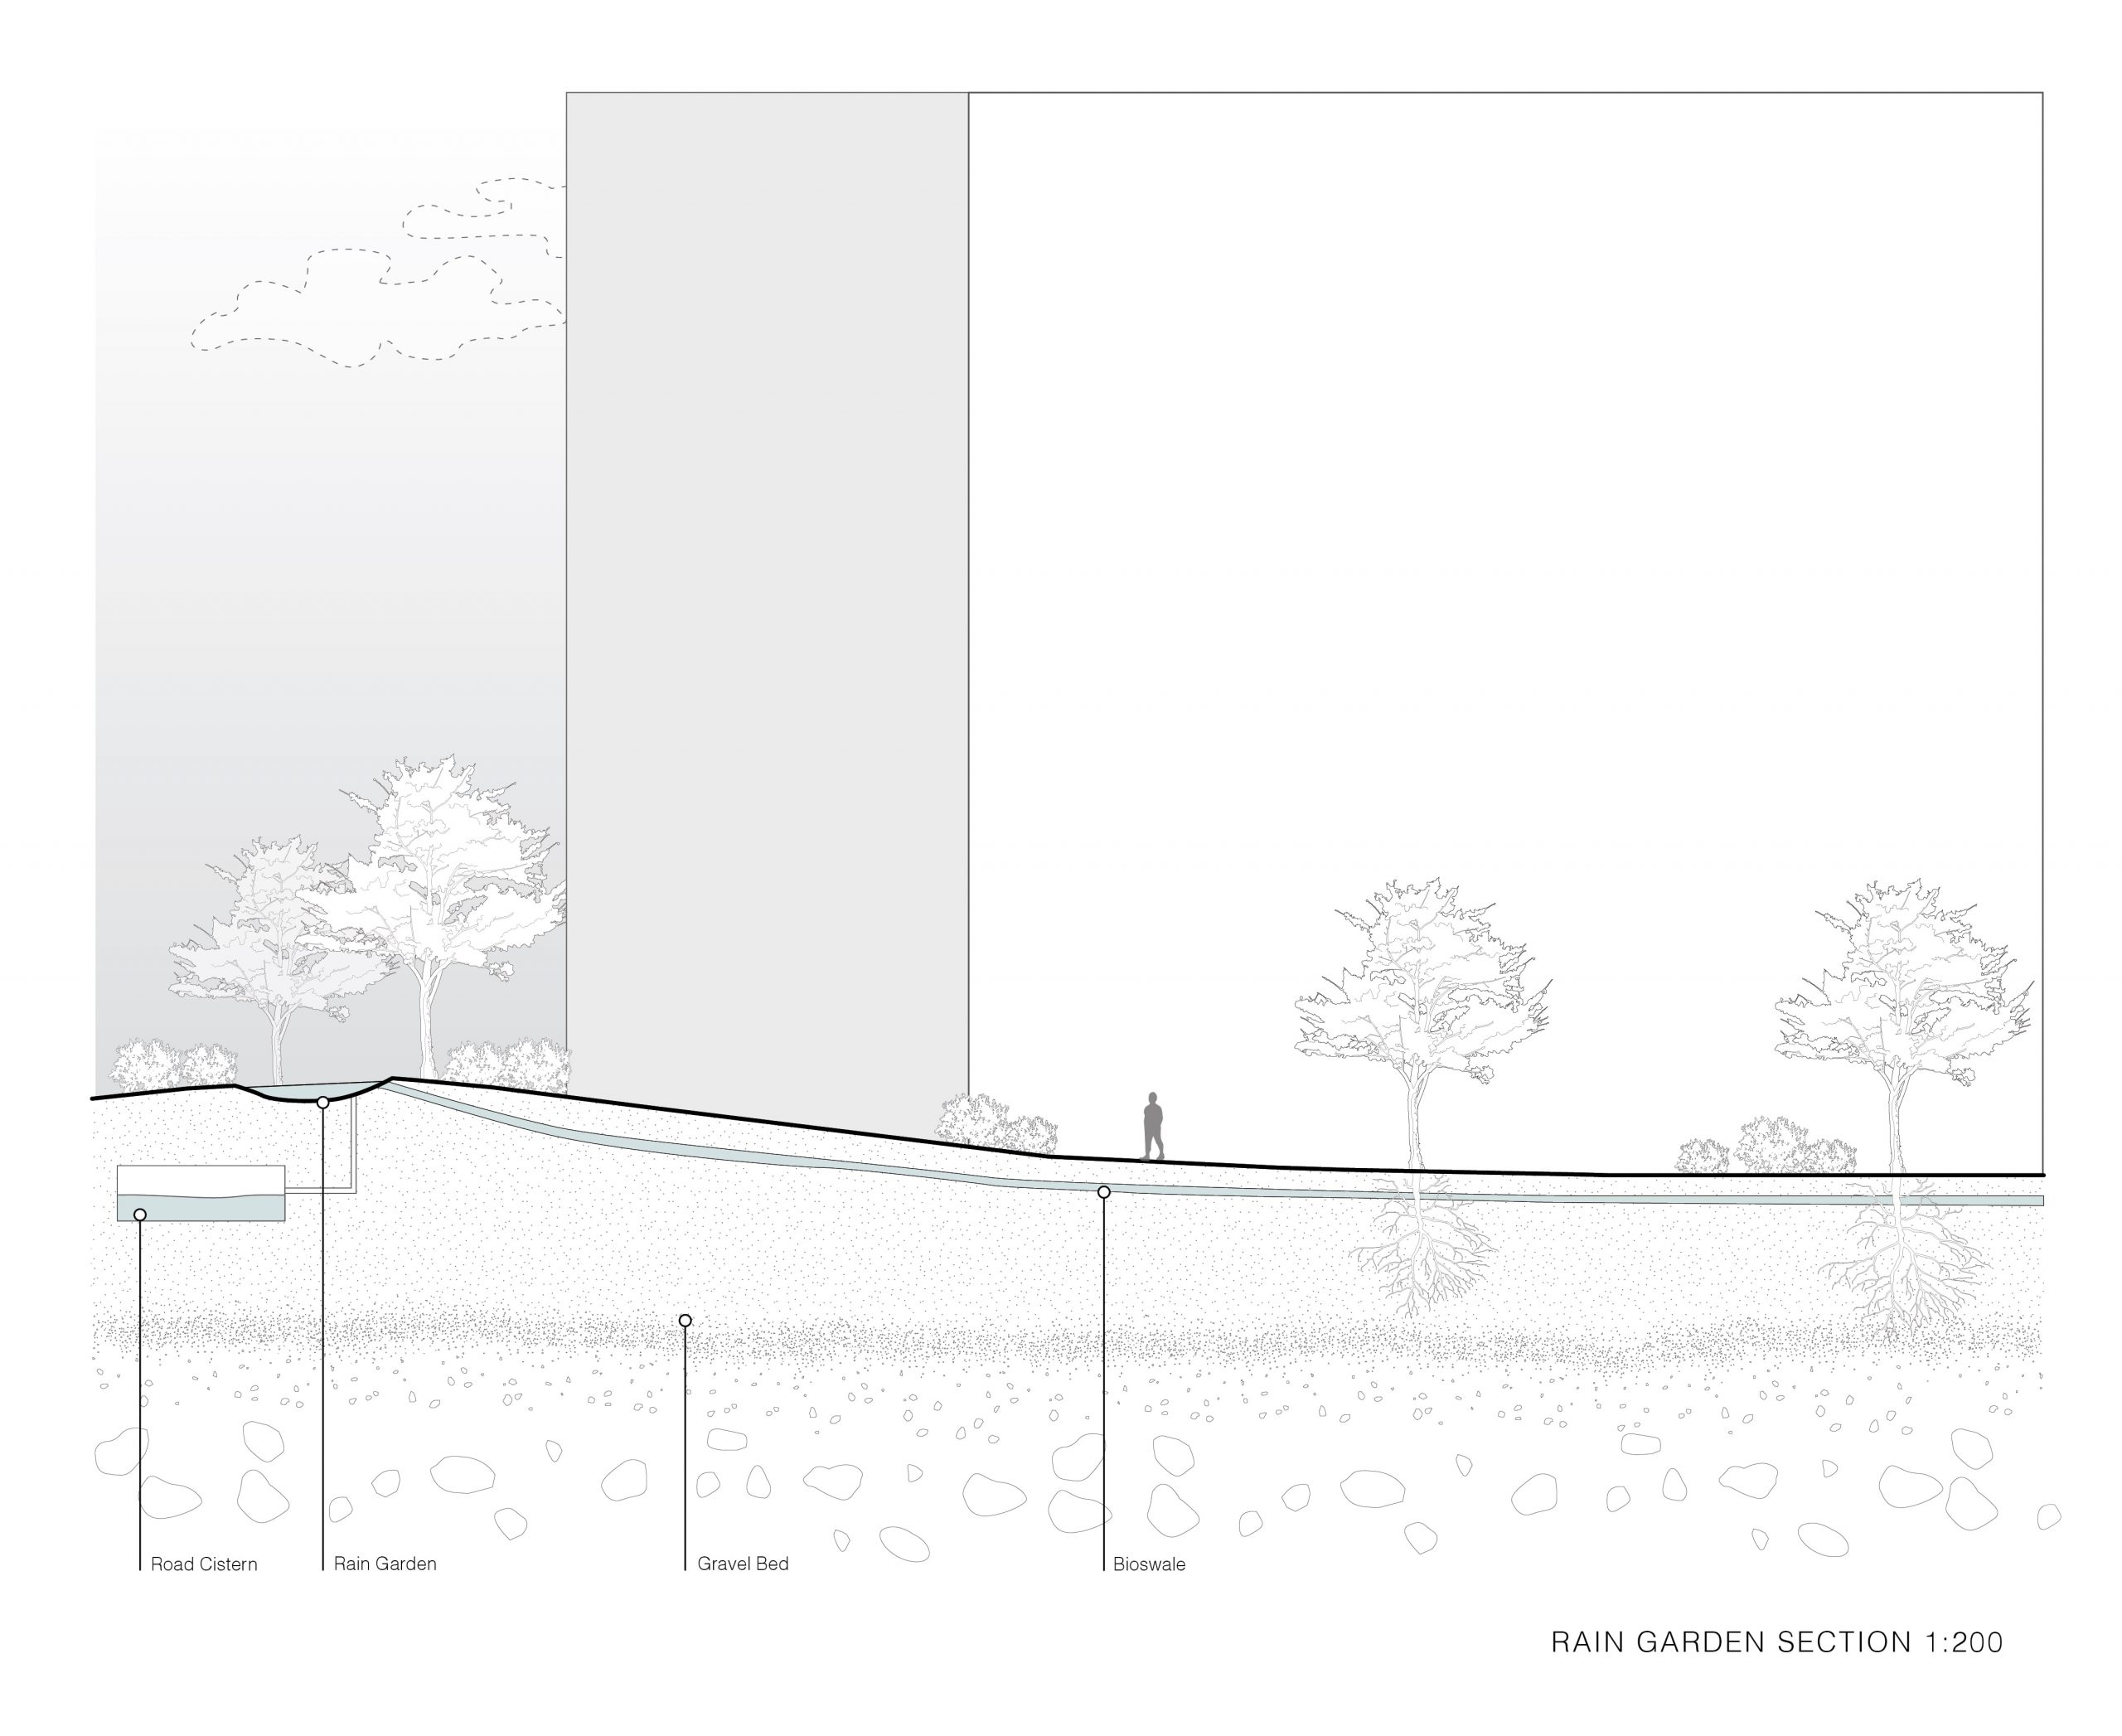
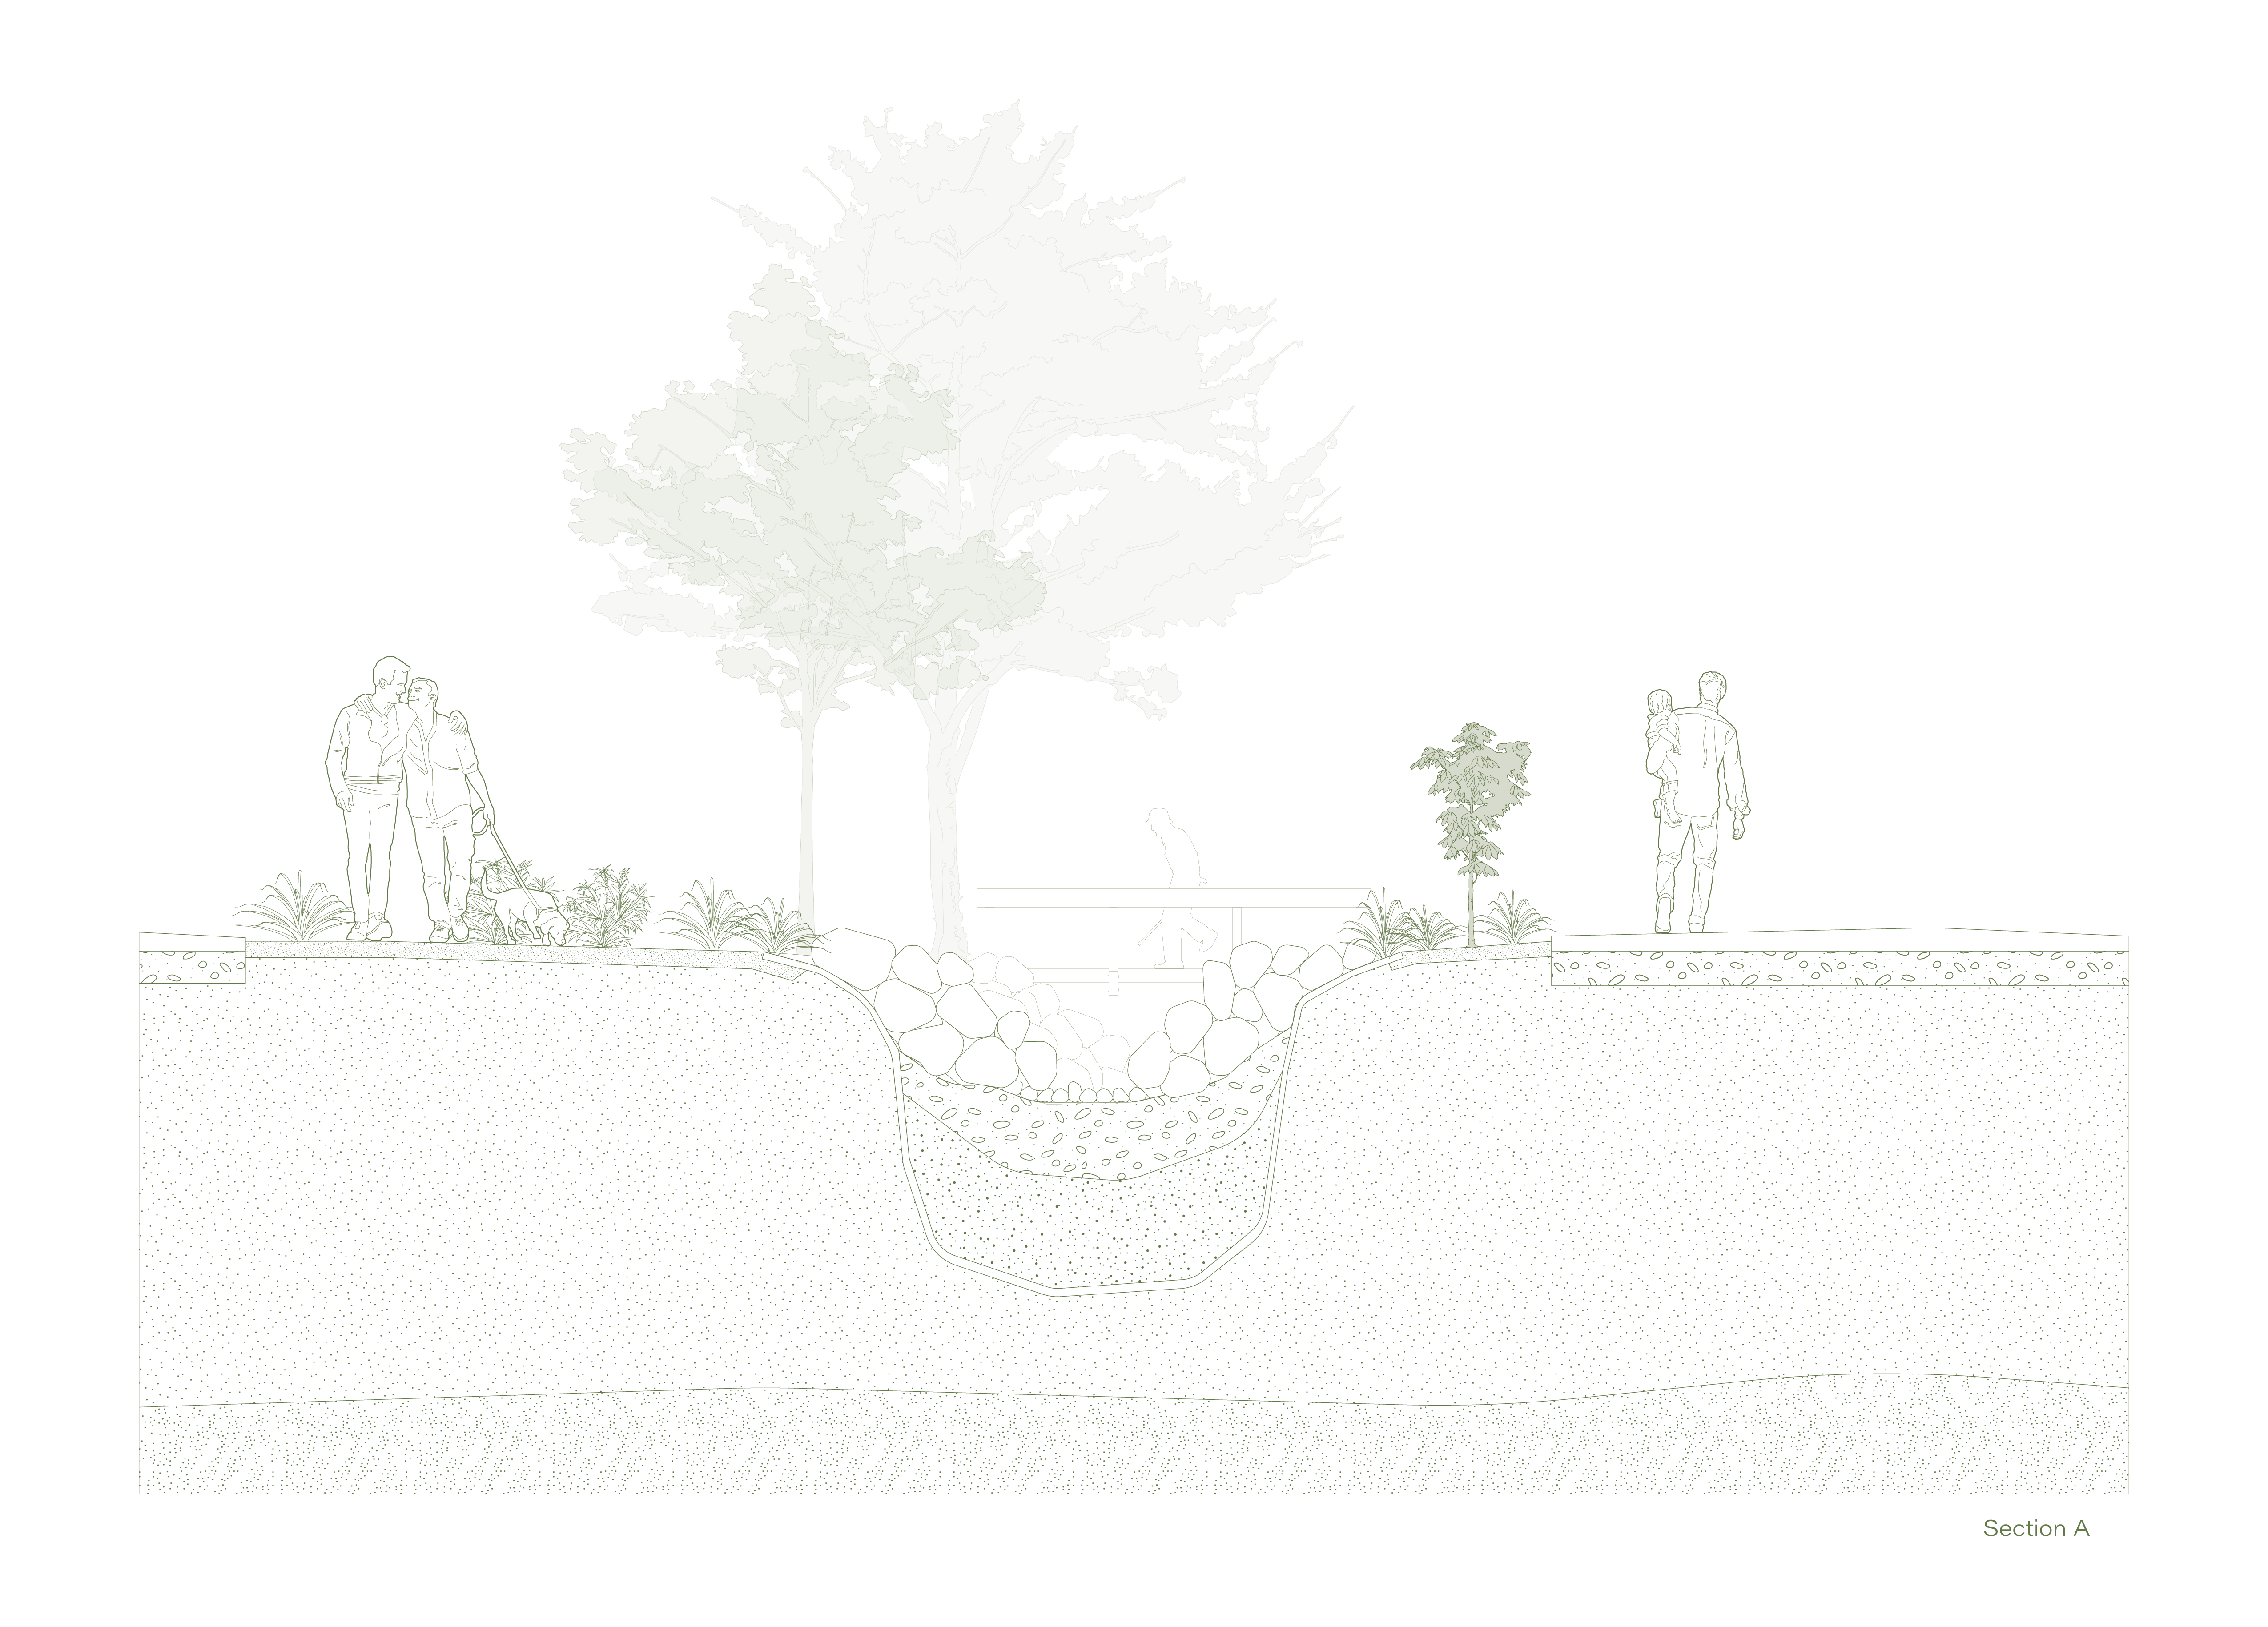
Throughout the site, the varying qualities of the built topography and its materiality strongly suggests direct movement of rainwater towards drains.
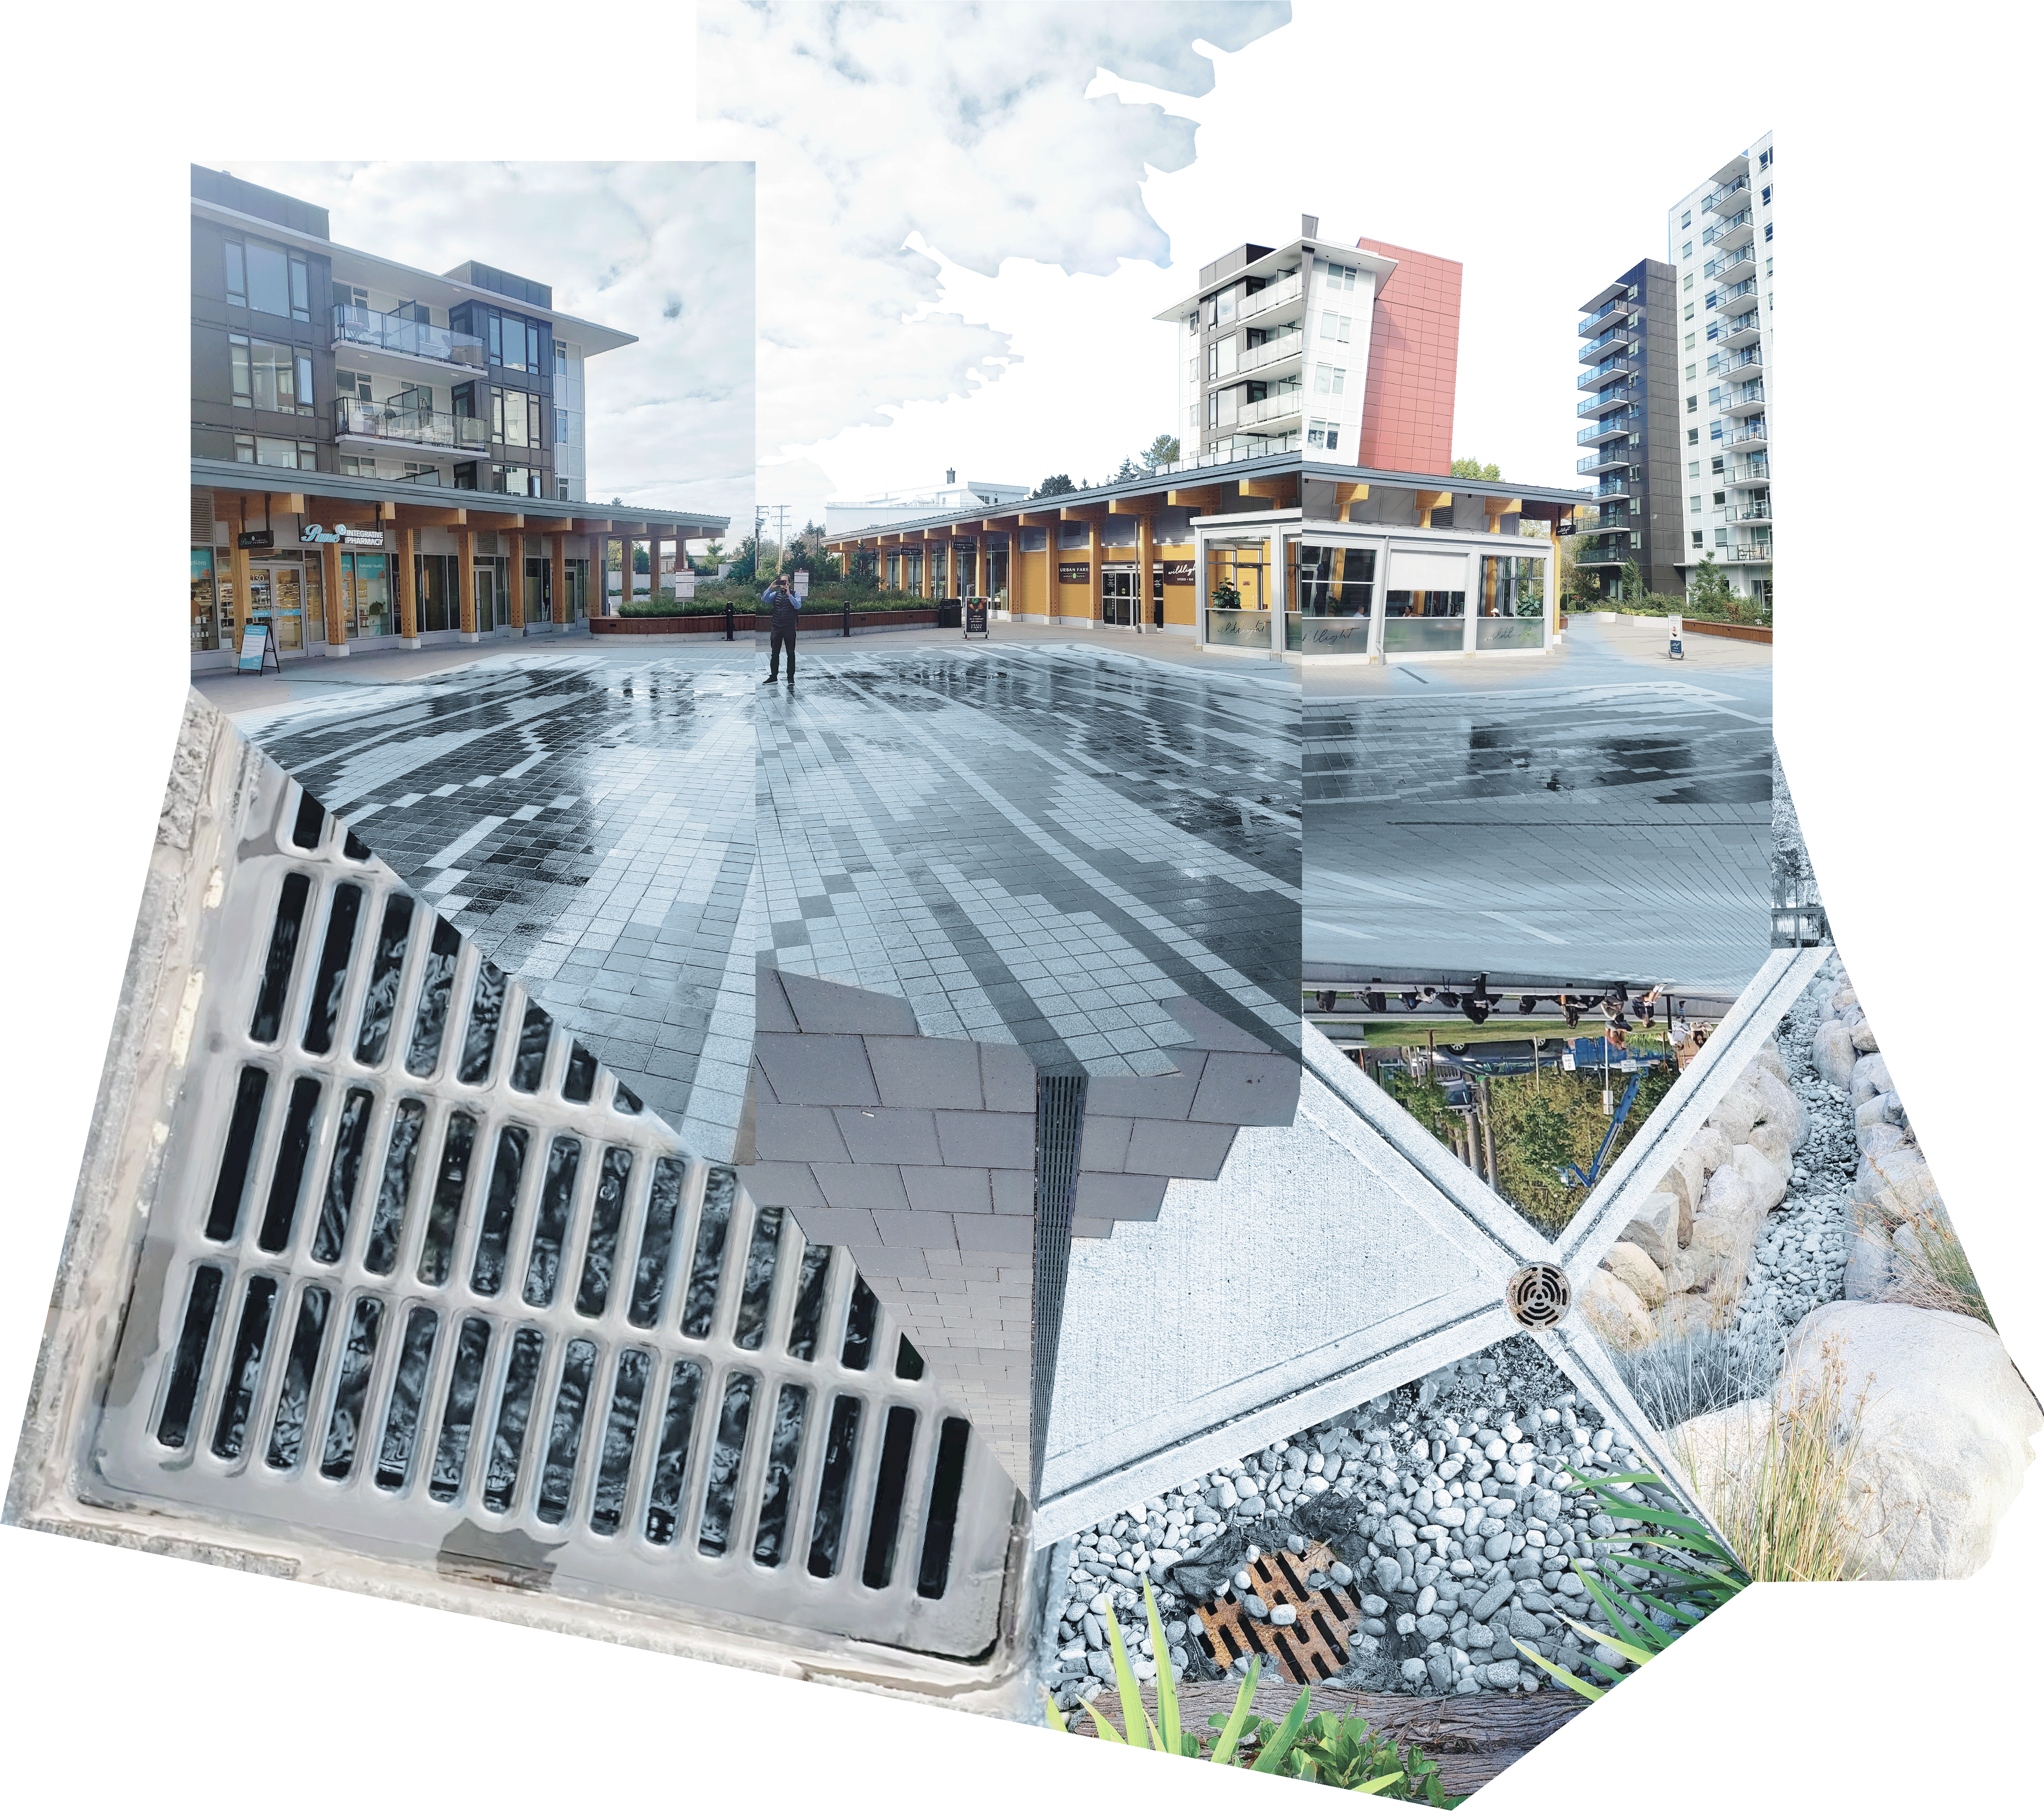
The ground slightly dips and rises depending on its adjacencies to built forms and infrastructure. I observed how the narrow indented spaces between tile pieces created little streams as water accumulated, while the tiles themselves created stiller puddles. This relationship of the “in-between” and the built form can be seen at a multitude of scales and starts to question the holistic system of urban design.
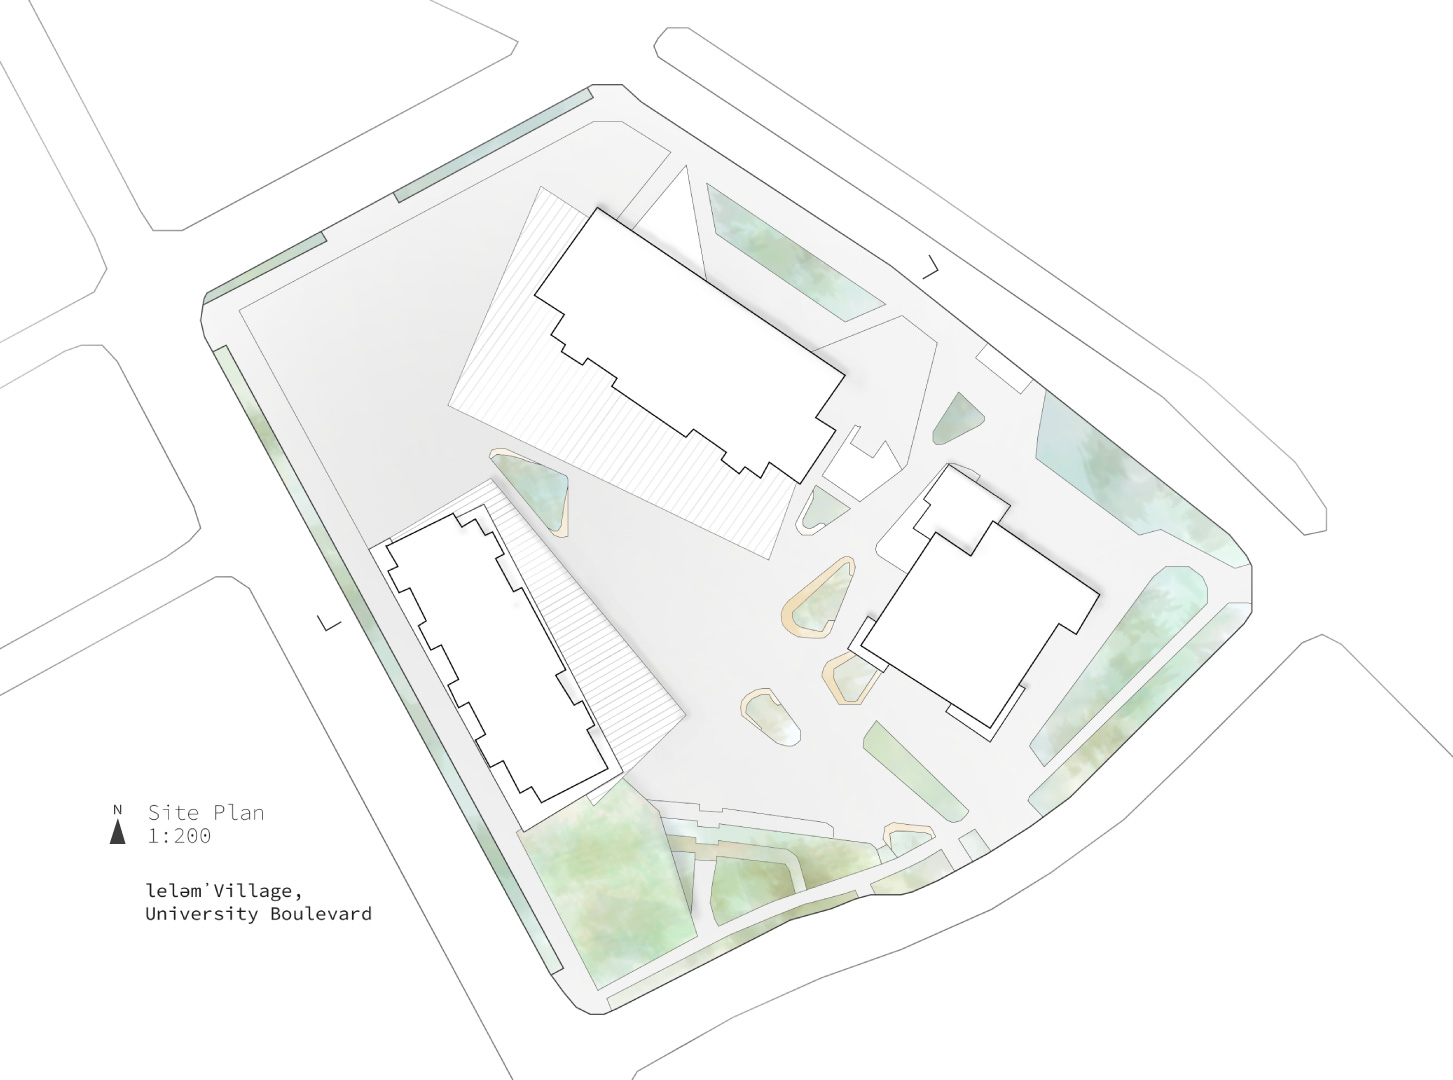
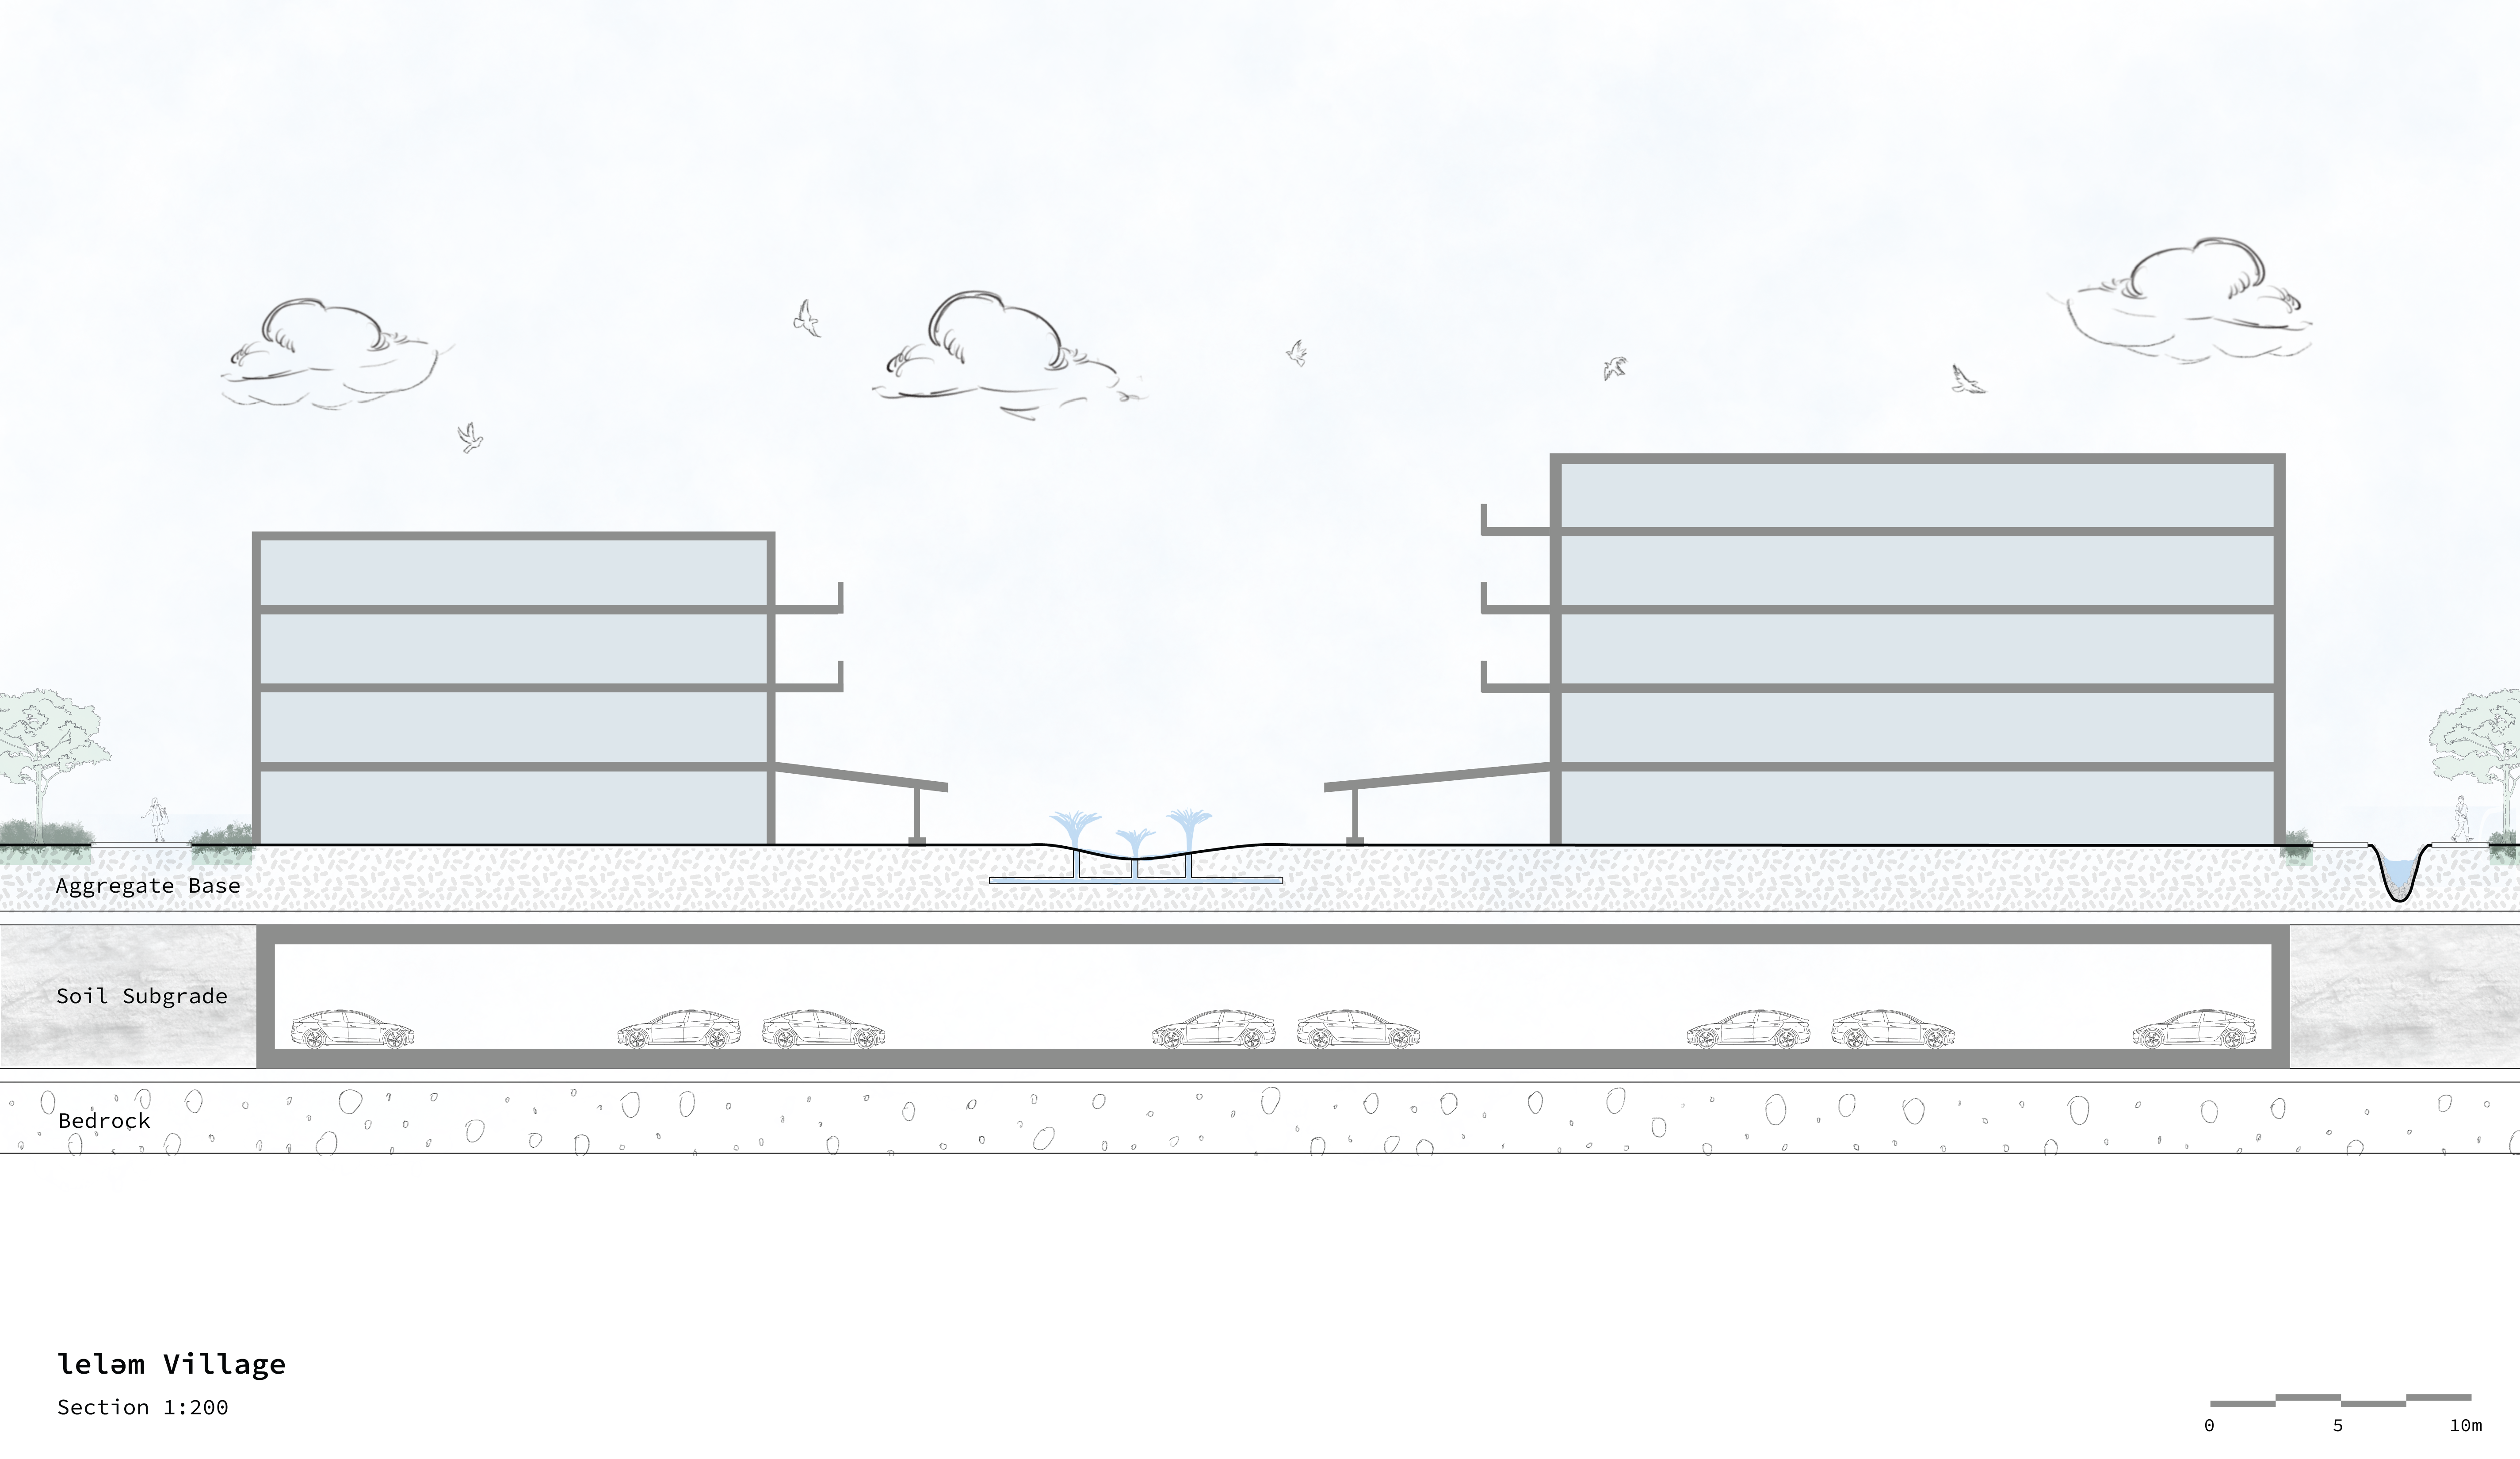
1:200 on 36″ x 36″ artboards
Assignment 02 – Ella Dufresne


Assignment 2 _Carol Zhao
A2 – Nathan Chew


Assignment 2 – Max Kryski


A02 | Alyssa Cheung
A2 | H. Brogan Gealey
Assignment 2 – Cube Method
Individual – Delivery Time 1 Week
In this assignment, students will observe & record open space and built form.
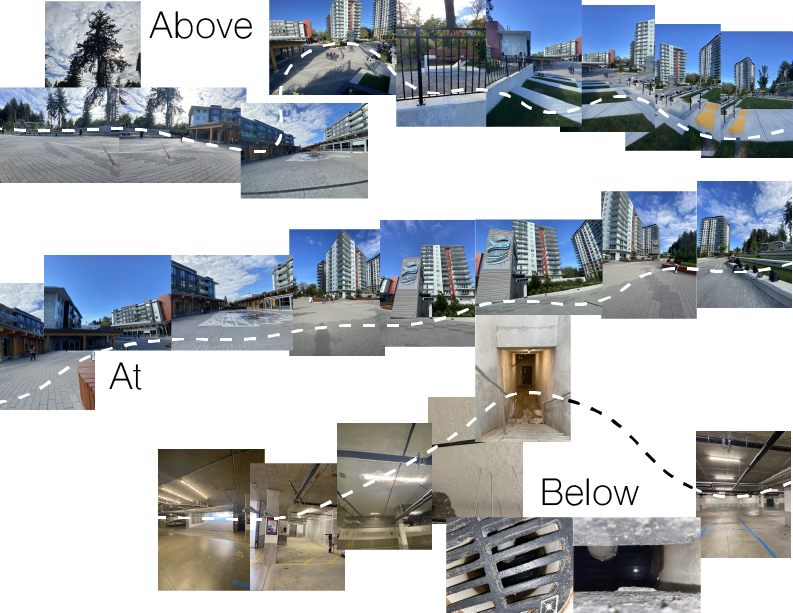
Objective: Practice your ability to critically interpret and view a site through a variety of tools and methods. Capture the flow of information at all levels of a site (below, on, above – around).
Process:
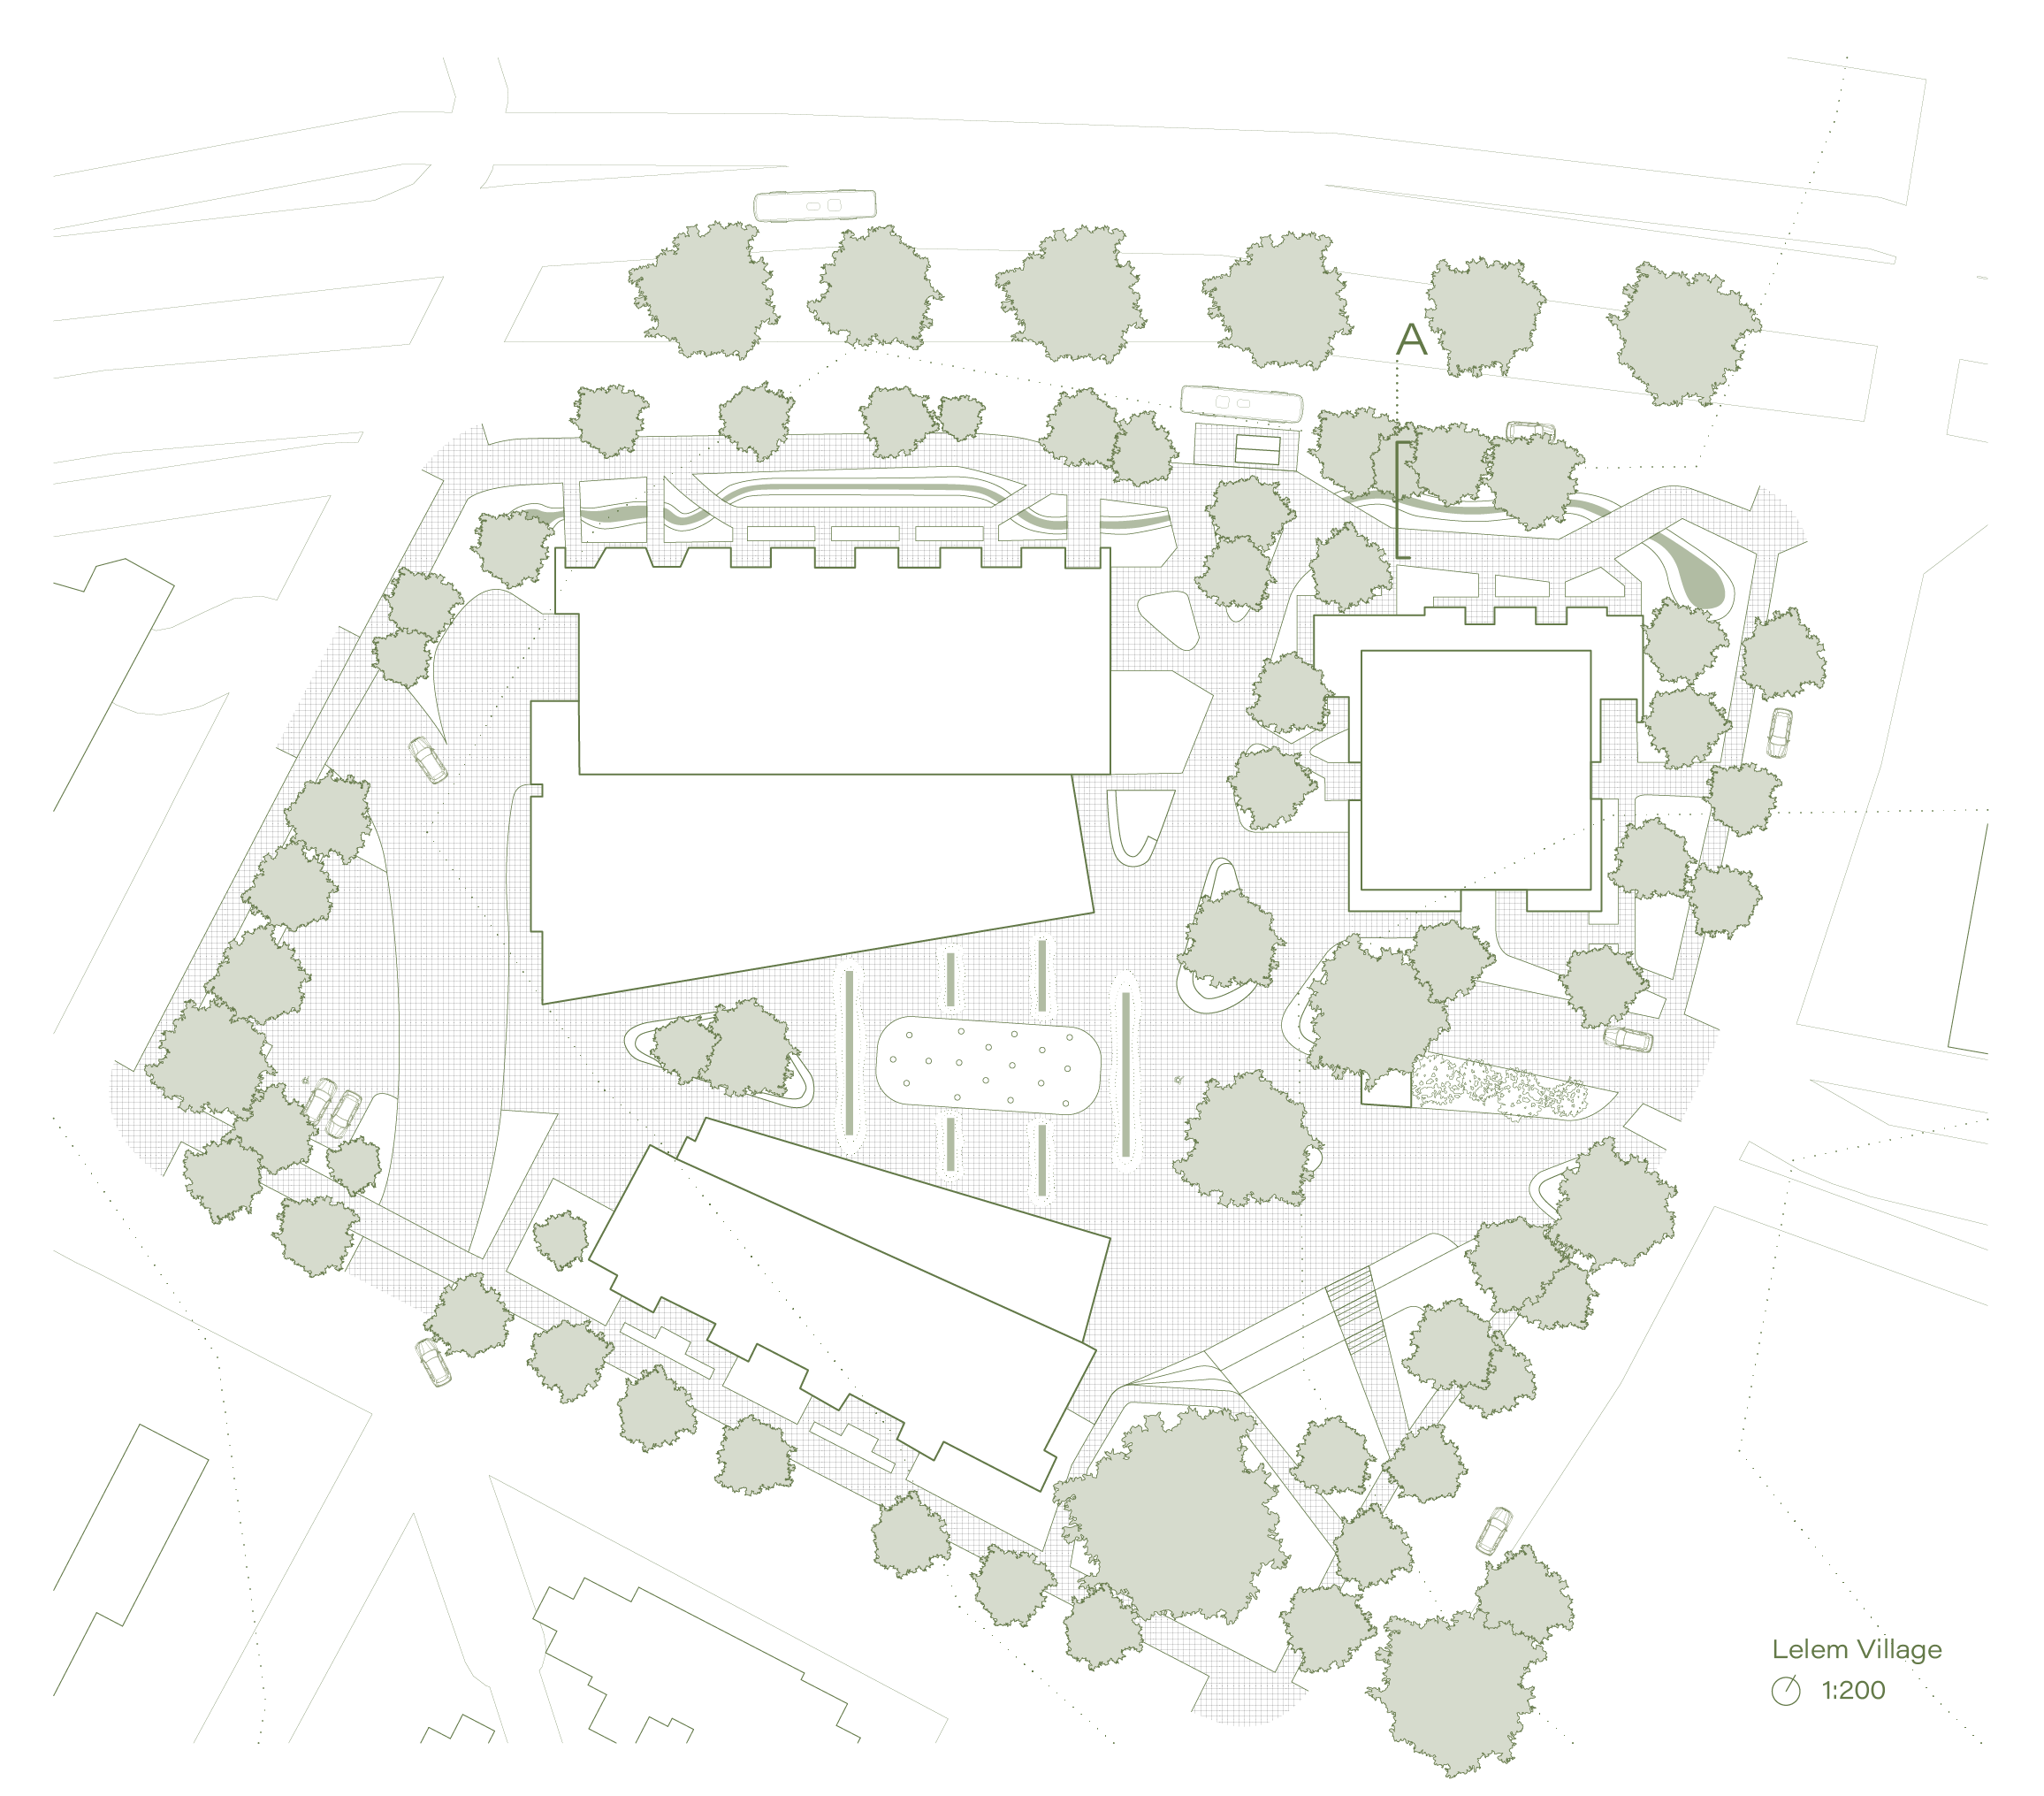
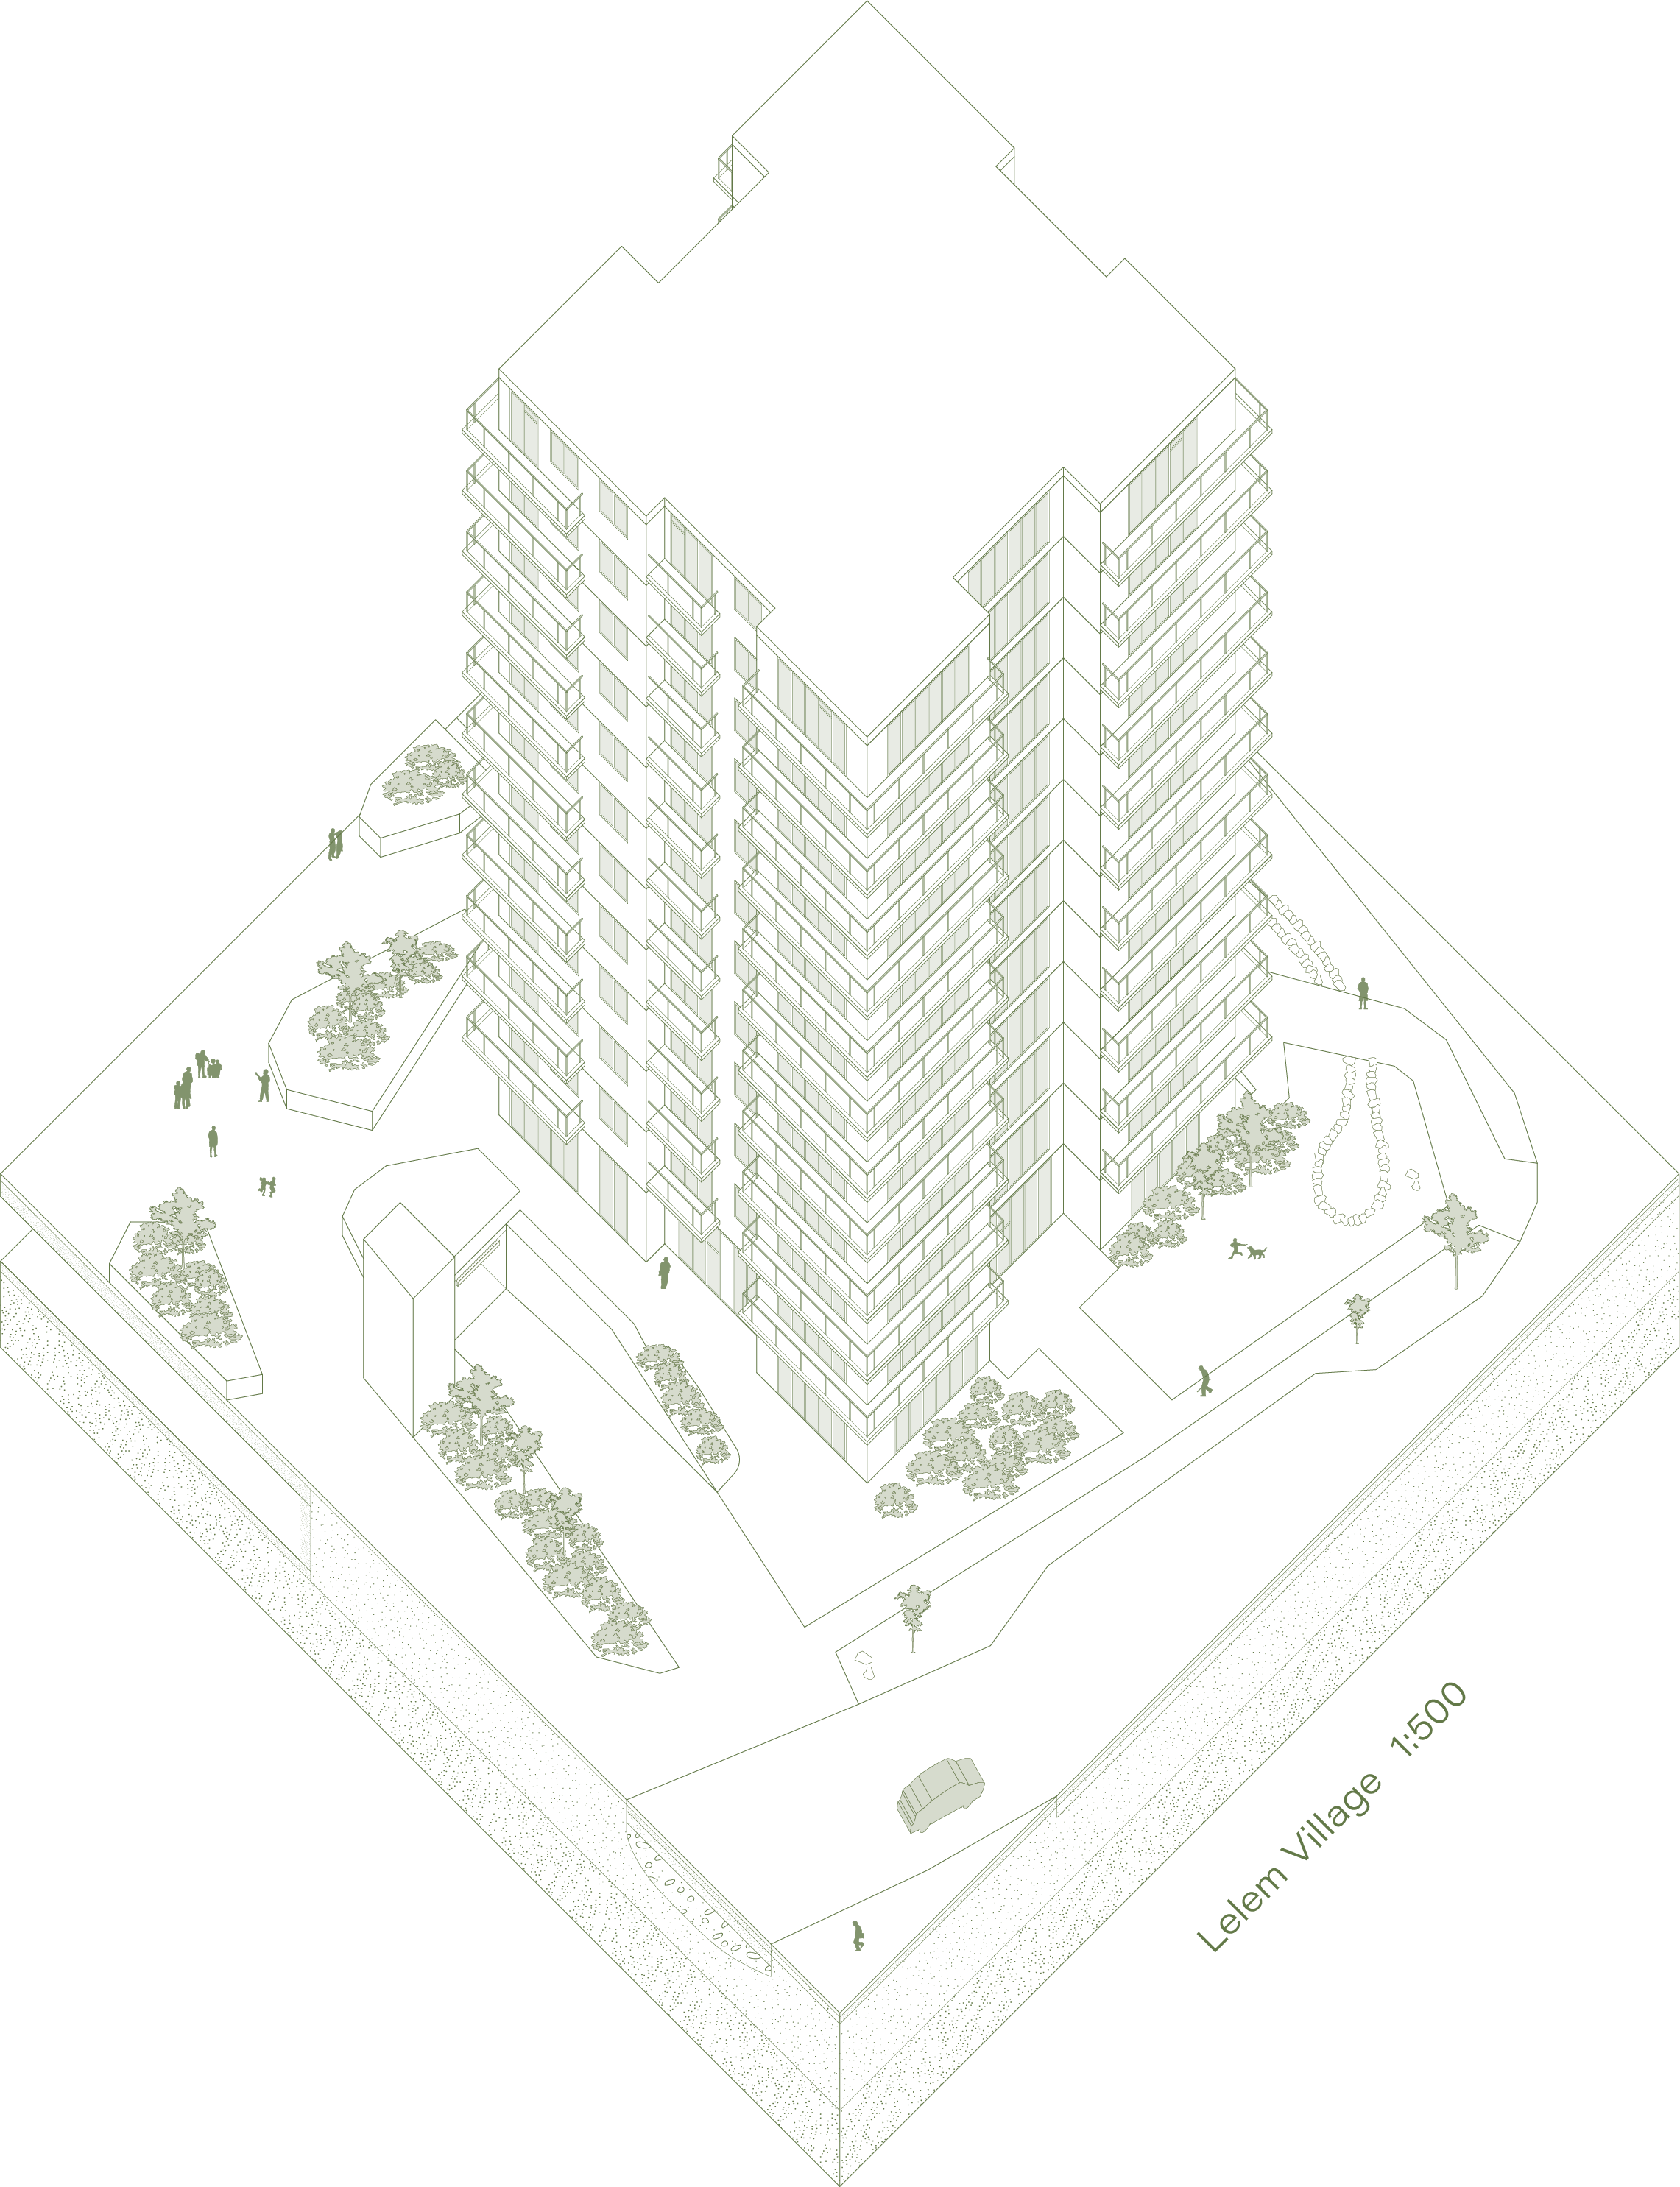
- Visit, investigate, observe, and draw a given site at UBC at a 1:200 scale. Include buildings, open space, and elements for scale comparison, such as a car.
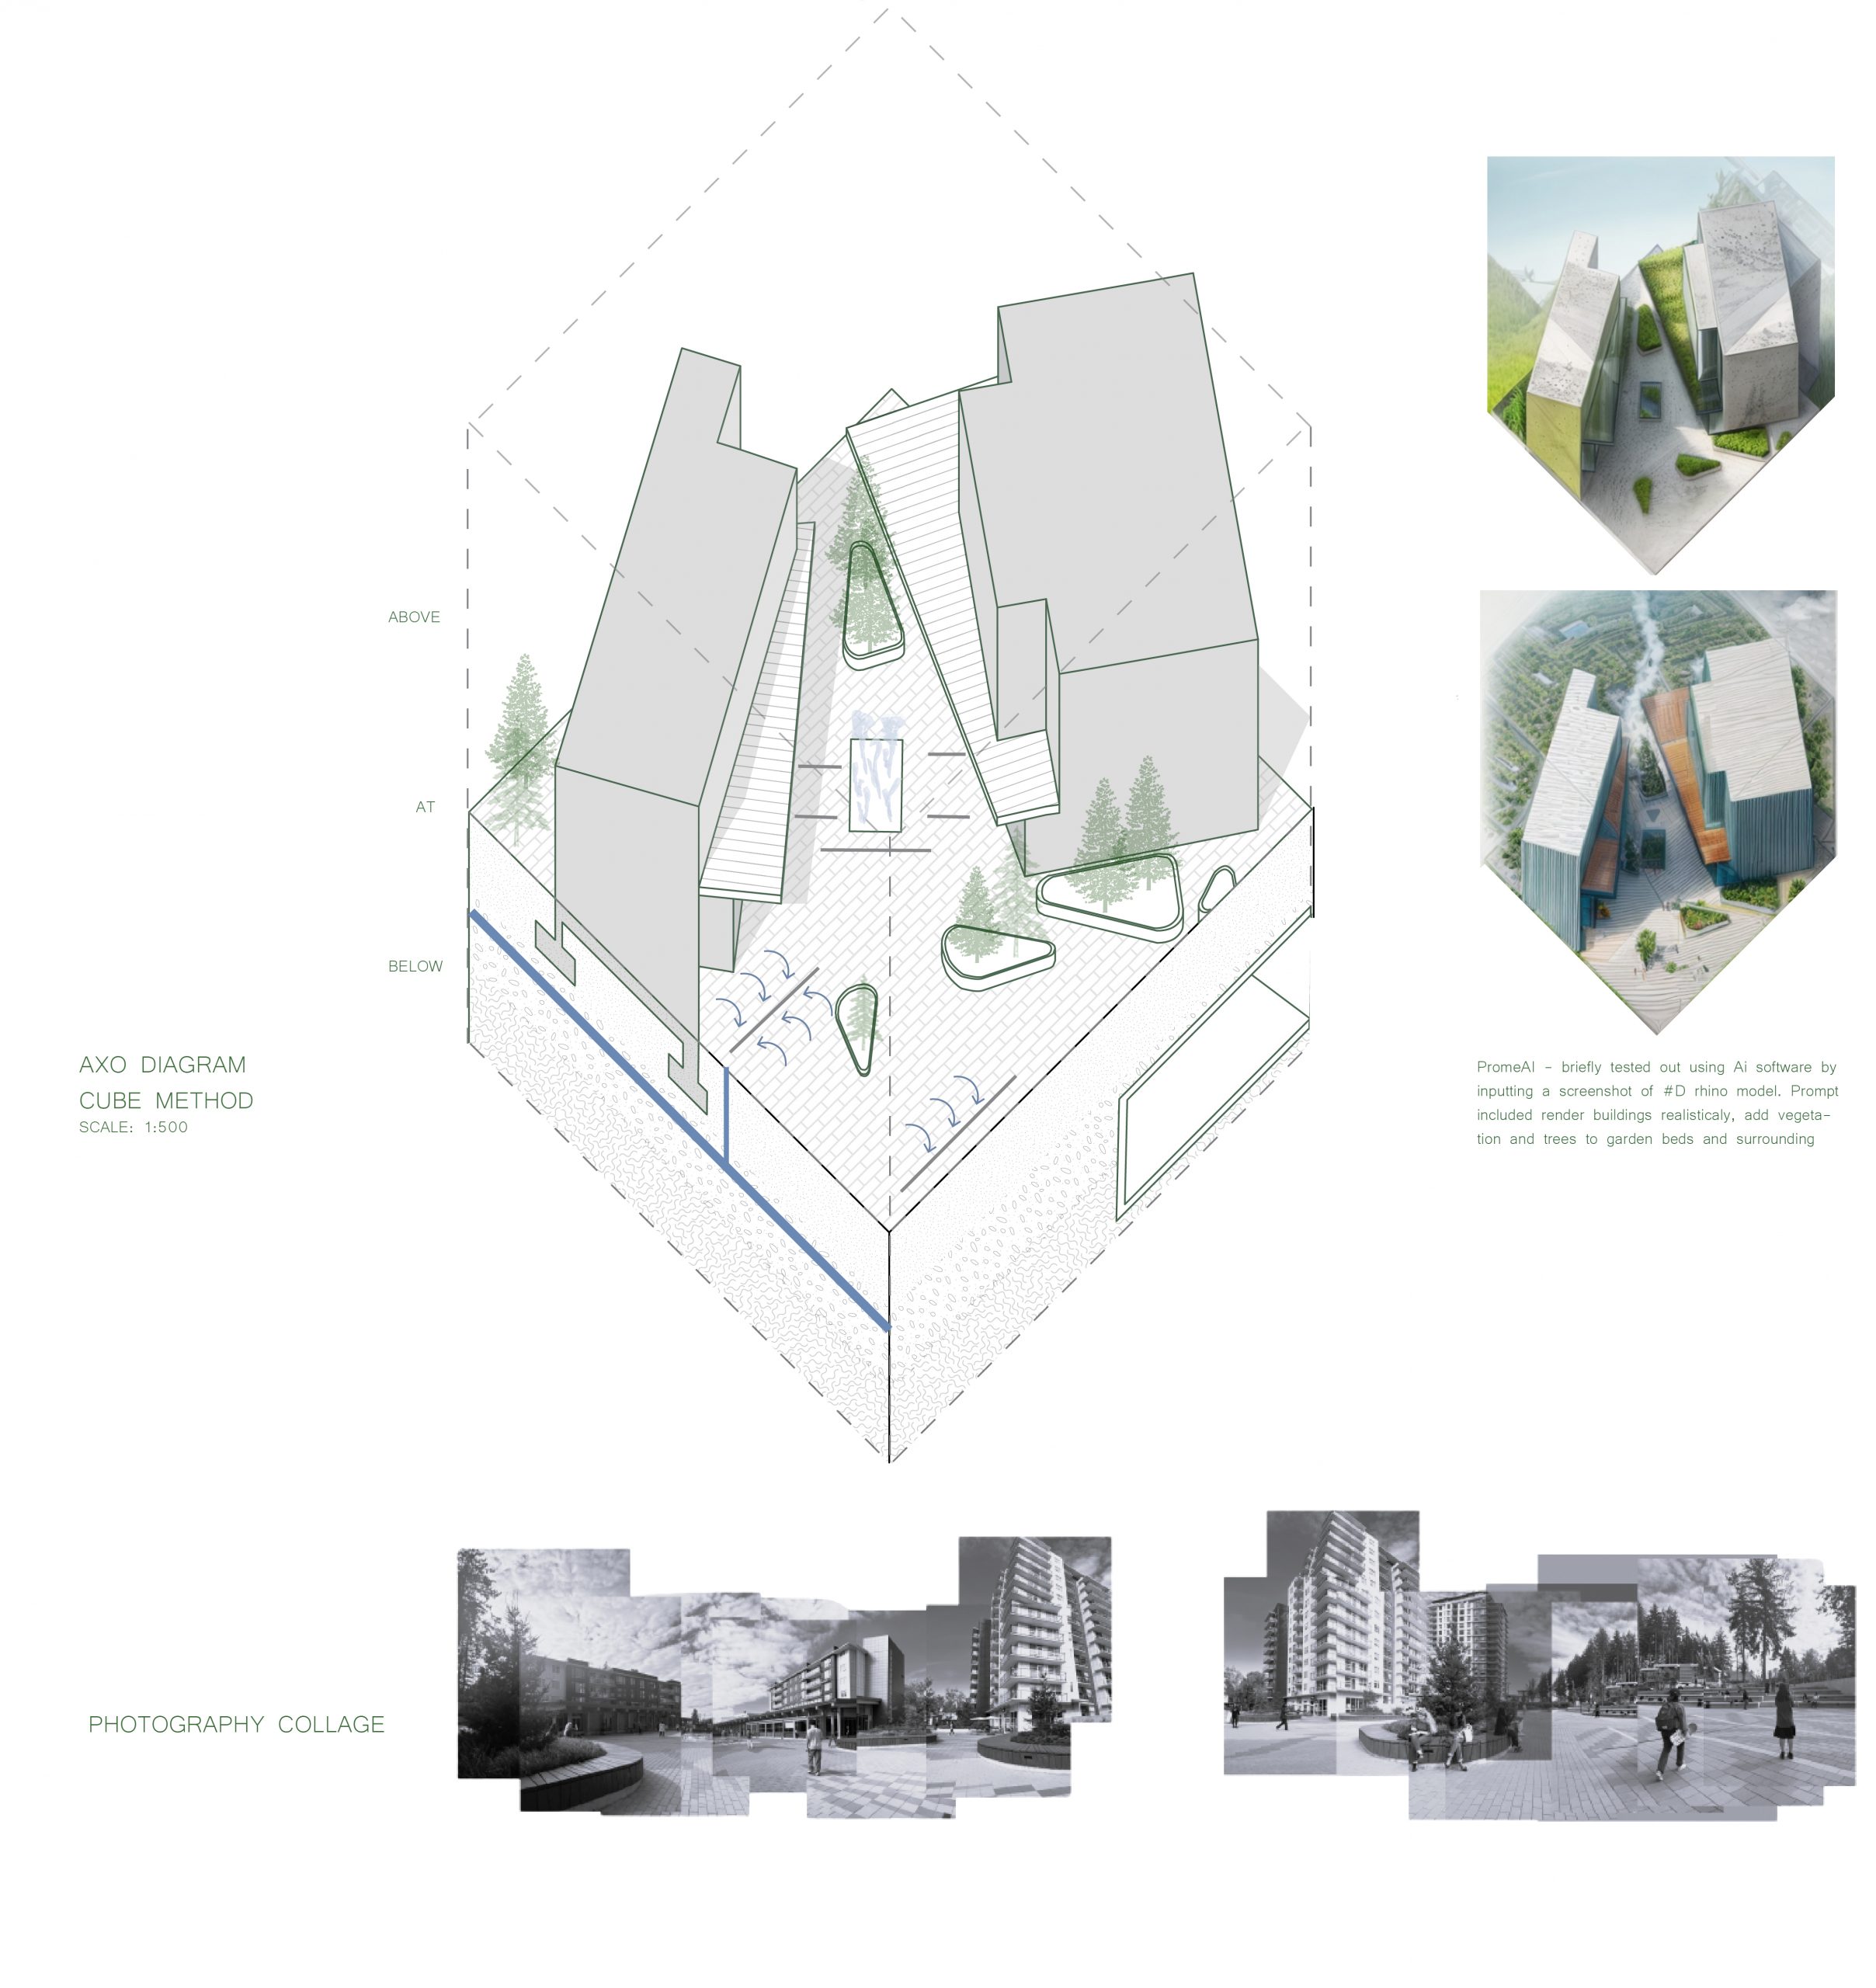
- Study and draw the infrastructure of the site (e.g., electricity, water, gas, internet, roads) using the “Cube” method to investigate, observe and record. See https://blogs.ubc.ca/axonometric/.
Deliverables*:
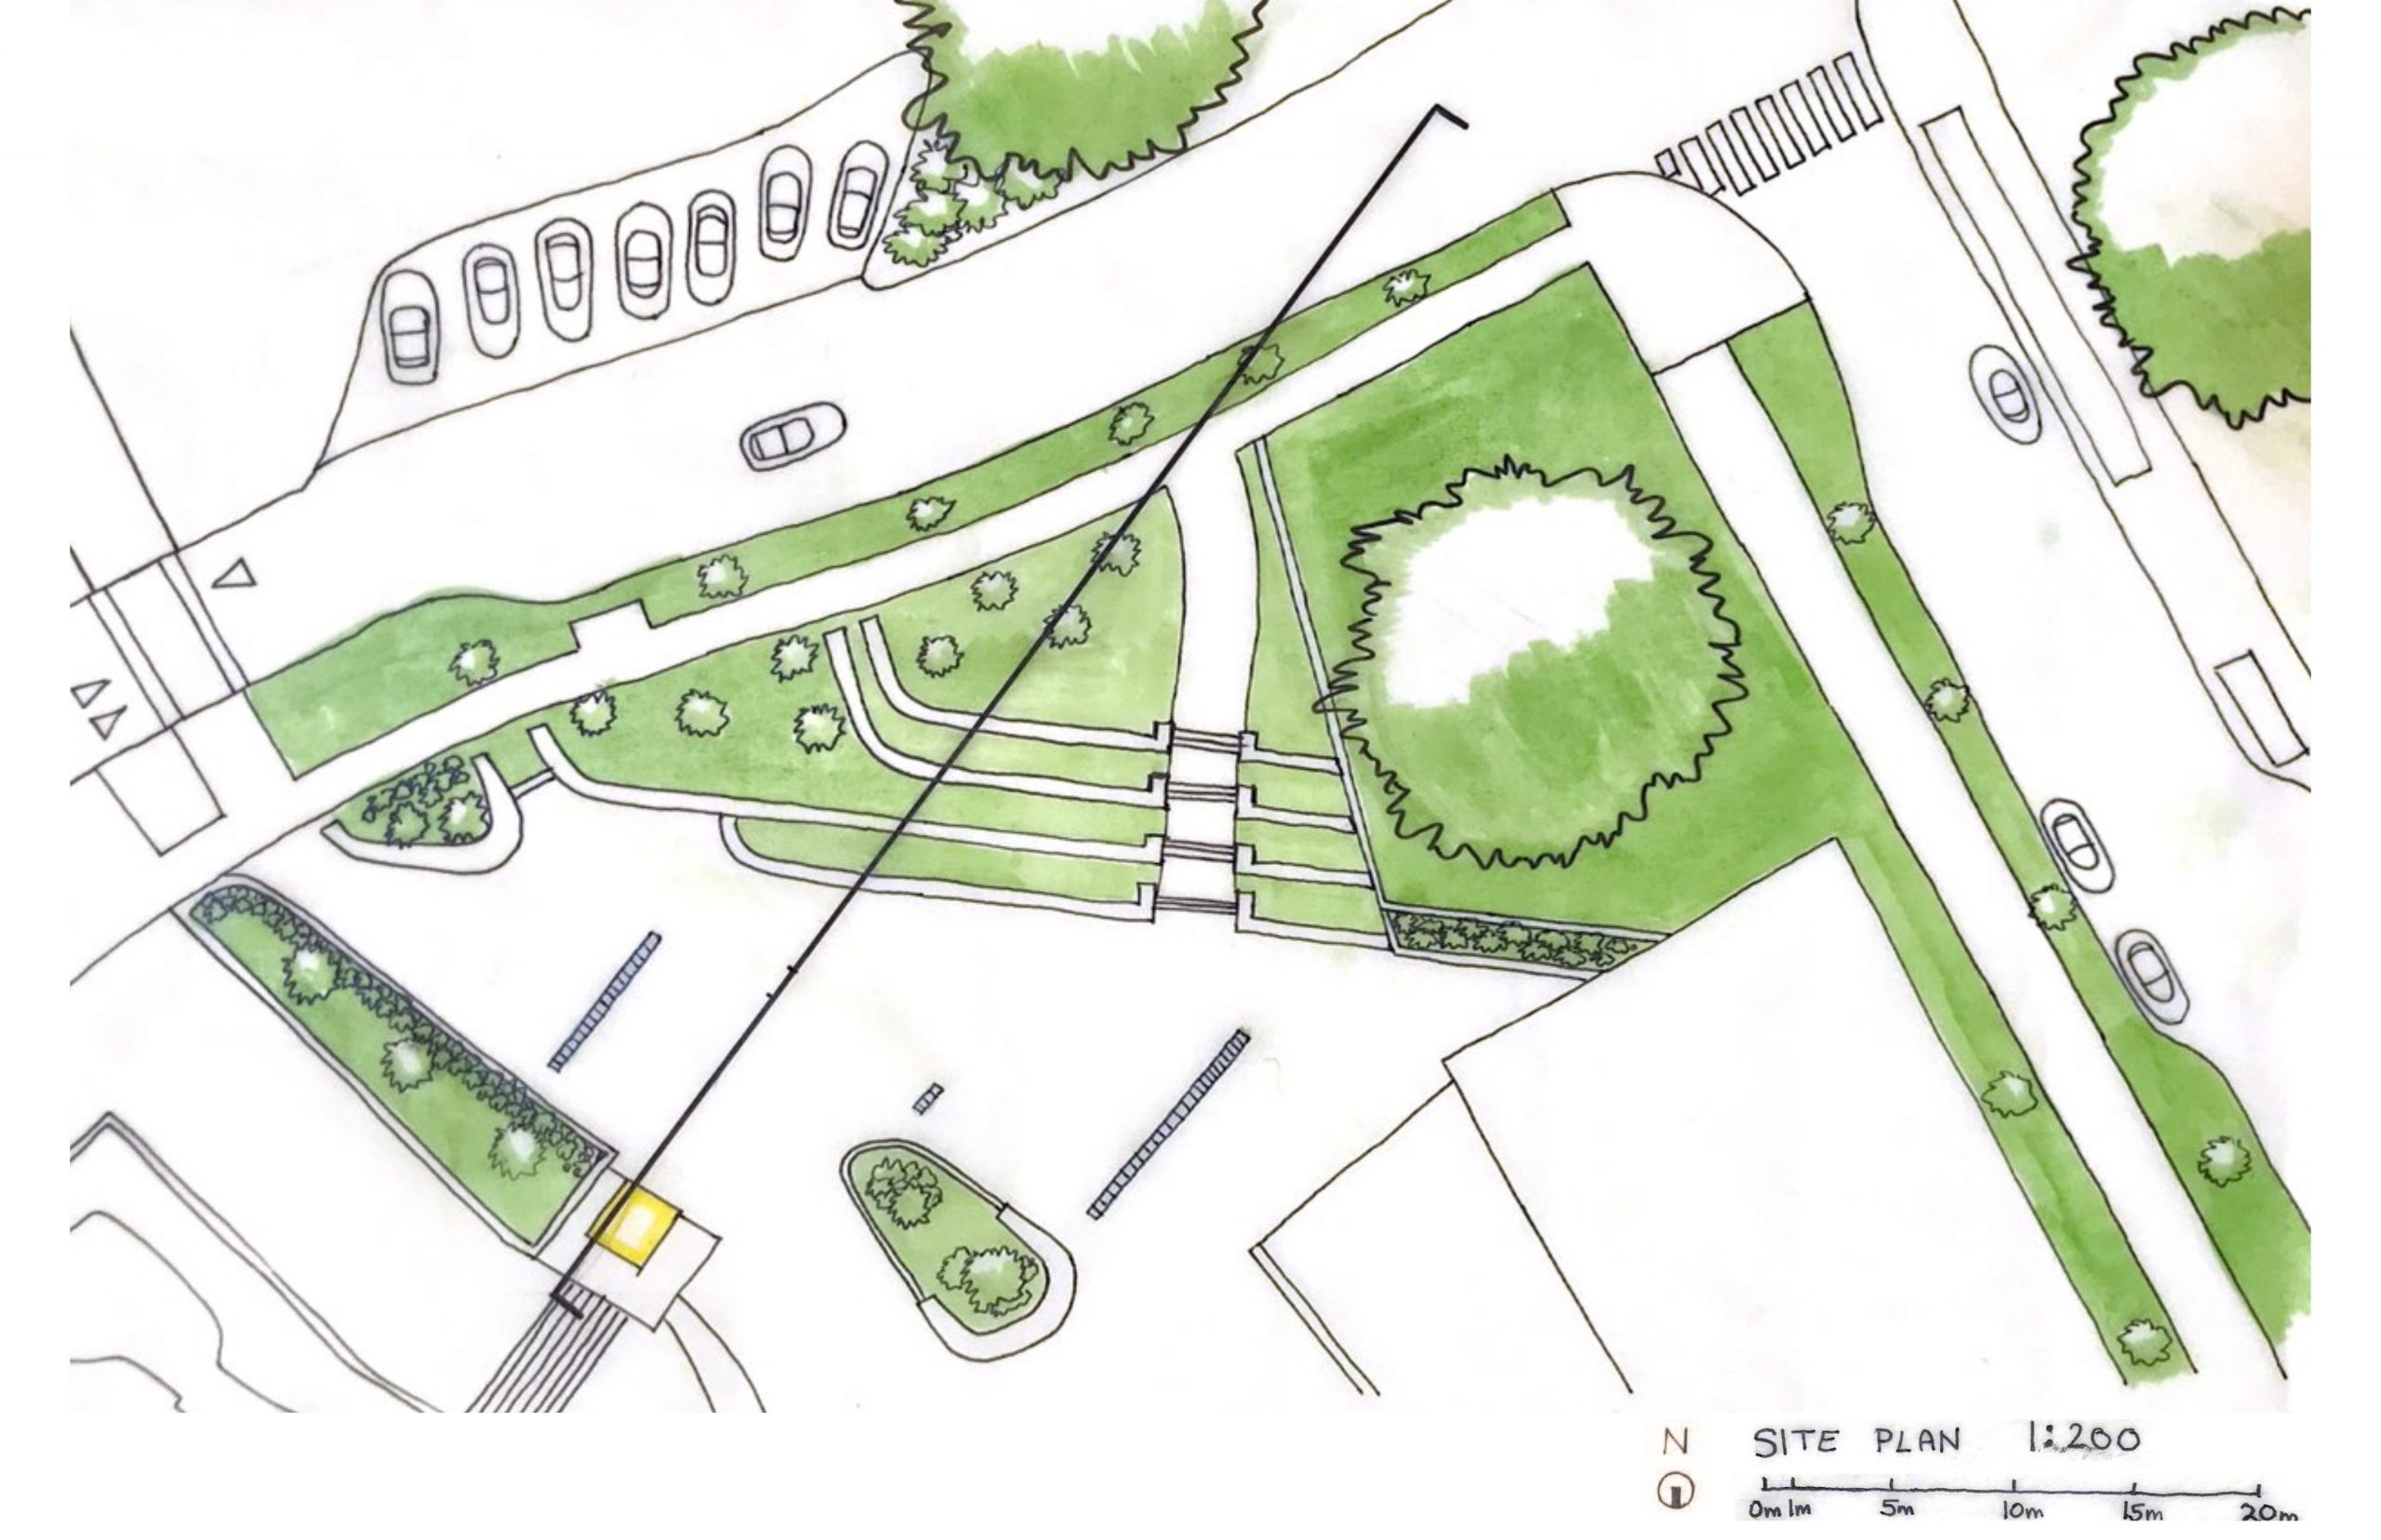
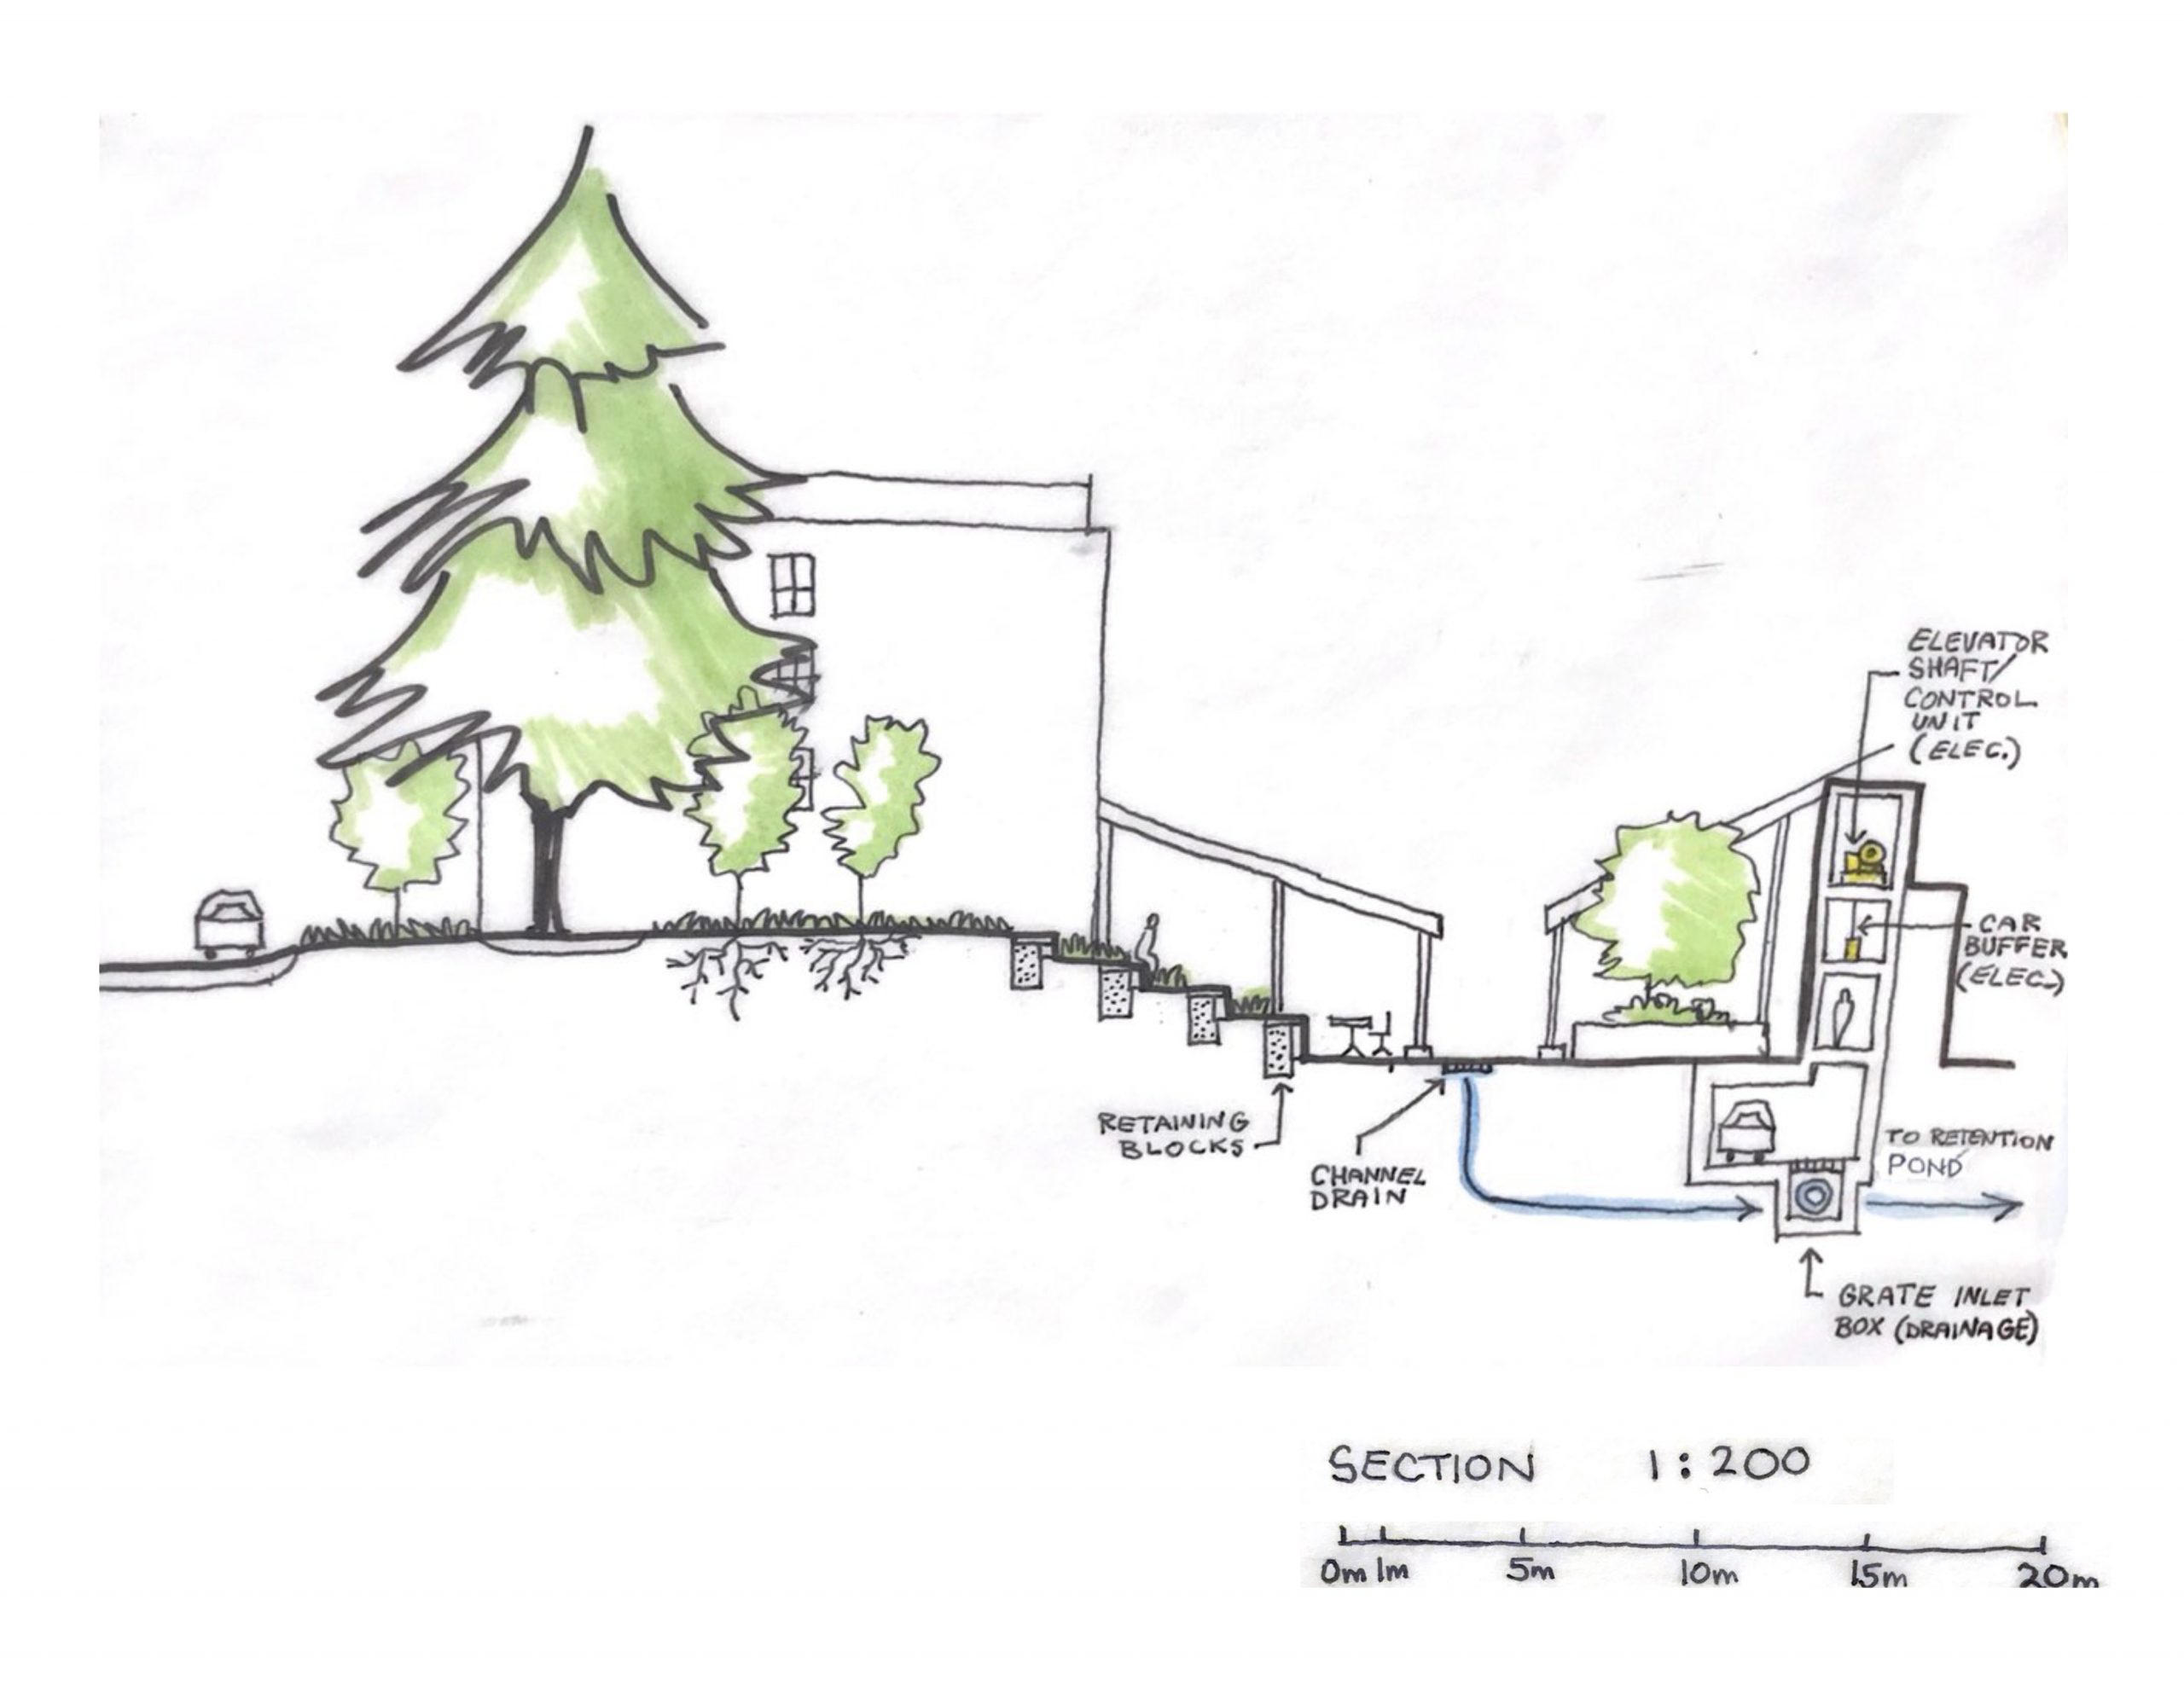
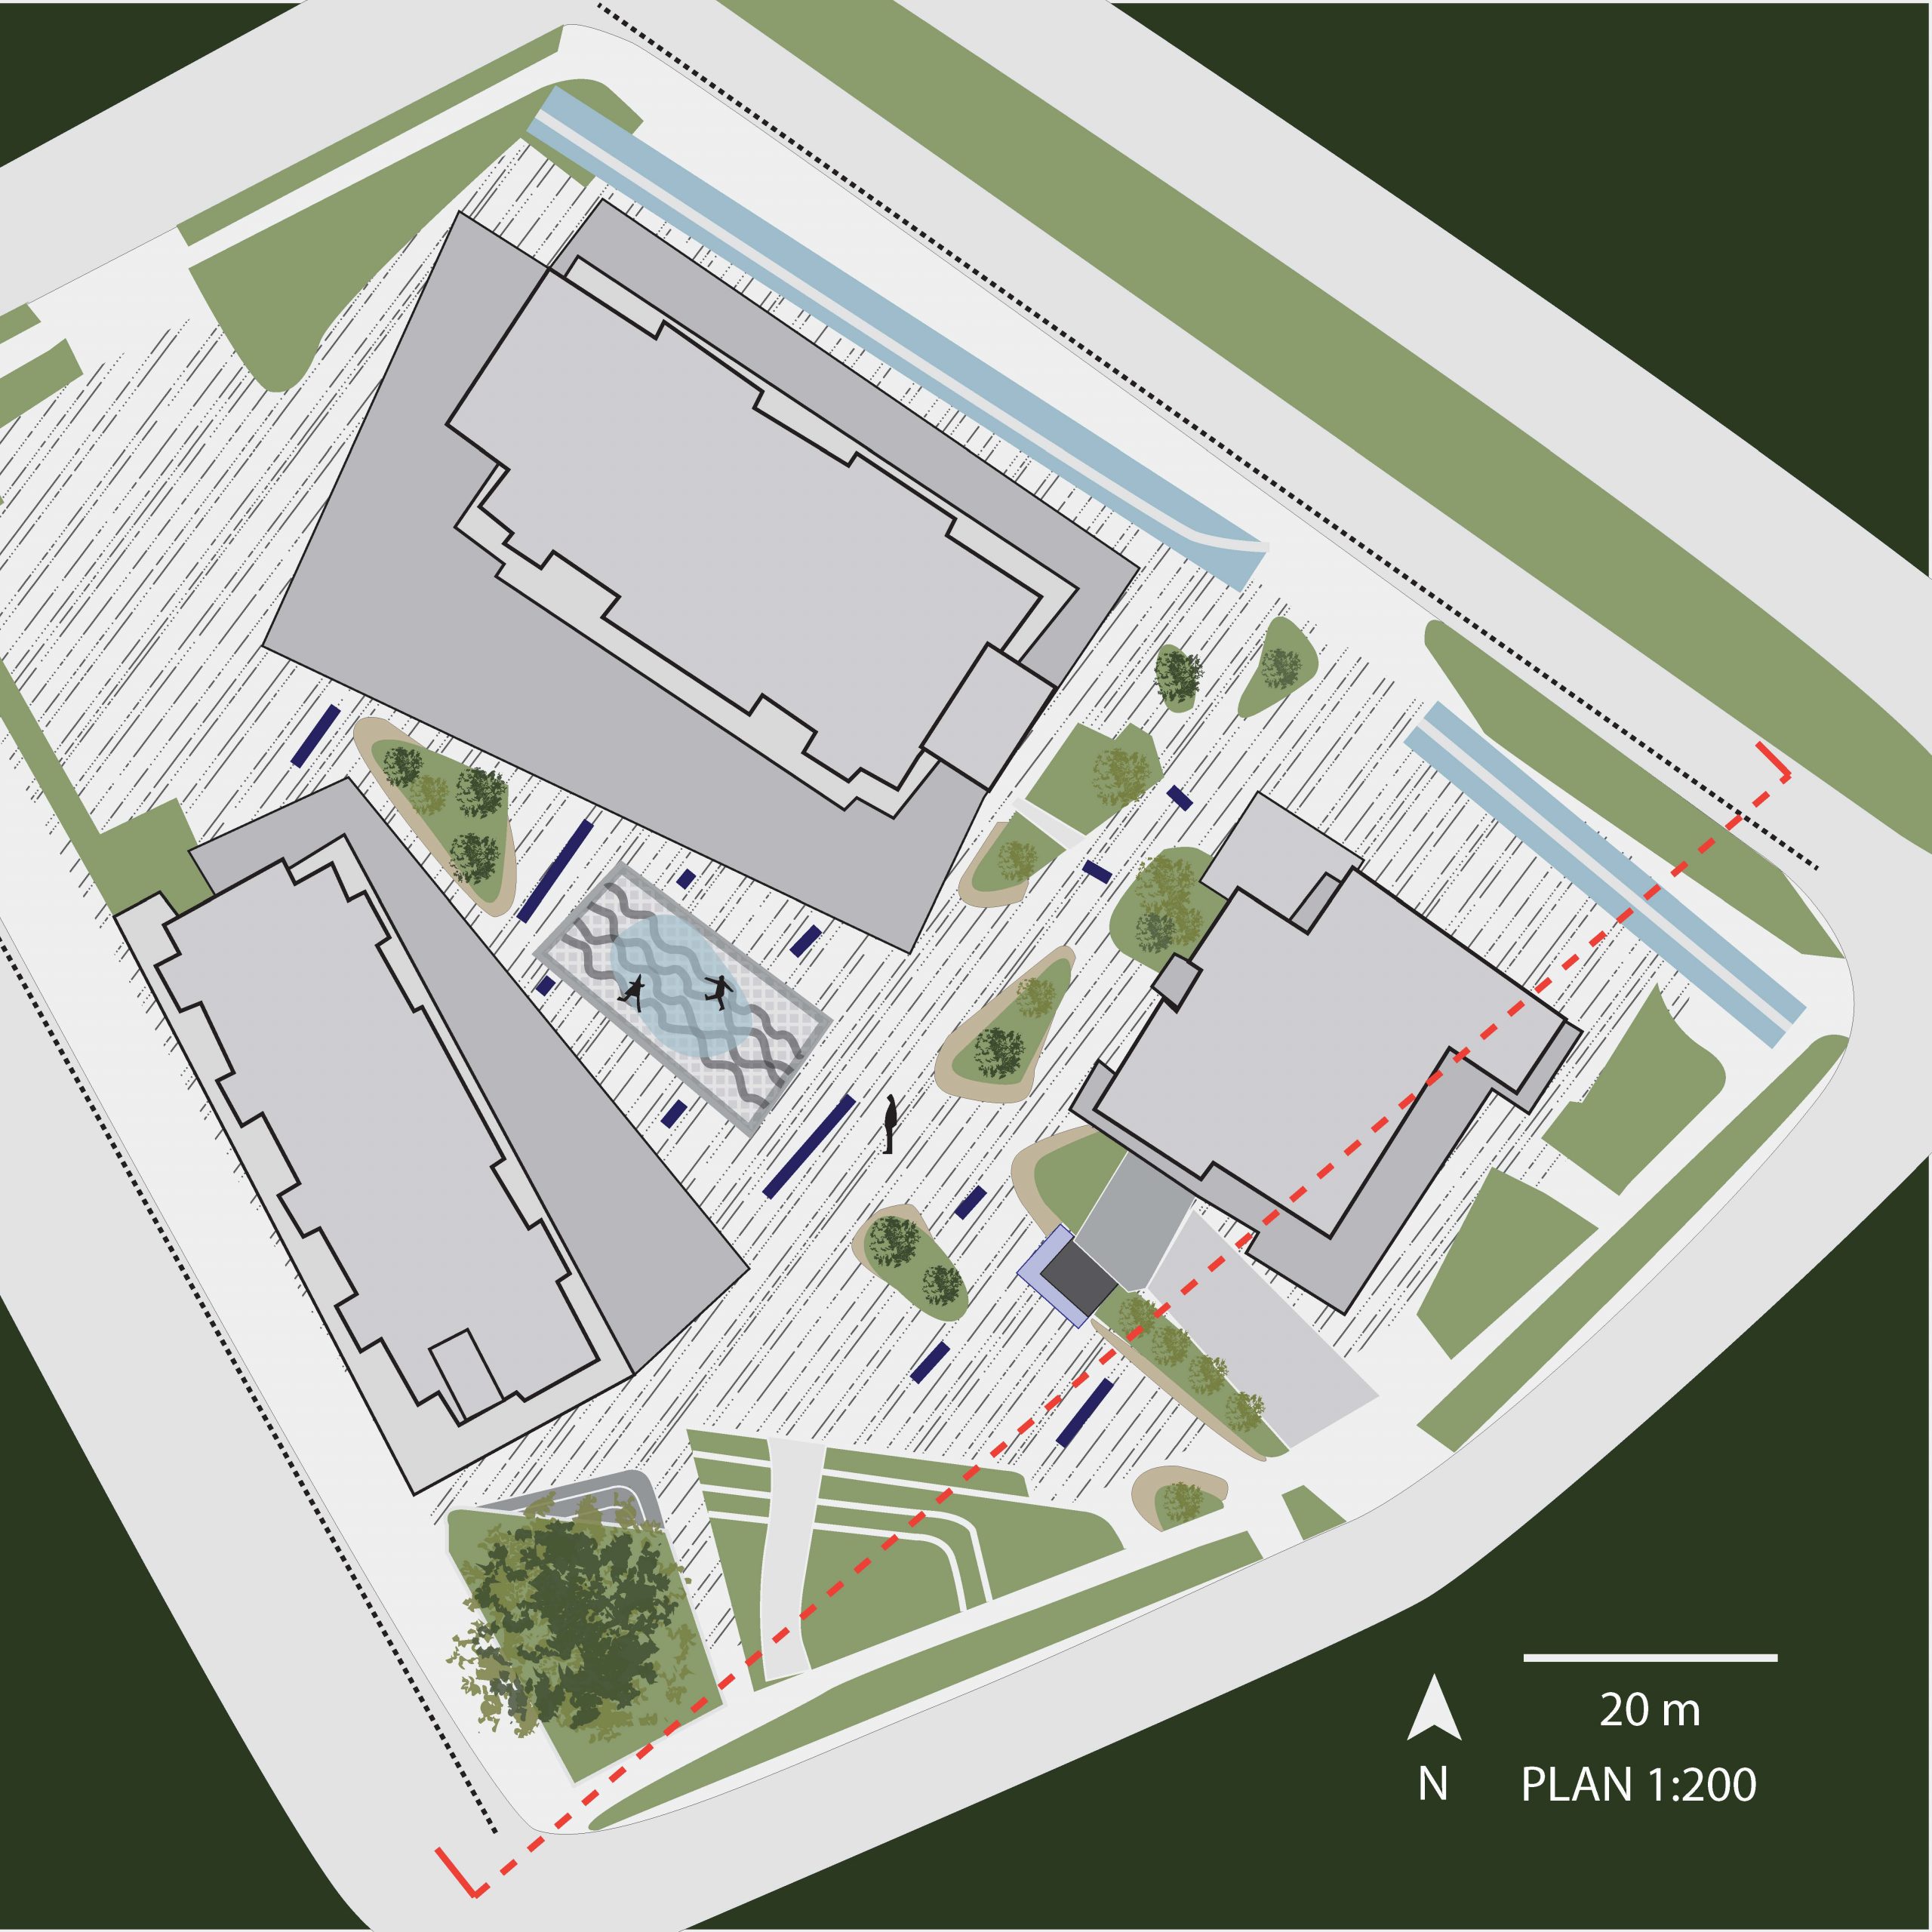
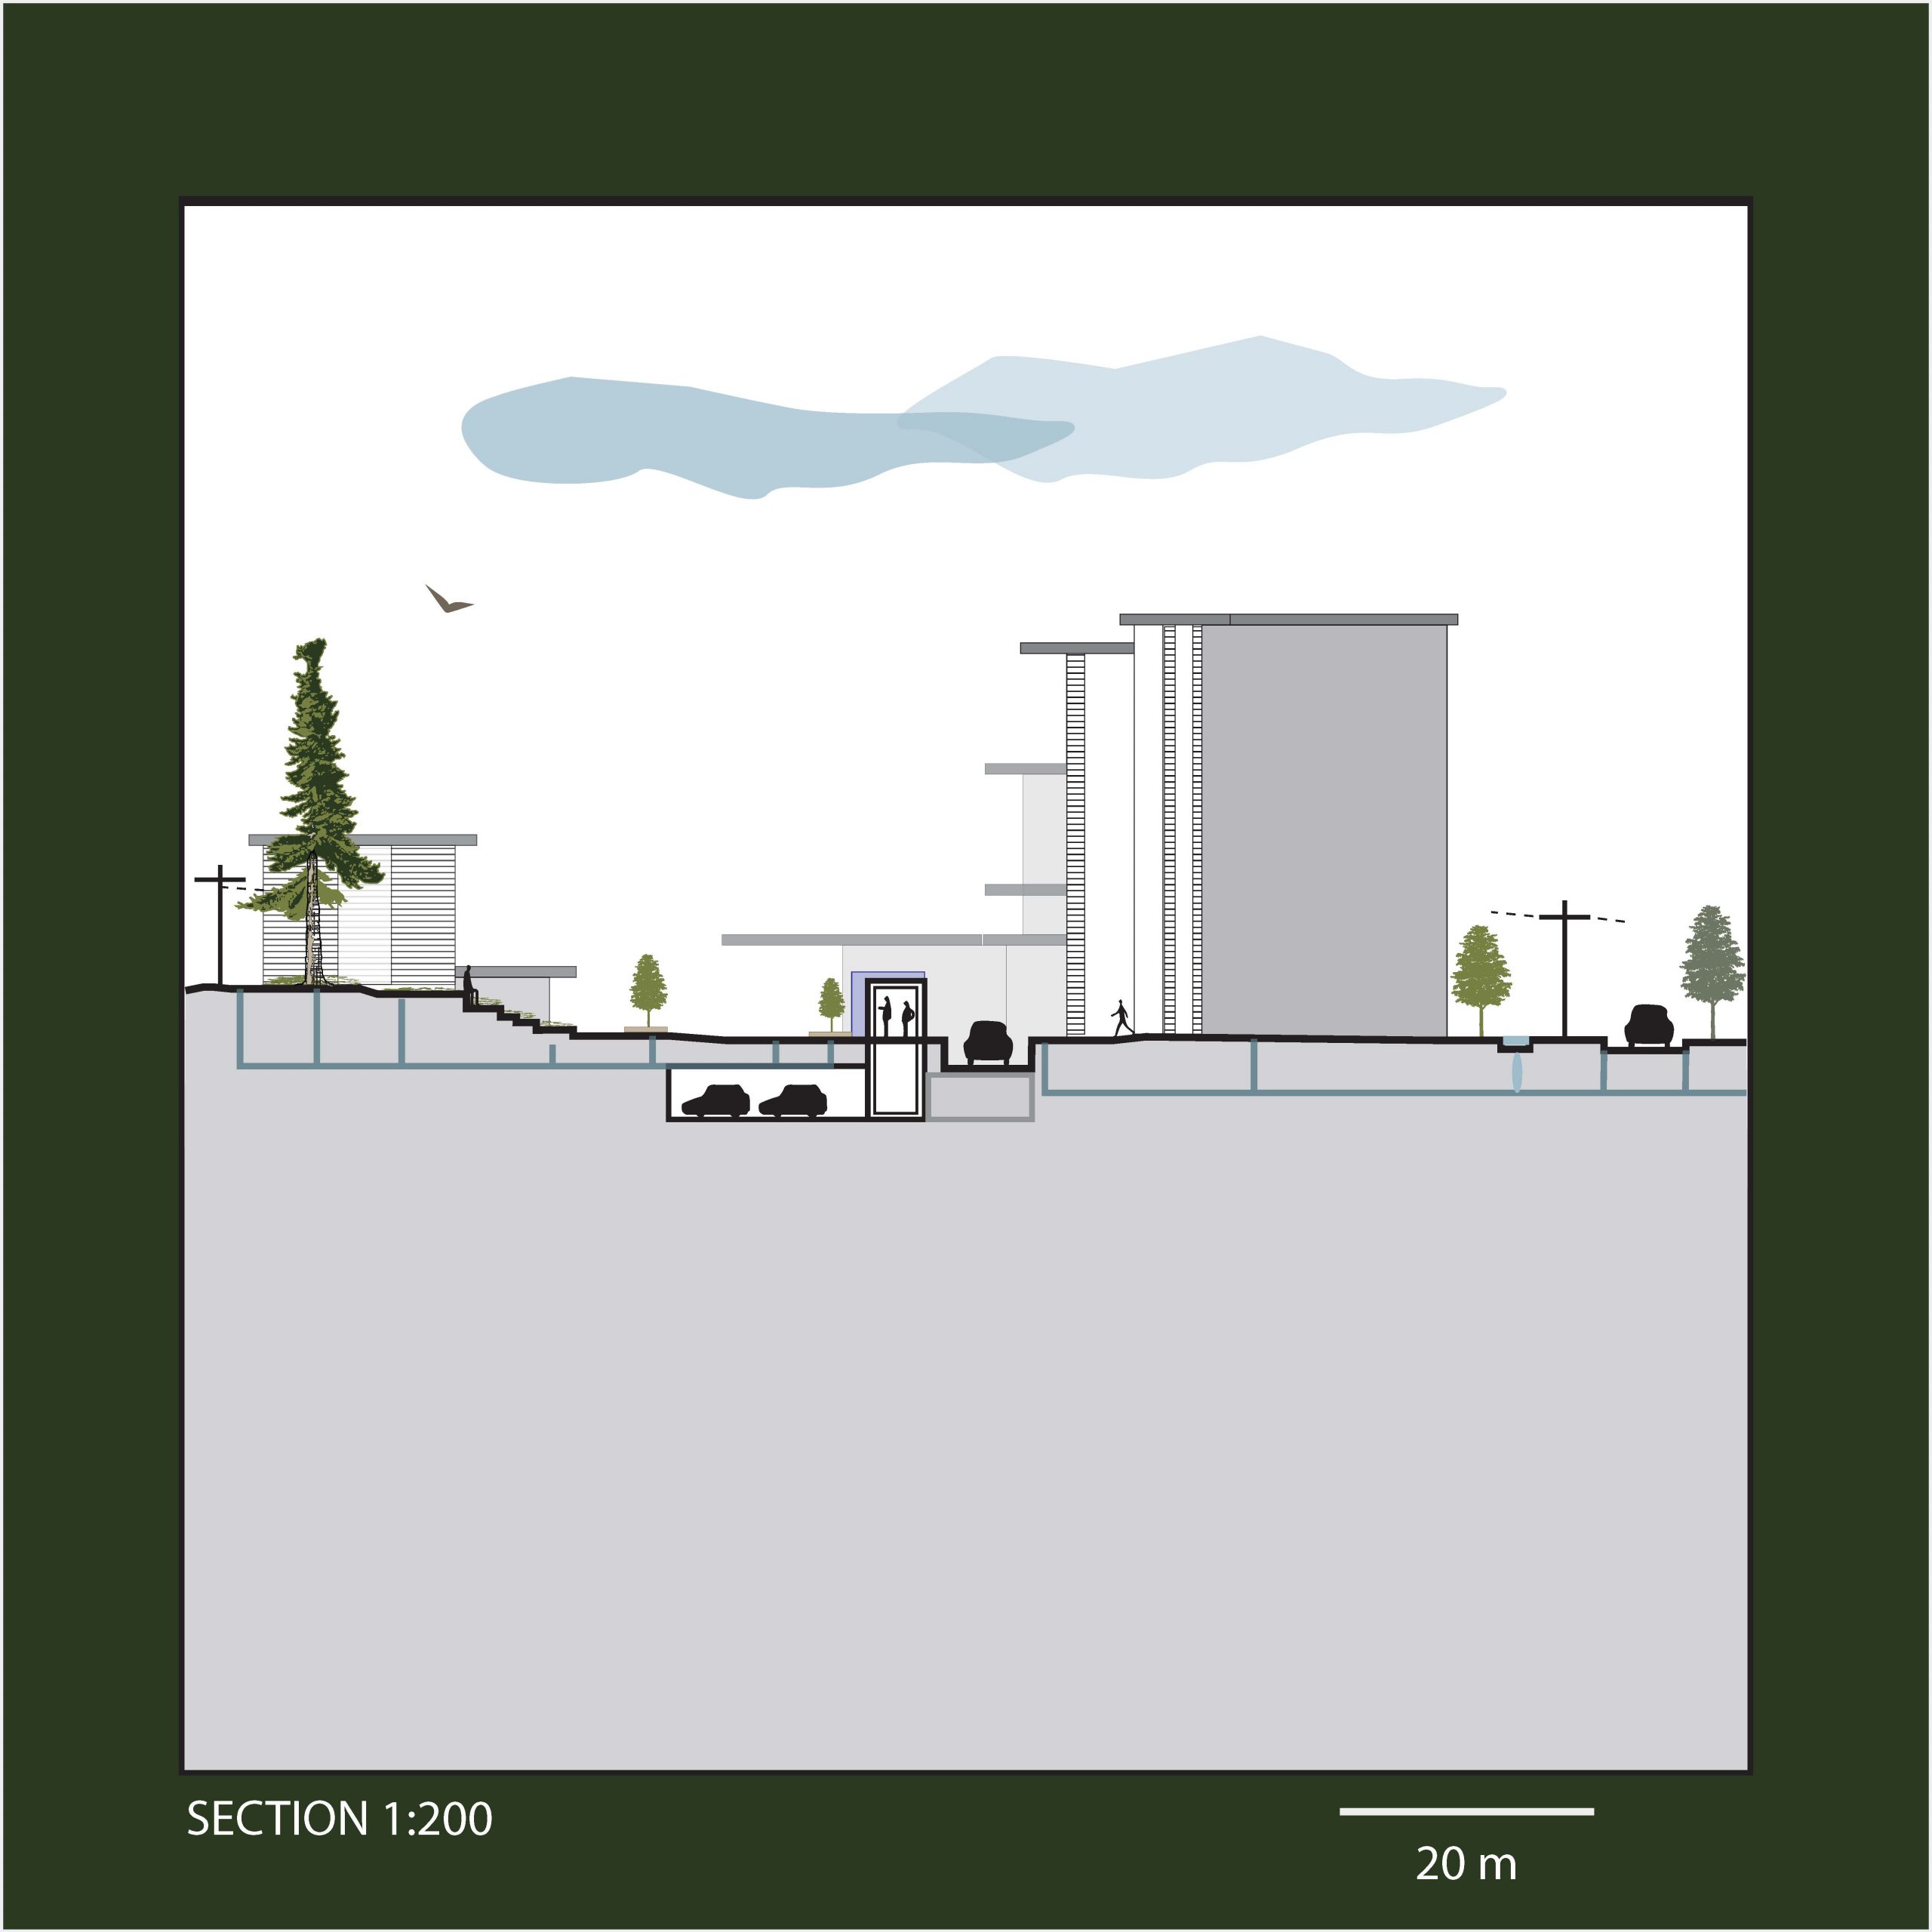
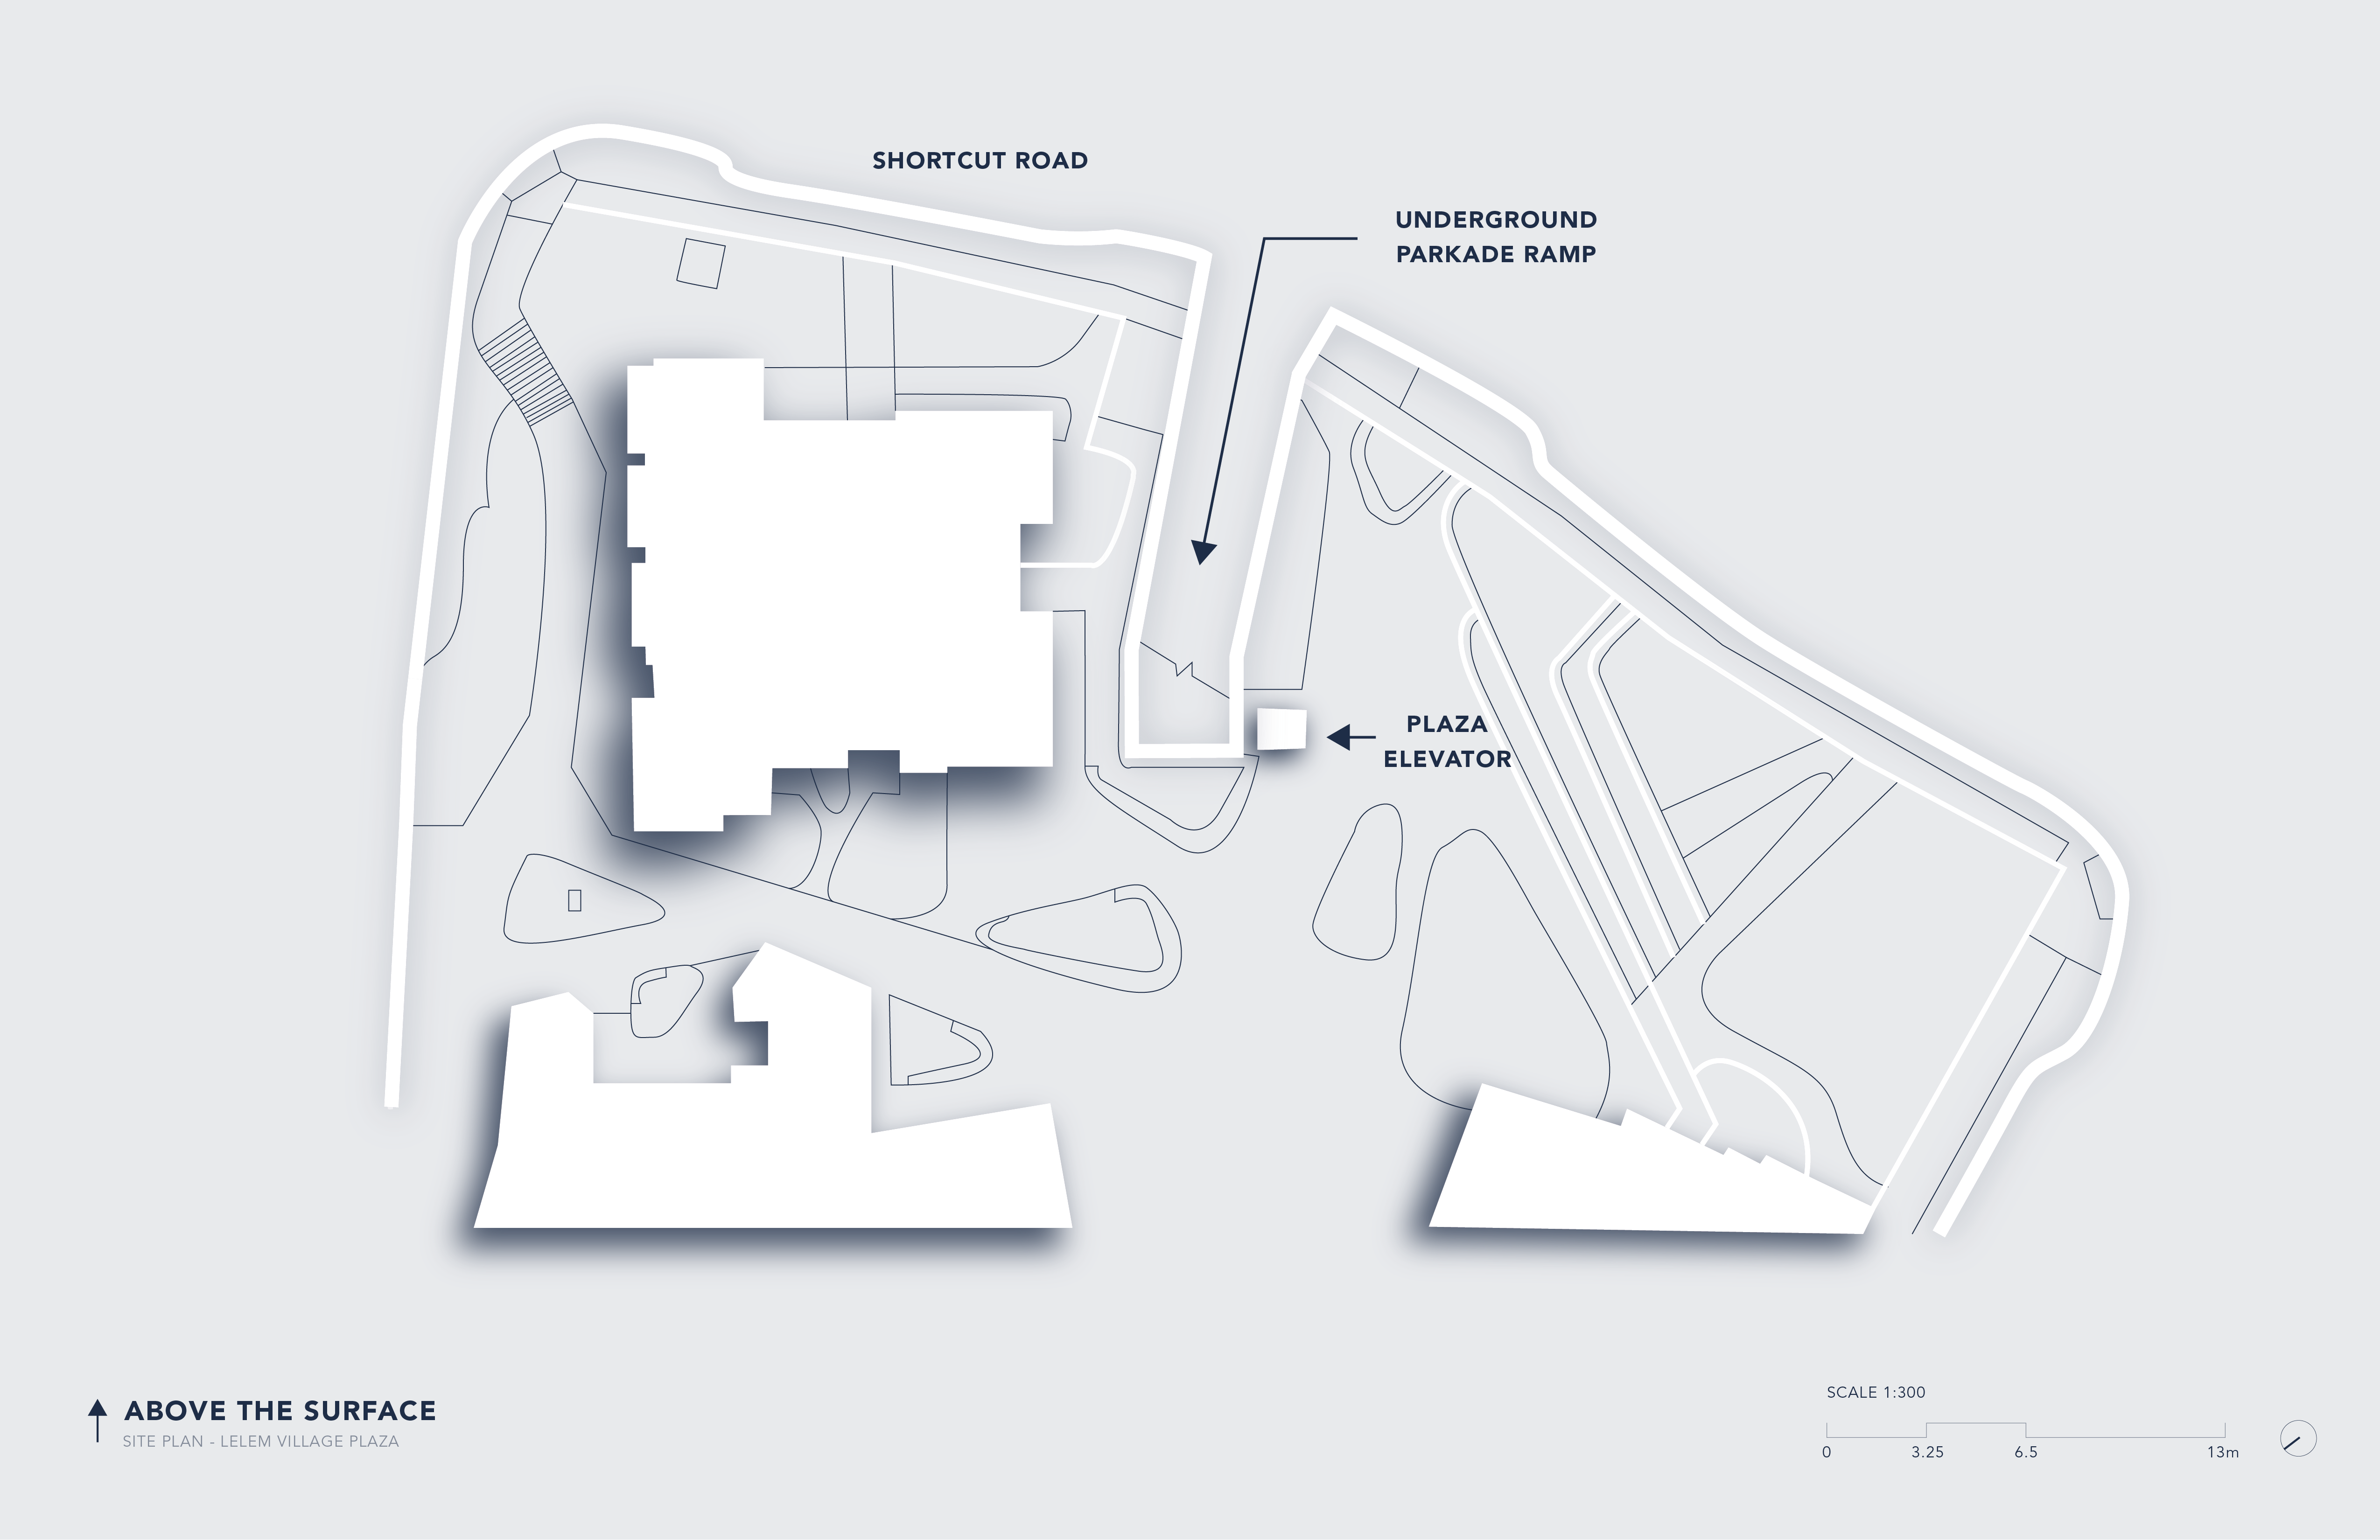
- 1:200 Site Plan & Section
- Cube axonometric demonstrating your understanding of the cube method
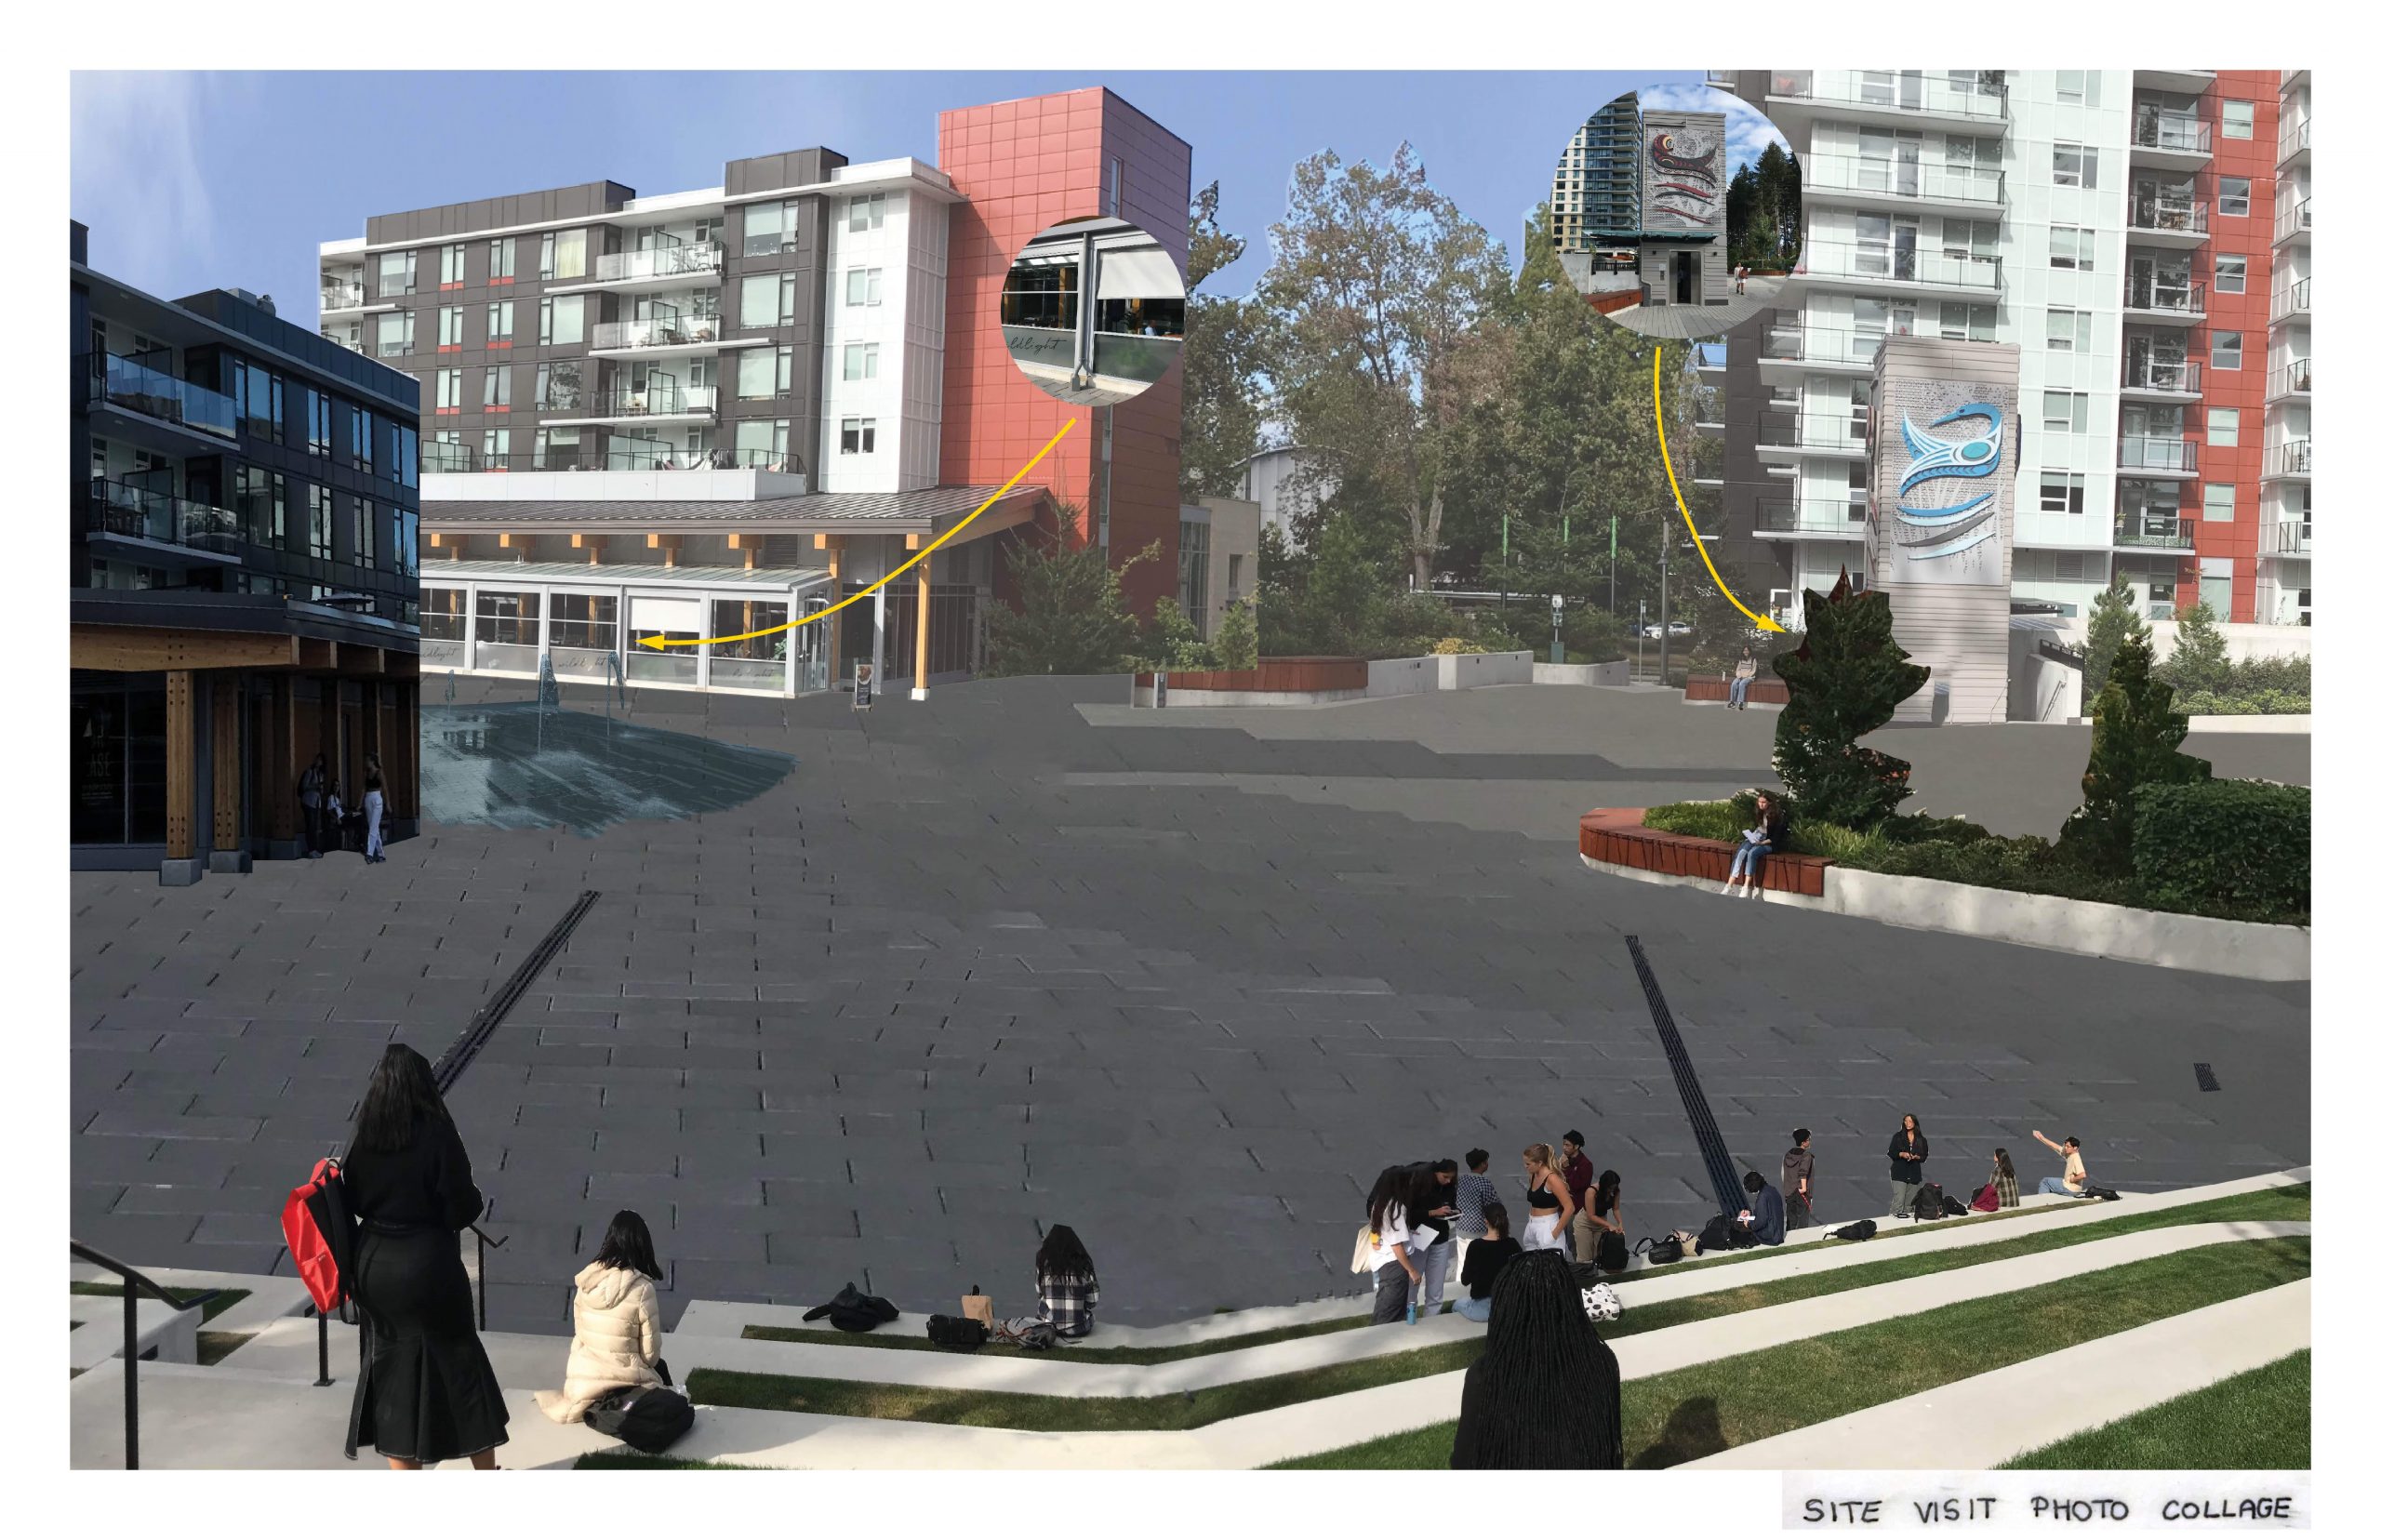
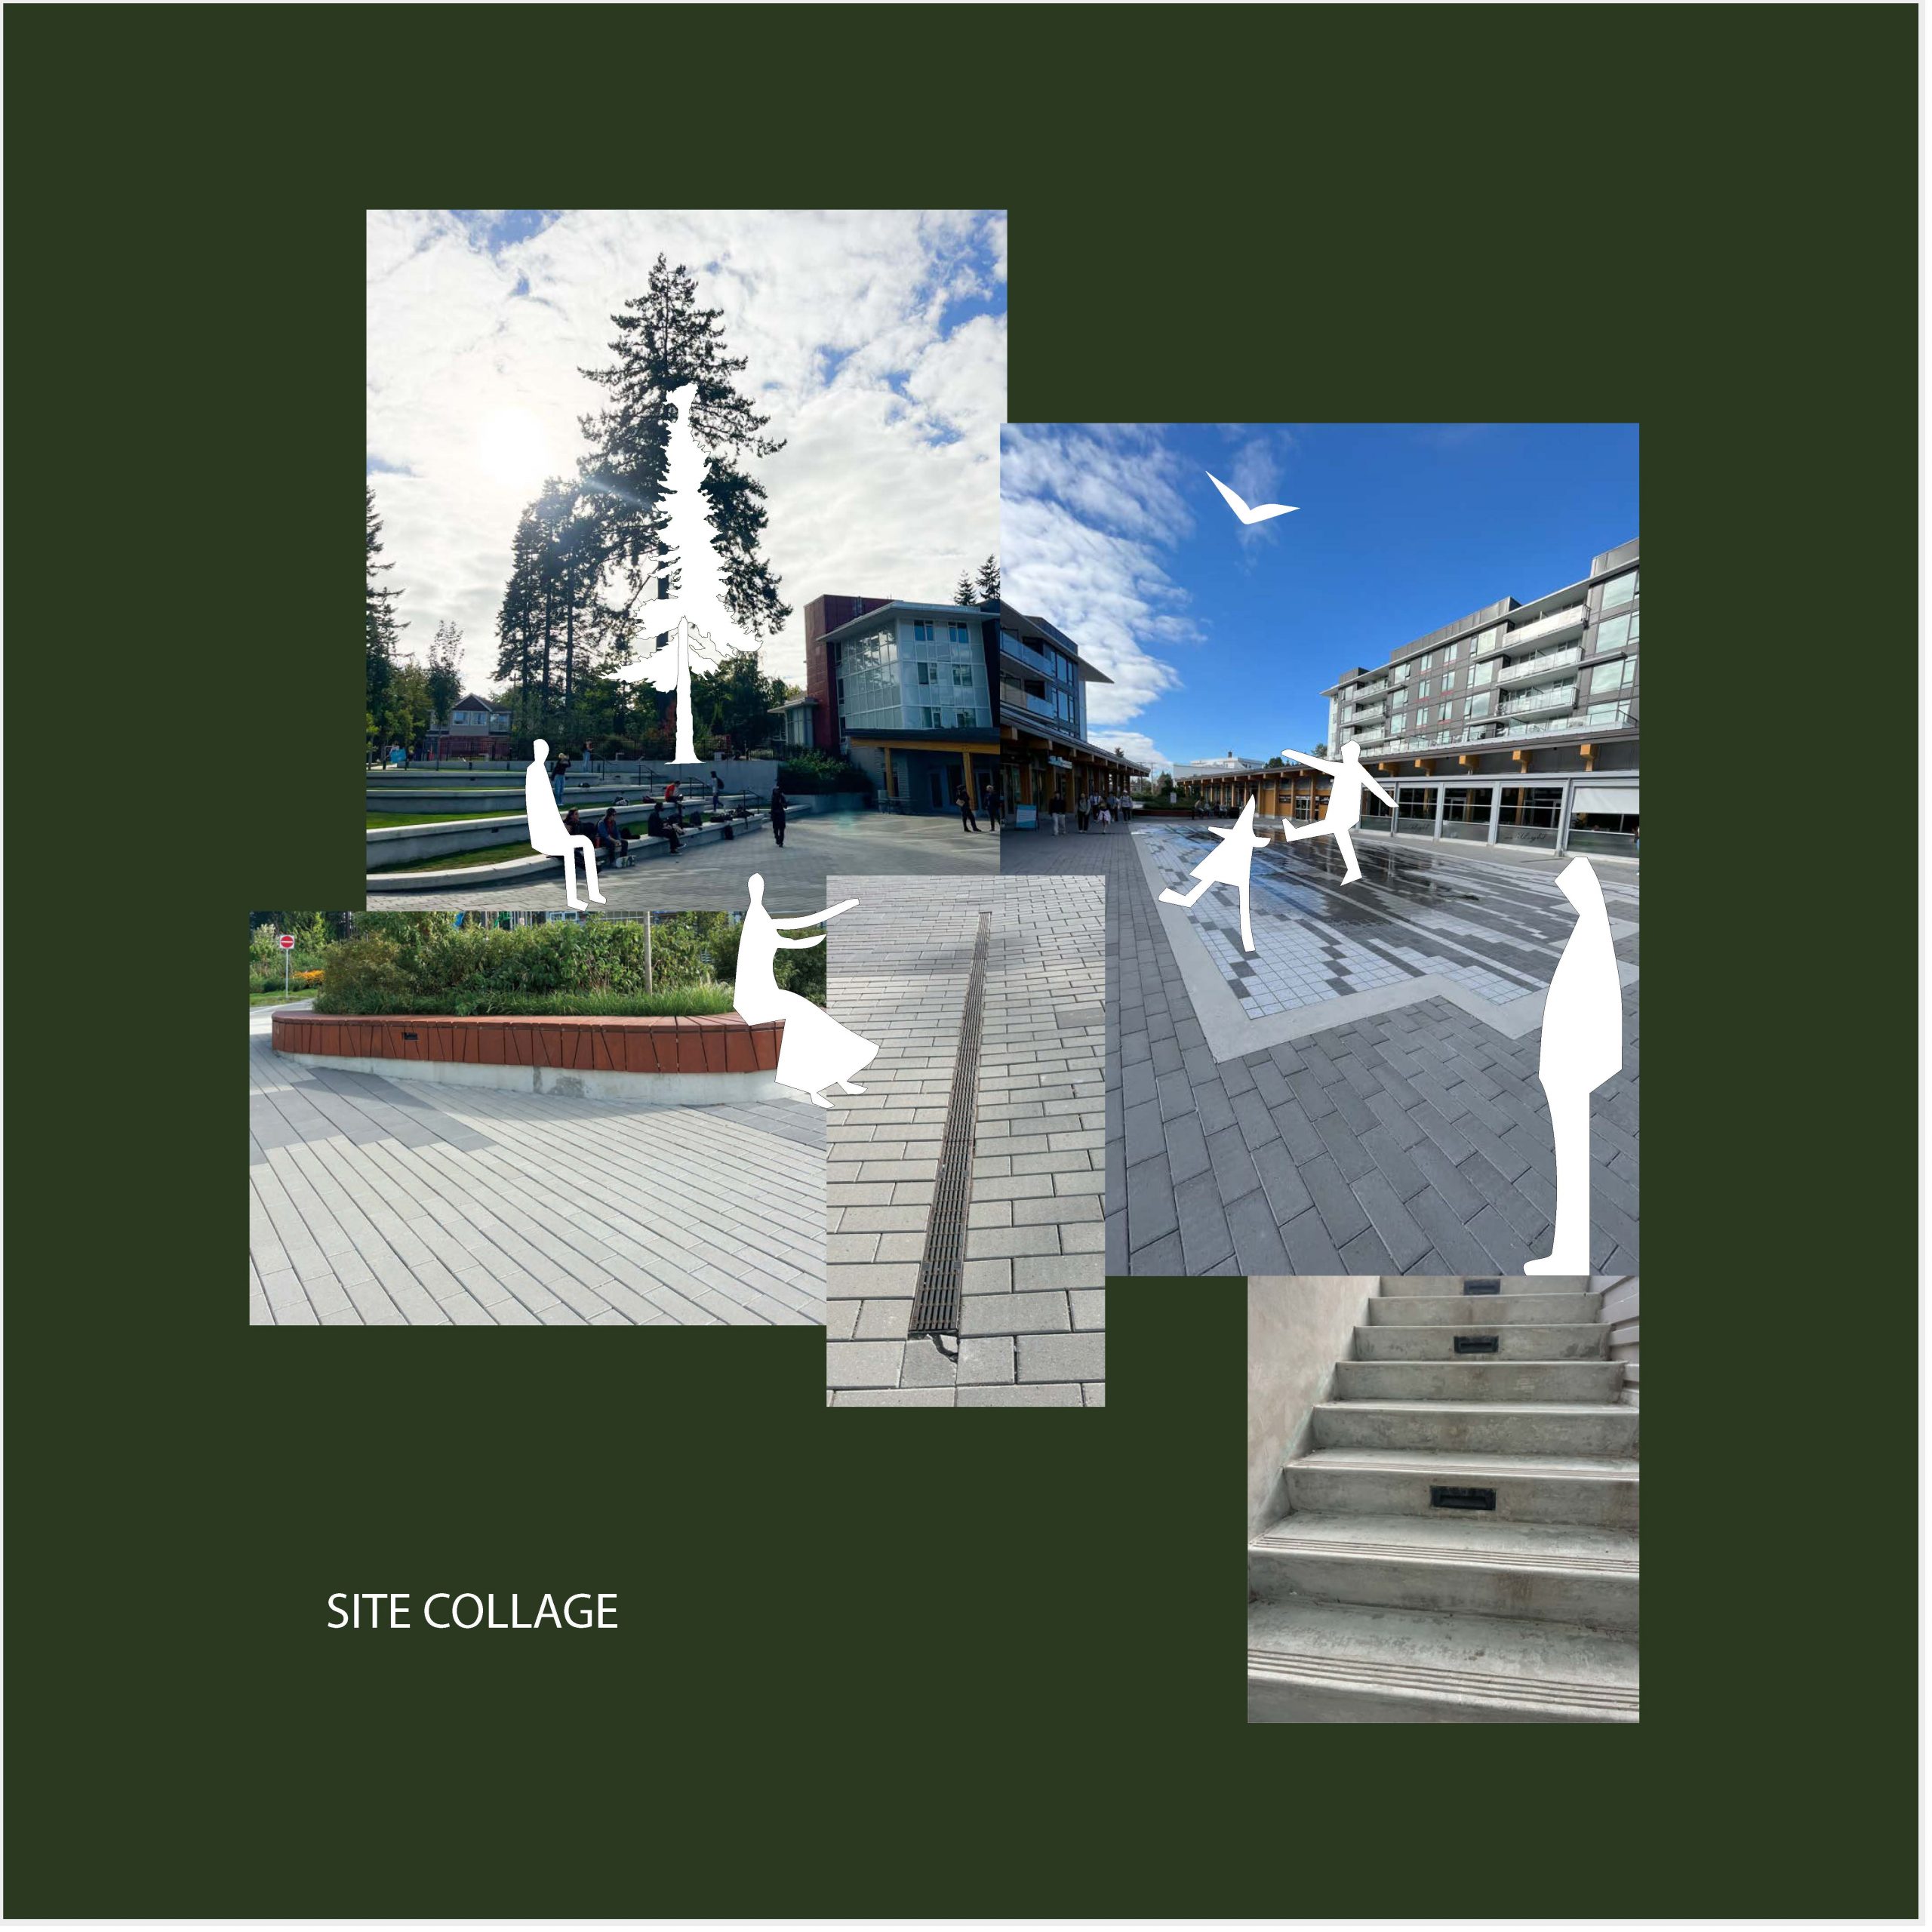
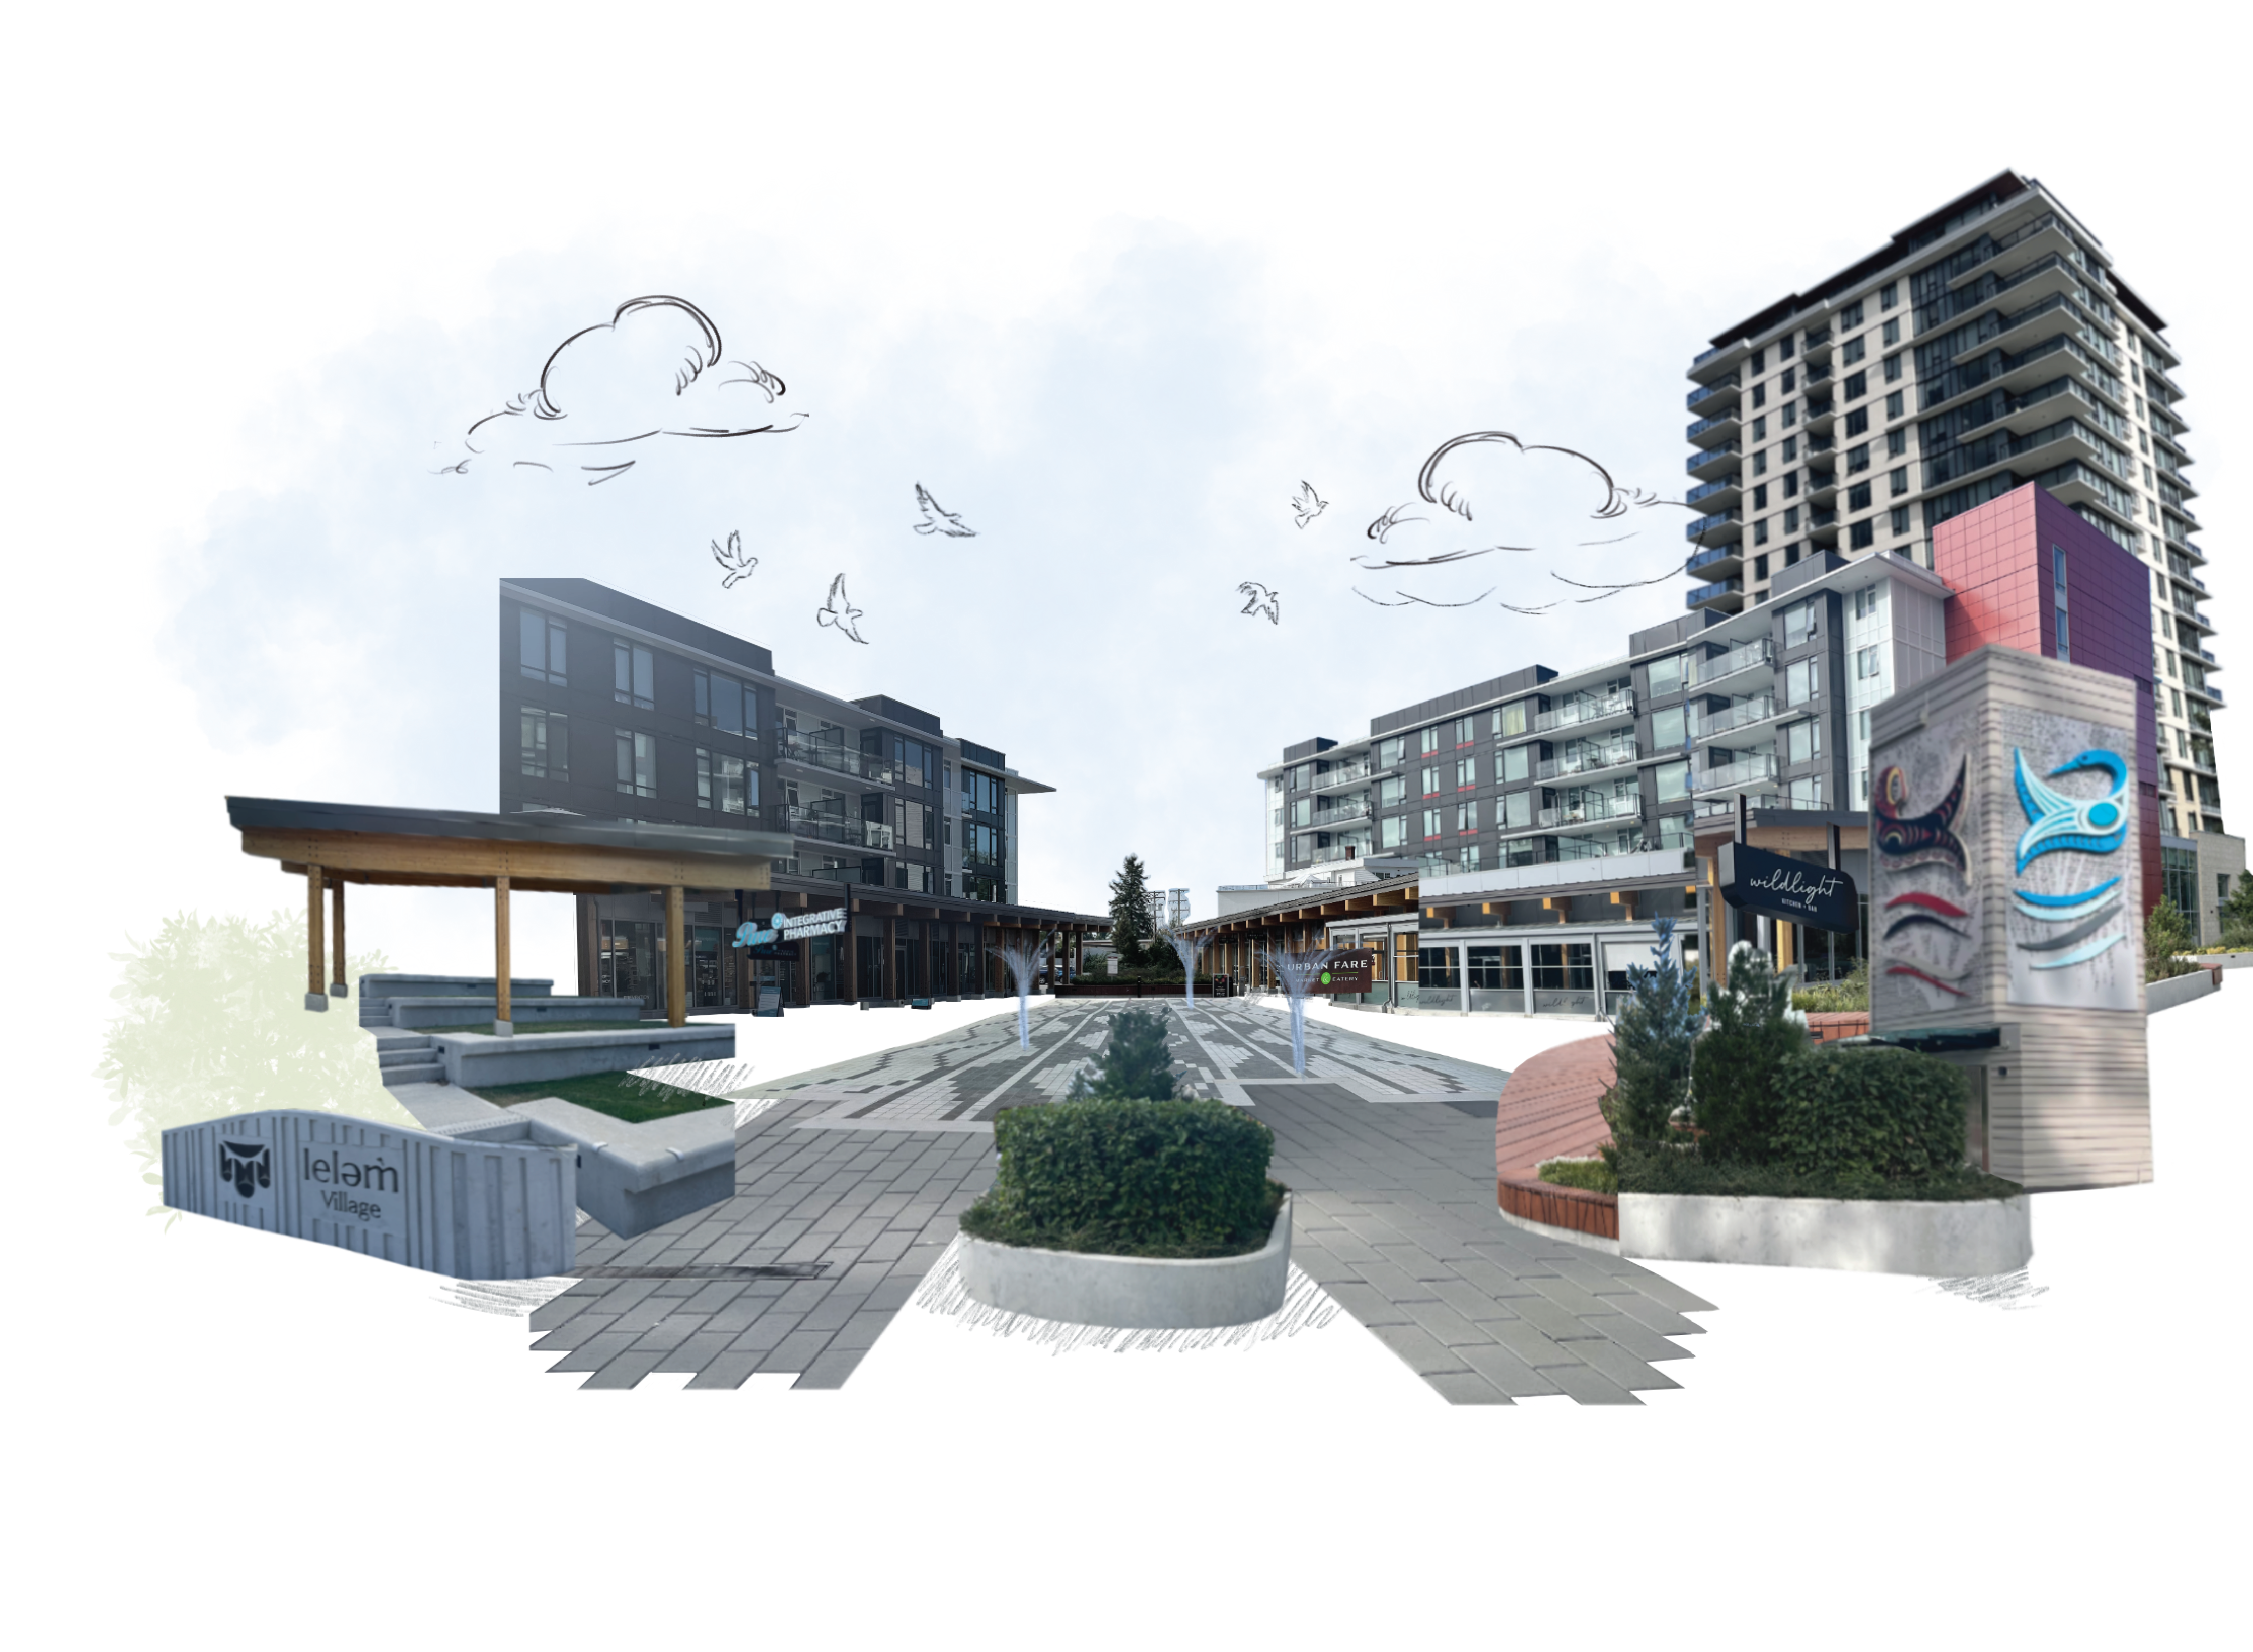
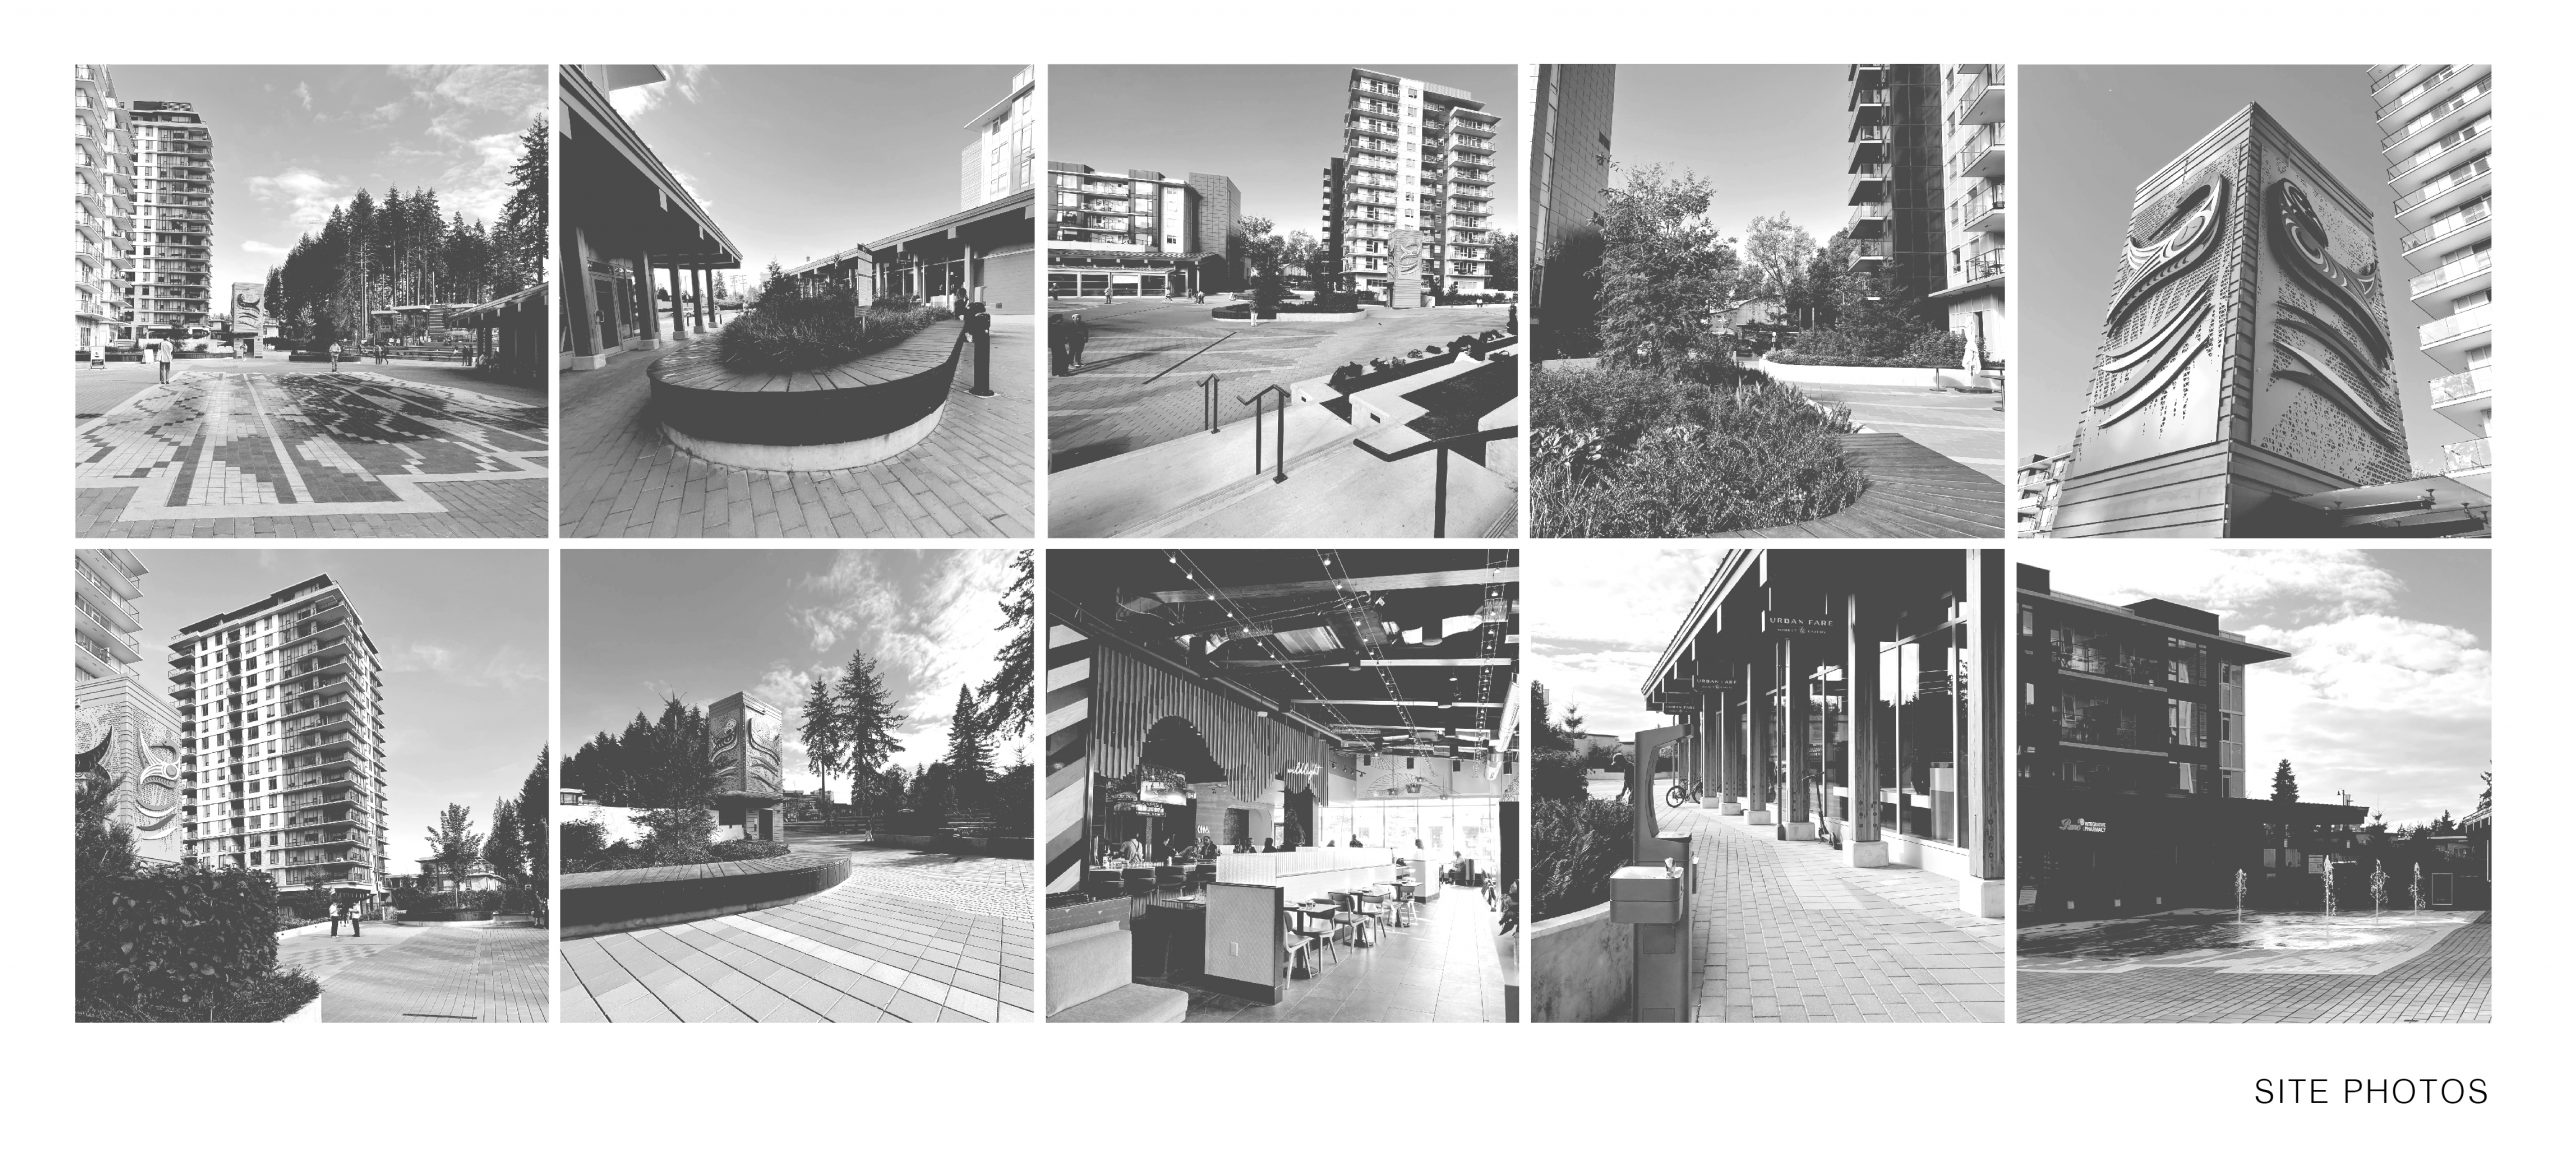
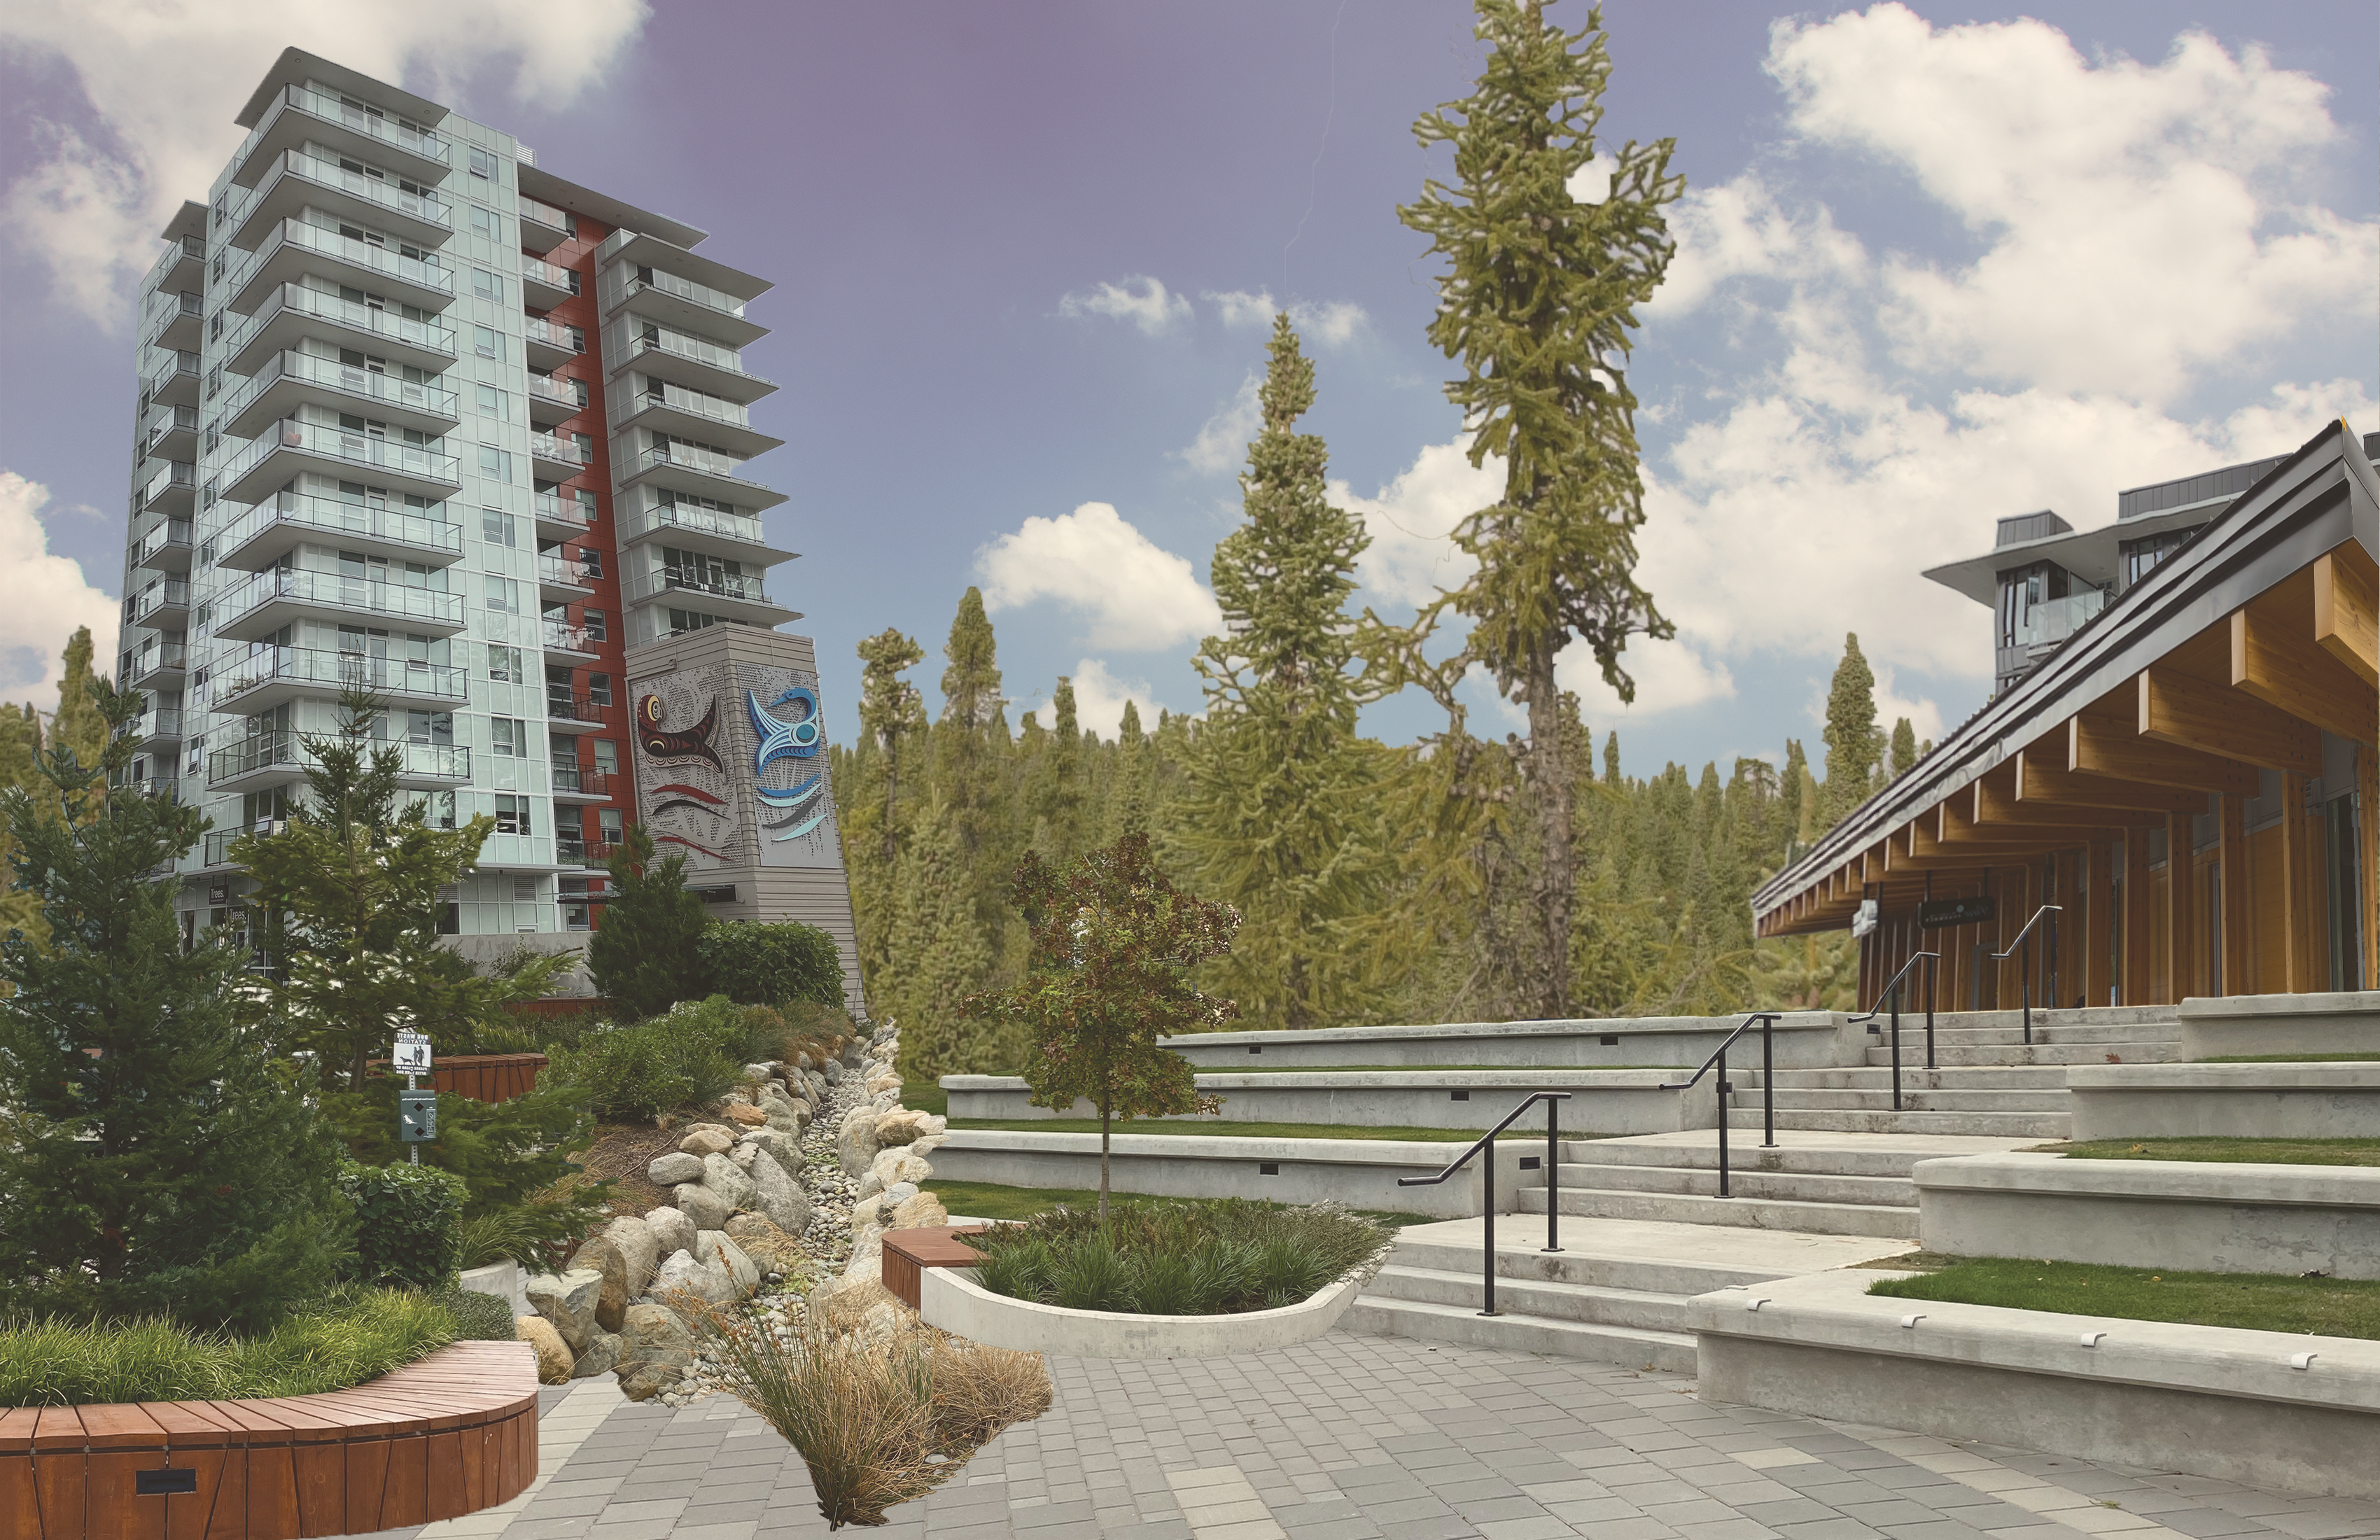
- Photography/Collage documenting your site visit
Ensure the scale of your drawing is clear. Include a scale bar and north arrow when appropriate. The deliverables can be drawn analog, digitally or as a combination of both.
Please submit your work to the blog by Tuesday, September 19th at 11:59 pm.
* In general, the number of deliverables is flexible for this course. We encourage students to make their own decision about what drawings are needed; the deliverables are a suggestion. For example, students may wish to alter the scale or add additional drawings to explain their observations.
References:
Required:
City Protocol [cityprotocol]. (2013, July 17). City Protocol – anatomy of city habitat [Video]. YouTube. https://www.youtube.com/watch?v=zs_sNEfzvVY
Lehrman, B. (2018). Visualizing water infrastructure with Sankey maps: A case study of mapping the Los Angeles Aqueduct, California. Journal of Maps, 14(1), 52–64. https://doi.org/10.1080/17445647.2018.1473815
TED Conferences [TED]. (2017, November 30). The biggest risks facing cities – and some solutions | Robert Muggah [Video]. YouTube. https://www.youtube.com/watch?v=Sv5QitqbxJw
Recommended:
Salazar Miranda, A., Fan, Z., Duarte, F., & Ratti, C. (2021). Desirable streets: Using deviations in pedestrian trajectories to measure the value of the built environment. Computers, Environment and Urban Systems, 86, 101563. https://doi.org/10.1016/j.compenvurbsys.2020.101563
- Explore the online tool here: https://senseable.mit.edu/desirable-streets/
- Also check out: https://streetmix.net
DES430 2022 Student Examples:
Bea Benidy: https://blogs.ubc.ca/des430x2022w1/2022/09/20/assignment-02-bea-benidy/
Ghazal Torkamaniha: https://blogs.ubc.ca/des430x2022w1/2022/09/20/a2-ghazal-torkamaniha/