Survey Results
We would like thank everyone for completing the survey. It is still open if there is anyone who has not completed it yet and would like to do so. Limitations of the basic plan do not allow for any chart creation or to actually share the link to the results page since it would require a login account. We have taken screen shots of the response summaries and will share them below with a brief analysis of the results and would encourage any comments you have about what may or may not have suprised you.
Occupations
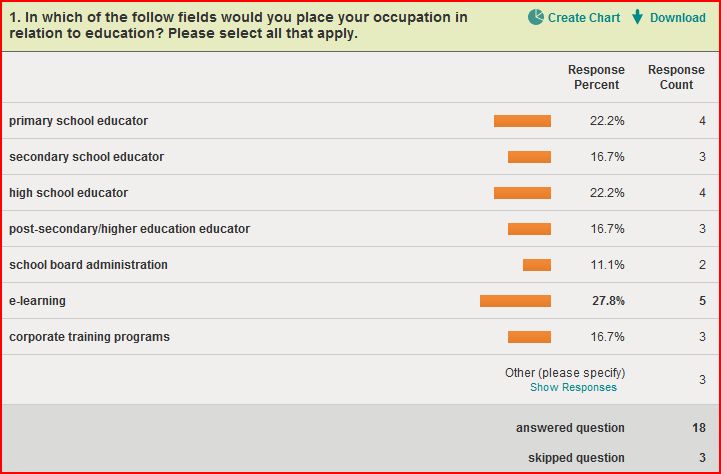
This question was aimed at assessing the education “market” (limited to the areas represented by those in class) and the various areas that we represent. I realized afterwords that I should have included a response for “student”, but this came up in the 3 “other” responses which included 2 “student” and 1 “tutor” respones.
Ownership
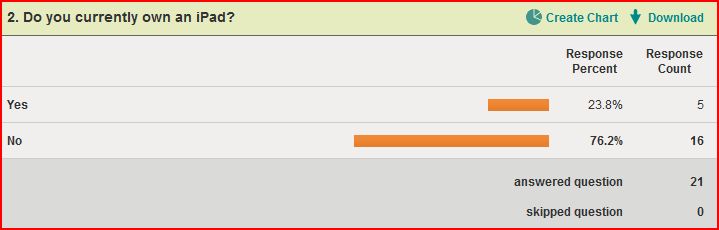
What is interesting here is the number of “No” responses. A follow-up question we would have is why many have not chosen to invest in this technology? Price? No felt need? PC users not wanting to switch?
Educational use of iPad
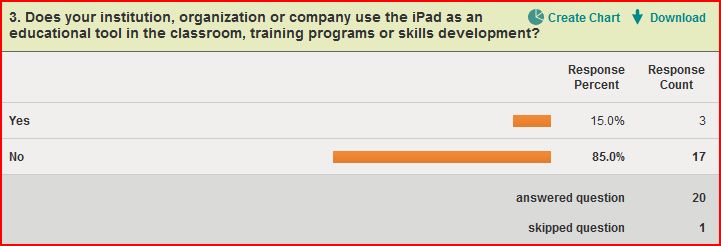
I am not sure whether this question was made clear enough in that it was not dependent on individual ownership and this may have affected the results. Nevertheless, it is interesting to see that over 85% of us have not used this device in our current educational work settings. Follow-up questions here may look at what is being used with regards to educational technologies. We may then begin to assess why the iPad has not been able to replace other technology in use.
Frequency of use
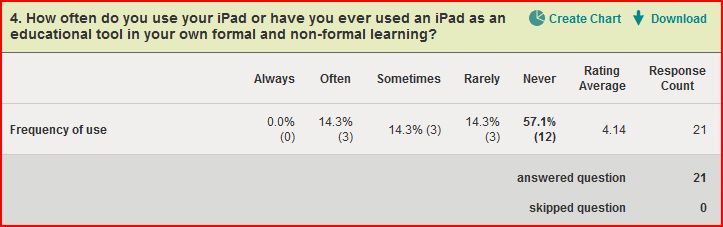
This question, although not entirely dependent on ownership, is however dependent on access. The 3 “often” responses are likely from those that own the ipad or use it frequently in their work. I would be interested in seperating individual responses to see whether anyone owns or frequently uses the iPad but responded here with “sometimes” “rarely” or “never”.
Frequency of various uses in education
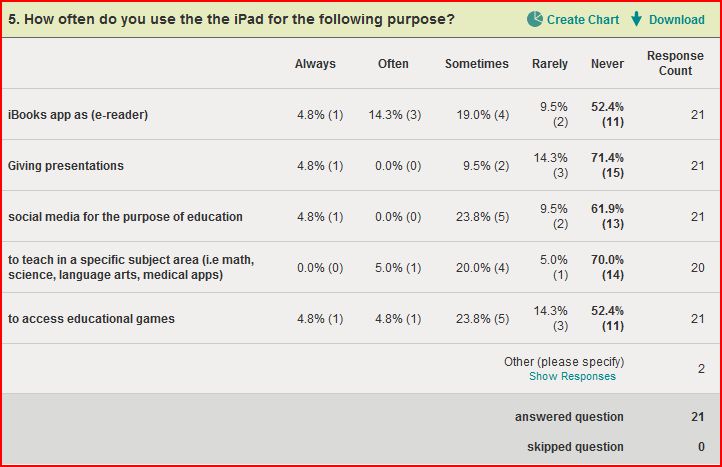
Again this question is linked to, but not dependent on, ownership but more so access. Since most of the responses fall under “sometimes” it is this response that interests me as it gives the clearest idea for what educational tasks we are undertaking with the device. I was not suprised to see social media use at 23.8% but I was interested that teaching a specific subject area was higher than as an e-reader and giving presentations. Is this because of applications for specific subject areas that are being taken advantage of in the classroom?
There were 3 other responses. The first response; “What about as a device to develop ideas (mind mapping, outlining)” I found very interesting and am curious to know how others might respond to this. The second reponse was that the respondent didn’t own the device and was answering based on iPhone ownership. The third was another use I had not included; “language learning”.
Limitations and Considerations:
As with any quantative research this survey was not without biases and limitations and was simply a shallow view into our class as market representatives and how prevelant the iPad is or is not within this class. The n(sample) size was only 21 so this automatically limits the extension of this data. The survey is biased in that it was administered to a class in an education technologies program, favouring use of technology to this field rather than a fair comparison of education vs non-educational uses. Lastly as with any survey, results will be limited to the answers the designer is looking for and leaves out other considerations, in this case acccess to the device, barriers to access/ownership, etc.
We would love to hear discussion and thoughts around the results of our mini-survey.
Posted in: Week 09: iPad Apps
Jim 12:22 pm on November 5, 2011 Permalink | Log in to Reply
I think your survey, among other things, tells us that we are still experiencing the very beginning stages of the tablet paradigm. Just like the war between Beta and VHS, Blu-ray vs. HD-DVD, I think that the major players are still battling it out. I think that it will shake down to two major devices, on the iOS based iPad, and the other, probably the Android device. Although, after all the lawsuits are done, Android devices might be severely crippled.
Jay 3:50 pm on November 5, 2011 Permalink | Log in to Reply
Thanks jim. Perhaps a question around tablet usage in general would have been beneficial in seeing what others are using instead of the iPad.
ifeoma 8:13 pm on November 5, 2011 Permalink | Log in to Reply
Hi Jay/Jim,
I agree with you that the survey results may represent the early stages of adoption for the Ipad and that asking what other tablet or mobile device responders use may have helped to give an idea of what kind of device may be prevalent. I must say that I was surprised to see that in a class of people who make up decision makers and influencers in the education arena, a high percentage “never” use the Ipad for all the purposes listed. I wonder how this reflects on thoughts about Ipad being a “game changer” in education- all buzz or fact? Having said that, I would like to mention here that I like the Ipad but really feel that it is expensive especially as I have a cell phone already. My thoughts have been on whether to go for Ipad or Iphone so I will only have to carry one device that does the same things.