February 7:
The lecture this week was focused on health and medical geography (the application of geographical perspectives and methods to the study of health, disease, and healthcare), exploring the similarities and differences of both, and demonstrating the uses of collecting and analyzing data for use in the public health field based on North American examples. Health and geography are intrinsically linked: the social, built and natural environment affect our health.
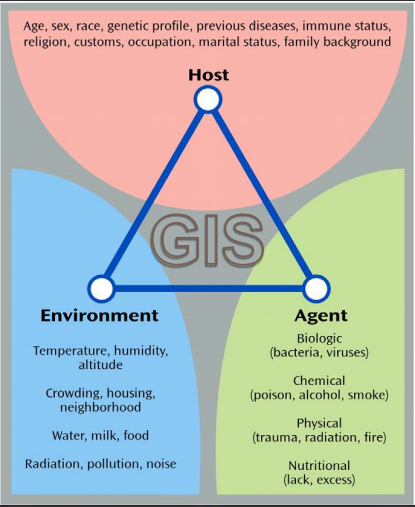
For example, GIS can be used in studying health inequalities, or factors which increase an individual’s chances of becoming ill, such as socio-demographic factors, area effects, and access to healthcare. This is an example of spatial patterning of disease and health. People living in lower elevations and closer to water bodies are at higher risk of contracting malaria. This would fir in with the ‘traditional’ definition of medical geography: contemporary medical/health geography would adopt a stance where health, disease and illness are linked to power relations in society, considering dynamic relationships of both health services and the health of population groups on the vitality of places.
February 14:
This week was a continuation of applications of GIS in health geography, especially epidemiology, environmental hazards, modeling health services, and identifying health inequalities. As discussed last week, location matters: health and ill-health always have a spatial dimension. GIS is used to quantify disease occurrence, and can identify and quantify a plethora of environmental factors (causal and mitigating factors). This leads to greater understanding of the causes of the disease, and predicting its occurrence. GIS expedites this process because it can georeference health and population data, methods can be reproduced through simulations, and maps and aspatial data can be integrated easily.
Spatial misalignment issues and sources of uncertainty (quality of population data, strengths of association, ecological bias) were also discussed, as well as best practices. Case studies in Australia and the US were used to show the effects of remoteness and access to healthcare facilities.
February 28: GEM 511 Project Overviews
Graduate students from the GEM 511 class outlined and presented ideas for their final projects. One project of note was the Forest Cover Change in the Squamish River Valley. It used LandSat and IKONOS images to perform supervised classification of spectral properties to statistically analyze changes in area of forest cover using ArcGIS applications. It would examine forest, non-forest, crops, shrubs, soil, rock and logging areas.
Some complications the proponent foresees is the need to ‘mask’ any snow and icy cover that would disrupt the classification. The Raster calculator will be used to identify losses, persistence, and gains of forest cover. This type of project is useful in global forest ecosystem dynamics studies, and can serve as part of an inventory process for forestry companies.