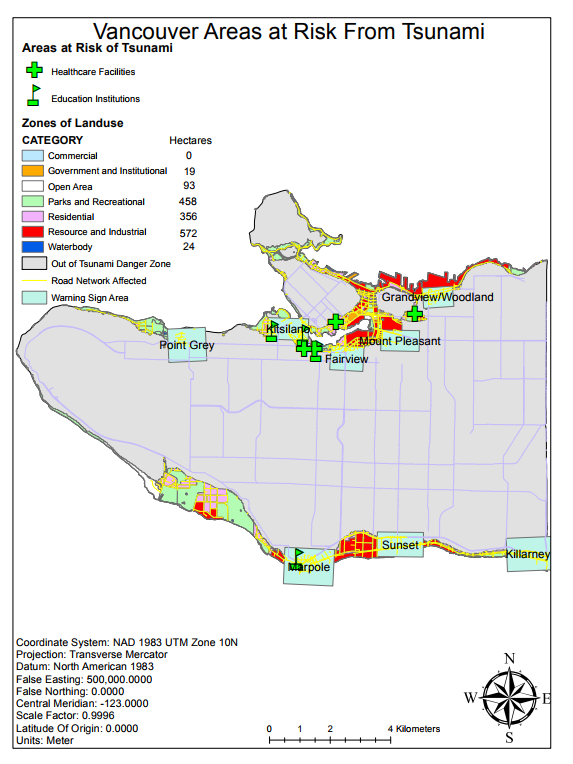
The map layers Vancouvermask and Vancouver_Danger have sum area values, which can be summarized to give the total area value of the layer. I divided the total area of the Vancouver_Danger layer by the Vancouvermask layer. I discovered that about 12% of Vancouver lies in a potential danger zone of a tsunami, characterized by its elevation up to 10 meters above sea level and lying within a kilometer of the shoreline.
The Healthcare facilities in the tsunami danger zone: False Creek Residence, Villa Cathay Care Home, Broadway Pentecostal Lodge, and Yaletown House Society.
The Educational facilities within the danger zone: Emily Carr Institute of Art & Design, Henry Hudson Elementary, False Creek Elementary, St. Anthony of Padua, and Ecole Rose Des Vents.
In Lab Assignment 1, I learned the basic principles of GIS software through the completion of the ESRI training module. This enables me to recognize key elements of maps and the differences between spatial and thematic data to begin analysis of maps.
In Lab Assignment 2, I needed to understand how to convert, transform, and manipulate vector and raster map files in order to answer questions about spatial entities. I observed the impact that the Mt. St. Helen’s 1980 eruption had on the mountain and its immediate surroundings. I used images obtained from the Landsat satellite system from 1979 and 2002. The wavelength band display was changed using Symbology properties in ArcGIS. Drastic changes existed between the two photographs: an entire lake was created by the obstruction of rivers by falling debris. I learned how to use GIS software to quickly analyze and compare landform information from different time frames.
Lab Assignment 3 dealt with a scenario in which a tsunami strikes Vancouver. The task was to determine what areas were in danger and what lay inside these areas. The zones in danger were created by overlaying a digital elevation layer (converted to a vector layer) with vector layers of Vancouver, beginning with buffering a zone within a kilometer of the shoreline, then other layers containing information about land-use and infrastructure. I learned to extract information about potential environmental hazards by combining completely different categories of data to predict potential outcomes of a natural disaster.