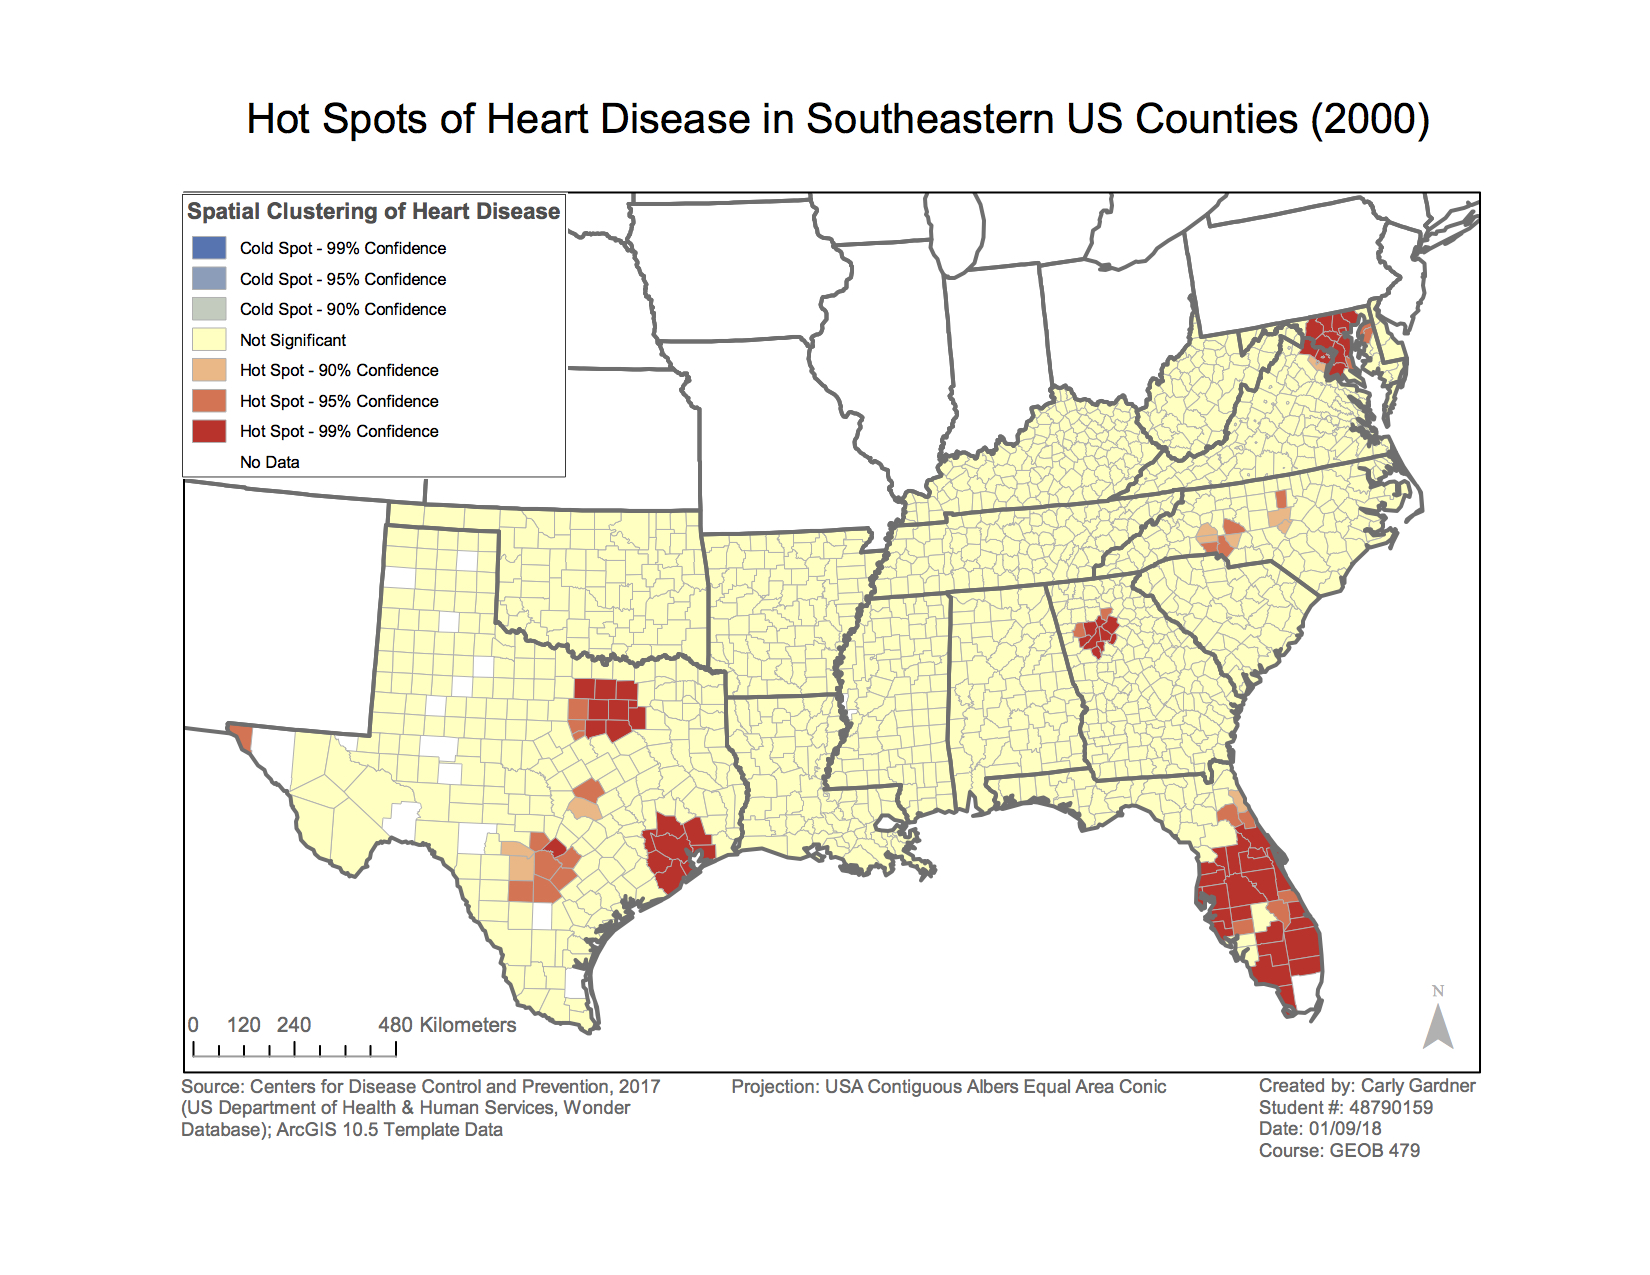
In this lab, I obtained health data from the CDC (Centers for Disease Control and Prevention) to create a map showing heart disease rates by county in the southeastern United States. We used a spatial weights matrix, the Hot Spot Analysis tool and ModelBuilder.
After downloading the data I had to correct for a common issue where numbers in the file need to be treated like text. Then, in conducting the spatial analysis, I explicitly defined spatial relations amongst spatial objects by modelling spatial relationships with a specific spatial weights matrix. For this, I created a model using the Modelbuilder.
Unfortunately, some errors occurred in our Hot Spot Analysis tool. For some reason each hot spot map was not added to the display. I circumnavigated this issue by generating each of the maps individually (but only chose two different years to generate, rather than producing all 17). If I generated enough, it would be worth building an animation model in order to see how heart disease rates change in this geographical area over time.