This week was another round of presentations! As the title of this post implies, the topic of this assignment was health geography and GIS.
My favourite presentation was regarding the research paper: Using geographically weighted regression for environmental justice and analysis: Cumulative cancer risks from air toxics in Florida. This study focused on two research questions:
- Are cumulative lifetime cancer risks from ambient exposure to multiple sources of hazardous air pollutants distributed inequitably with respect to race/ethnicity and socioeconomic status across Florida?
- How does the direction and significance of statistical relationships between cumulative lifetime cancer risk and race/ethnicity or socioeconomic status vary across the state of Florida?
The paper used both Ordinary Least Squares and Geographically Weighted Regression in their analyses. The found a significant positive relationship between the proportion of Black, Hispanic and Asian residents and cancer risk, and a significant negative relationship between population density, poverty and cancer risk.
This presentation has gotten me thinking about ideas for the final project! It might be interesting to explore other geographic patterns of health…
—-
This week was Evan’s turn to present on our behalf. The research paper we chose was A GIS-environmental justice analysis of particulate air pollution in Hamilton, Canada by Jerret at al., 2001.
The two primary objectives of the study were to analyze the relationship between total suspended particulate (TSP) exposure and socioeconomic variables such as income, unemployment and housing value with an environmental justice/equity framework; and to look at how sensitive the relationship between air pollution and socioeconomic variables is to specification of exposure estimates or statistical models.
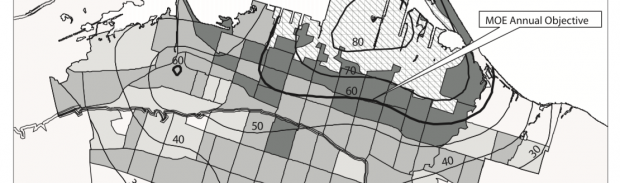
To do this, they created two different exposure maps (chronic and extreme) which were input into OLS and simultaneous autoregressive (SAR) analysis with socioeconomic data (income, dwelling value, unemployment rate etc). They found that there was a difference in significant variables depending on the model used. For instance, dwelling value and low income were significant in OLS models, but in SAR the low income variable was replaced by unemployment. In both models, dwelling value was the most significant independent variable. They also found that highest exposure zones have a twofold increase in total suspended particulate concentrations and a more than twentyfold difference in probability of exposure to extreme events than lowest exposure zones.
All in all, we gave this paper an 8/10 because their findings generally aligned with other research, steps were taken to properly specify the models, and sources of error and uncertainty were acknowledged. Their maps are simple and effective. Our primary complaint was that the models are slightly outdated now.