
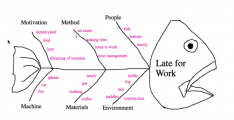
Fishbone diagram
Riffing off an activity that was designed by D’Arcy Norman (U of Calgary) and posted online, we’re asking you to invite collaborators to create a fishbone diagram to think about a teaching challenge or goal that is meaningful to you.
Your challenge
Create a fishbone diagram that addresses a teaching goal (like improving engagement, for example). You can frame this as a problem or challenge if you like (students are not engaged, as an example). You may:
- consider main spines or bones as major components of the learning environment: content creation, assessment, learner interactions. You may choose others.
- add/ brainstorm as many elements in each of those components as you can think of
- draw a line through any you have no control over.
You will need:
Share your experience:
- In the comments below, share the link to your fishbone diagram when you have done as much as you can – along with your collective feedback about the process.
- OR post about it on your WordPress site and tag your post with collaboration and whiteboard to have it appear with this post (at least we think that’s what will happen?)
Would you use this with your students? How?
Intended learning outcome:
Collaborative problem analysis for cause/effect relationships.