Author Archives: carly gardner

Lab 2: Exploring Fragstats

In this lab, we explored landscape change in Edmonton, Alberta from 1966 to 1976 using data from the Canadian Land Use Monitoring Program. This data was put into Fragstats, a computer software program designed to compute a variety of landscape metrics. Also required was the creation of a transition matrix in Excel and a report written from a particular professional perspective. I chose to write as an agricultural planning consultant, and hence focussed my analysis on threatened agricultural areas and urban encroachment. Continue reading

Understanding Landscape Metrics: The link between pattern and process

In this class we learned about landscape metrics. Here, as with many applications of GIS, the fundamental issue is the problem of pattern and scale. Patterns and processes occur on very different scales of space, time, and ecological organization, so determining which scale to use when studying a particular phenomenon can be tricky. There is no single, natural scale that will encompass all of the different interactions and interrelations that should ideally be accounted for. Continue reading

Spatial Pattern Analysis: Exploring Dengue Fever

In today’s lab, we followed an ArcGIS tutorial that uses spatial statistics such as Average Nearest Neighbour, Spatial Autocorrelation, Calculate Distance Band from Neighbour Count, and Hot Spot Analysis in order to understand the pattern of Dengue Fever in Pennathur, Southern India.

The results of the tutorial indicate that contracting Dengue fever is not simply a product of luck or random chance. The spatial patterns we identified must be caused by certain risk factors – the next step would be to determine what these risk factors are!

Ultimately, this tutorial was a quick but effective way to practice using these tools available from ArcMap.


PRESENTATIONS: Landscape Ecology and GIS

Instead of lectures this week, we had the opportunity to listen to presentations from our classmates about the uses of GIS in landscape ecology!

One presentation I found particularly interesting was about modelling fire and landform influences on the distribution of old-growth pinyon-juniper woodland. The authors of this particular research paper created models of old growth distribution, taking into account topography and fuel in order to determine which fire risk component is most strongly associated with the distribution of old growth, and to assess the strength of the association between fire and the spatial distribution of pinyon-juniper woodland. They found that the spatial distribution of fuel material influenced the age structure of the landscape to a greater extent than topographic barriers in this particular watershed area of Nevada.

The research paper I presented was A multi-scale assessment of human and environmental constraints on forest land cover change on the Oregon (USA) coast range by M. Wimberly and J. Ohmann (2004). The objectives of this study were to to quantify changes in the distribution of major forest stand types in the Oregon coast range from 1936 to 1996; to compare the influence of human and environmental factors on land cover change; and to determine if the relative importance of these factors changes with spatial scale. The basis of their analysis used linear regression models, partial correlation analysis and stepwise linear regression in order to assess land cover change. One of their primary findings was that the percent cover of large conifer forest declined from 42% in 1936 to 18% in 1996. This forest type was largely replaced by small Douglas firs, small Spruce-Hemlock and open area. They also found that private land ownership was the most important independent variable influencing land cover change, regardless of spatial scale (sub-basin, watershed and subwatershed). Decreases in large conifer forest cover were typically greatest in hydrological units dominated by privately-owned land.

We ended up assigning this paper a 9/10 because it was well written, it acknowledged and addressed sources of uncertainty and error when appropriate, provided sources and reference material, and met all research objectives. However, their cartography and visual design could be improved.


Why is geography important?

Lecture 01.10.18

So… geography. Why is it so important?

Just like I mentioned in my last post, geography is a natural element of any and all analysis. Today’s lecture delved further into this idea to consider various issues arising from any study that uses geographic data, including:

  • the modifiable areal unit problem (MAUP)
  • the scale, grain and extent of a study
  • the nature of the boundaries of a study area
  • spatial dependence / heterogeneity.

Continue reading

A Geographical Perspective

Lecture 01.03.18

In this lecture, Dr. Klinkenberg introduced the course and outlined its three primary subject areas: conservation biology, healthy geography, and crime. It was emphasized that, being a geography course, it would take a geographic perspective. This is because geography matters. In any field of study, where things happen matters. In this way, GIS functions to integrate disciplines. Continue reading

Ten Critical Success Factors of Land Use and Transportation that Contribute to the Dutch Quality of Life

Based on my experience in the Netherlands, I have observed and compiled ten critical success factors (CSF) of land use and transportation that I believe contribute to the Dutch quality of life. This course has been an amazing opportunity to experience Dutch transportation engineering and community planning in person. The lectures from industry professionals – planners, architects, engineers – have given me such a unique and valuable inside look at urbanism in the Netherlands. Now that I am back home in Canada, I continue to be surprised at the knowledge and greater understanding I have taken away from this amazing experience.

Accessibility to affordable housing, services, job sites and active transportation is vital for sustainable communities. I was happy to learn that the Dutch have robust polices in place (ex. 1901 Dutch Housing Act) to ensure that an adequate amount of social and affordable housing is accessible to low and middle income groups. Today, about 80% of Dutch rental housing stock is classified as social housing. Affordable housing is considered a right, rather than a privilege.

Accessibility is also addressed through land-use and transportation strategies. A diverse land-use mix allows people to live close to services and job sites and decreases the distance people must travel to access them. A mix of building uses and types allows for short trips, which makes walking and biking viable travel options for most people. I witnessed this land-use mix every day in Delft: the first floor of most buildings was commercial (ex. restaurants and shops), and upper floors were typically residential. Similarly, Vancouver recognizes this important quality of zoning and urban design and implements it through the construction of ‘mixed-use’ buildings.

High connectivity of transportation networks allows for efficient travel, with more route options and more direct travel routes. Fine- grained interconnected transportation networks facilitate shorter travel distances, disperse congestion, and encourage cycling and walking. We saw an excellent example of how infrastructure can foster greater connectivity between different travel modes at a tram/metro station in Amsterdam.

The same platform and tracks were used by both tram and metro, which was made possible by pantographs extending to the electrical lines and a platform with two different heights. The same vessel can physically transform from tram to metro.

It should be noted that even in the Netherlands, transportation connectivity can be improved. Even with high quality transit service provided for the majority of a trip distance, a lack of connectivity between the transit stop and the travellers’ final destination deters many people from using transit in the first place (aka, the ‘Last Mile Problem’). The connectivity of cycle routes at local, regional and national scales is constantly being improved, as is cycle parking at major transit stops. This is done to enable people to cycle these final miles without putting cycle storage over capacity.

Permeability is also essential for network connectivity. In the Netherlands, pedestrian and cycle routes are rarely interrupted by high levels of traffic or physical barriers. Underpasses and bridges are strategically placed to ensure that all areas of the transportation network are connected. It is also important to note that vehicle networks are becoming less connected in many cities in order to
discourage motorized traffic and prioritize active transport.

We witnessed this in the community of Tanthof, which was specifically designed to confuse vehicle drivers and make it difficult to navigate by car. In contrast, cycling, transit, and walking are encouraged by their high degree of network connectivity and permeability through the neighbourhood.


The Dutch are experts in safe transportation planning and design. As one of the safest cycling nations in the world, they know how to design infrastructure in ways that limit conflicts. During my three weeks in the Netherlands, I have seen two primary strategies for safe transport: separation and traffic calming. Separating modes (bikes, pedestrians, and motorized traffic) and  speeds (high and low) prevents serious accidents from occurring. While separated cycle tracks are an easy example of these strategies, we also see complete separation at junctions when cycle tracks take a tunnel or overpass to avoid vehicle traffic.

Modes and speeds are also separated with a variety of physical barriers including moveable bollards, painted lines, raised tracks and/or ‘natural’ barriers, like green-space or planting boxes. While separation improves physical safety, the Dutch also design for perceived safety. It’s simple: when cycling feels safe, more people are willing to do it. Now, it is common practice for cars to be diverted outside of city centres to decrease the risk of accidents, reduce traffic stress, and improve air quality. Traffic calming is also implemented with speed bumps, narrowing of lanes, low speed limits, and/or traffic circles.

These safe transportation design strategies are guided by the System Approach to Safety, which we learned about at SWOV (the Institute for Road Safety Research in the Netherlands). People are limited in their ability to process information; as such, human error is impossible to completely eliminate. Dutch transportation infrastructure designs are kept simple in order to eliminate as much chance for error as possible. That is, the Dutch design transportation infrastructure that all road users will find easy to use.

An environment that is scenic, comfortable and peaceful goes a long way to improve the Dutch quality of life. Aesthetics are a key tool to increase transit ridership and ensure a pleasant travel experience. The quality of my experience on Dutch transport was made excellent by their high standards for cleanliness, architecture, as well as interior and landscape design. Even the design of security cameras in train stations was nonaggressive!

Land use aesthetics are also important in the Netherlands. The canals, public squares and windmills create a distinct atmosphere and identity that is recognized across the globe. While the Netherlands can be recognized internationally, a smaller scale of identity – or “sense of place” exists for each city and many neighbourhoods. that we travelled to. For instance, I found Houten inorganic, sterile and rather unsettling. In contrast, Rotterdam felt like a modernized centre for innovation and experimentation. While a “sense of place” is an inherent quality of community identity, it is often moulded intentionally through planning and design initiatives (ex. public art, architecture, and Rotterdam’s ‘City Lounge Project’). Aesthetics play an important role in shaping a sense of community and character.

The Netherlands knows how to create spaces for social interaction. On my walks through Delft and other Dutch cities, I’ve seen charming public squares with outdoor seating, cafes, lights, public art and greenery (it blew my mind to learn that many – if not most – of the public squares were recently parking lots). A pleasant space creates areas where people are willing to spend time, which encourages public interaction and supports local businesses too.

Sociability relies on more than just aesthetics, however. Human-scale buildings maintain our connection to the street – a complex relationship that improves social safety by keeping ‘eyes on the street’. A mix of building types and uses keeps the street active and transforms spaces into vibrant places. A diversity of buildings, residences, businesses and other uses – as well as a diversity of users – develops strong, vibrant and socially sustainable communities. There were several times that we would wave and chat with strangers walking in the street below our hostel, or in the apartment across the street. You are close enough to the ground to feel connected to what goes on below.

Multi-scale cooperation between public, private and government actors is essential to achieve the high quality of life that is enjoyed in the Netherlands. I have learned that the Dutch highly value public consultations and work with the public, researchers, and private companies to ensure that strategies are best for each project or scenario. For instance, when the public protested automobiles in the 1970s, the Dutch government was responsive to the social movement and worked to find solutions including the restriction of motor vehicles in cities and to make cycling more attractive.

The centralized planning and control by the Netherlands government has been a critical success factor in their movement towards sustainability. While it may seem counterintuitive, this type of control creates an environment for innovative ideas to thrive. In short, the Dutch get things done. These include incredible engineering feats (ex. canals, pumps, and dikes) to manage flood waters and reclaim land, the harnessing of wind energy and other green energy alternatives, the containment of urban sprawl with firm growth boundaries and preservation of green space, and the development of safe and efficient long- term transportation infrastructure (ex. separated transportation modes and speeds, traffic circles).

The Dutch experiment with new technology and new designseven with the potential for failure. The inventor of the turbo roundabout was Dutch!

Rotterdam is home to the first ever
pedestrian-only shopping street! Even policies are innovative. For example, when requested by a resident, cities in the Netherlandsmay temporarily ban cars from a residential street. The ban is put in place for roughly three months, at which time a survey is completed. If the experiment goes well and residents are pleased with the arrangement, the pedestrian zone could be made permanent.Sometimes, the city will remove cars from city centre and transform it into a pedestrian space. We saw examples of this in Amsterdam, Delft, Utrecht, Rotterdam and many there places. Sometimes these projects work, and sometimes they don’t. The point is, we aren’t going to find solutions if we don’t experiment first!

High standards for design, policy, infrastructure and planning results in efficient, resilient results. For example, Dutch bike paths are often constructed with a red pigment mixed into the asphalt rather than a simple layer of paint. Although the upfront cost may be greater, the higher quality pigment will stay visible even with wear, which is safer and less expensive in the long run.

Quality goes beyond durability. Functional ambiance – the combination of multi- functionality and aesthetics – is also incorporated into Dutch transportation design. For example, kilometres of coastline between the Hook of Holland and Scheveningen are equipped with a hybrid structure of camouflaged dikes, a sandy foreshore, as well as cycle and pedestrian pathways. The dikes act as flood protection, active transportation corridors, tourist attractions, and improve the local aesthetics.


A long-term vision is necessary for a high quality of life to be sustained for generations. Long-term visions consider the three pillars of sustainability – economic, social, and environmental – and are of utmost importance in the face of climate change and uncertainty both in the Netherlands and across the world. The Netherlands uses a long- term vision in their plans for resilience. For example, after a major flooding incident in the 1950s, the Netherlands developed an extensive system of dams and storm surge barriers to prevent a similar catastrophe from ever happening again. New projects are being designed to withstand the effects of climate change and rising sea levels for the next 190 years. The Netherlands are also leaders in wind energy, which they have used as a power source for centuries. Today, all Dutch electric trains are 100% powered by wind energy.

Based on my experience in the Netherlands, these aforementioned critical success factors are what I consider to be the top ten most important criteria to promote a sustainable community and high quality of life.

Continue reading

Final Project: Assessing Vancouver’s Livability for Seniors

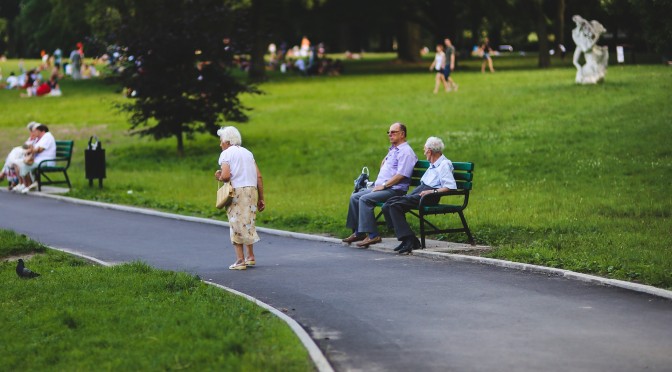
This project aimed to determine which neighbourhoods of Metro Vancouver are best suited for senior citizens. Our analysis was based on the assumptions that seniors would prefer areas of low housing costs, low crime rates, and that have senior-targeted amenities within an accessible walking distance.

Click here to see the Final Project Report!

Our team met at least once every week to construct the maps together. We typically had one member operating ArcMap, with another looking over their shoulder offering guidance and looking up instructions and online help. Another group member would be recording the steps taken in order to assemble a flow chart at the end of the project process. The final report was divided into sections amongst the group to be written up, but was edited together.

According to our analysis, the three best neighbourhoods for senior citizens in Metro Vancouver are:

  1.  Renfrew Collingwood

  2. Strathcona

  3. Marpole (eastern portion)

The project helped us be to become more familiar with the spatial join tool in particular. This skill allowed us to normalize data points, such as break and enters, over neighbourhoods. This suited our goal of comparing Vancouver neighbourhood crime rates and other factors.

We also became more comfortable with retrieving data from external sources. Census data was simple to find. We had originally planned to include grocery stores in our amenities analysis, but had significant difficulty in locating data. We acknowledge that this would be a good thing to include in future analysis of liveability in our report.

Group projects, particularly with GIS, face a multitude of challenges. There are several people working on the same set of maps which means that communication is key. We found that creating a Google doc to record notes, steps taken, and thoughts/ideas throughout the project process allowed all group members to stay on the same page. It was handy for both facilitating good group communication and later for creating the flow charts. It also made data management much more simple, because names of files were recorded with a description.

We also created a Facebook group for efficient communication. This was what we used to schedule group meetings and send documents/maps.

LAB 5: Environmental Assessment

In this lab, we performed an environmental assessment of the Garibaldi at Squamish ski resort. I was tasked with assessing the project as a (pretend) natural resource planner obtained by the British Columbia Snowmobile Federation (BCSF).

When working on environmental projects, you sometimes become involved in proposals that you do not ethically believe in. Although my conclusion as an analyst hired by the BCSF argues that the project should go ahead, my personal opinion is against the development of this project. Considering the project will likely be negatively affected by climate change in the not-so-far future, the potential environmental damage caused by this development is not ‘worth’ the economic gains.

Click here to see my map of the project area!

Click here to see my 3D Hillshade Map!

Here is my memo created following the environmental assessment:

THE PROPOSED PROJECT

The Garibaldi at Squamish project is a proposed year-round destination mountain resort between Squamish and Whistler on Highway 99. Proposed by Northland Properties and Aquilini Investment Group of Vancouver, the project includes 124 ski trails and 21 lifts, resort accommodation and commercial developments. It is located on Brohm Ridge; 80 km north of Vancouver, 15 km north of Squamish, and 45 km south of Whistler. Despite being very controversial due to concerns over the economic viability, climatological implications, and environmental impact on vegetation and fish and wildlife habitat, the project was tentatively approved in January 2016 provided it meet 40 conditions.

My involvement in it:

I am a natural resource planner retained by the British Columbia Snowmobile Federation (BCSF). The BCSF is currently in opposition to the proposed project, but wish to evaluate whether there is sufficient evidence to continue to oppose the project, or whether these aforementioned concerns can be addressed. I will examine the Environmental Assessment’s recommendations and the Resort Municipality of Whistler’s criticism (of climate limiting viability of skiing) to accomplish this task.

The analysis:

This analysis aims to ultimately determine whether the proposed Garibaldi at Squamish project is economically viable. If the proposed project is a ‘good’ fit for the area, it may be successful at drawing in tourism and increasing local business for the BCSF — and thus should be supported by the BCSF. Using data acquired from DataBC and the BC Government, I considered environmental protection areas, road accessibility, and the future of snow in the park area in my analysis. A ‘good’ fit would ultimately be if few new roads are required, there is little encroachment on environmentally protected areas, and that snow supply is sufficient and reliable in the project area.

Future of snow:

The Resort Municipality of Whistler argued that reliable skiing would be limited on the lower 555m of vertical in the project area. In my analysis, I reclassified areas of the proposed project area that were below 600 metres using digital elevation model data – assuming that climate change would limit snow in these areas.

Environmental protection areas:
The environmental assessment was simplified; data was filtered to consider the ungulate winter range, old growth management areas, riparian habitat, and endangered/threatened ecosystems. All data was clipped to focus only within the proposed project boundaries. Riparian habitat determined necessary to protect was set within a 100m distance of lower elevation streams (below 600m elevation) and 50 metres of streams above 600m elevation with a simple buffer proximity analysis.

RESULTS

Environmental Protection:

Of the proposed project area:

  • 6.8% contains old growth forest
  • 7.9% contains Mule Deer and/or Mountain Goat habitat
  • 24.8% contains red-listed species (6 endangered/threatened species total)
  • 26.3% contains riparian habitat zones
  • The total project area that will directly impact old growth forest, ungulate habitat, red-listed ecosystems and fish is 52.7%.


Future of Snow:

38.6% of the proposed project area is below 600m, and these areas are thus predicted to be inadequate for reliable skiing.

RECCOMENDATIONS

Despite large portions of the proposed project area being occupied by areas in need of environmental projection and/or having limited snow supply, it is important to consider that most of these areas appear to occupy much of the same space. As can be seen on the maps, red-listed species overwhelmingly reside in lower elevation areas, for instance. There remains a large portion of the project area that could be operated upon without concerns of snow supply, and the lesser environmental concerns there might be mitigated.

The two greatest environmental concerns to project development are encroachment on red-listed species habitat and riparian habitat. Large portions of both riparian habitat zones and red-listed species habitat are both found in the areas below 600m elevation areas that are predicted to be unusable for skiing anyways. These important habitats can be mostly protected if developers simply avoid these low elevation areas. Threats to riparian habitat in higher elevation areas could be mitigated by keeping new road and other infrastructure development outside the 50m buffer areas used in this analysis.

Ultimately, there is still a large portion of the proposed project area that could prove to be economically viable. Most of the proposed project area is still above 600 meters and will most likely have reliable skiing into the future. It is in the best interests of the BCSF to support the Garibaldi at Squamish project.