Illustrated Interviews

Interviews are a series of questions and answers and as social scientists we presume both use words. More common in the arts community is the possibility answers can be entirely or partly in the form of drawings, illustrations, images. Thinking about illustrated interviews within social science opens possibilities in forms of thinking and representation that often go untapped in interviews.

Asking interviewees to draw pictures that become part of interviews is a strategy I have used with children. Studying the impact of high stakes testing on children, I asked them to draw a self-portrait whilst taking the test. They also wrote a caption for the self-portrait and these drawings were used to engage the children in an interview about their experience.

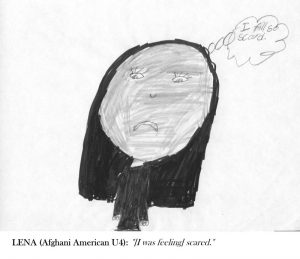
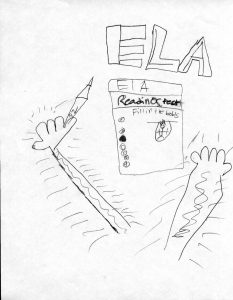
In this same study, children kept journals and were encouraged to  write and draw. Not every child drew but most did at least some of the time suggesting the flexibility to chose how they represented their experience enhanced the likelihood of authentic sharing. You can read a report of this research here.

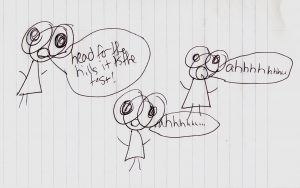
The NYT does a series of illustrated interviews… asking simple questions and having celebrities draw responses, which are then modestly animated resulting in a sense of action. Some interviewees are skilled at drawing, many are not. The interviews share a common set of questions and thus reveal a “life” for each person.

There are examples of drawings that represent concepts or ideas, like Jennifer Burtchen’s drawings of time, her drawing of the “present” shown here. This is one of a series of illustrated interviews in the magazine Ignant.


Liana Finck and Amy Kurzweil are both cartoonists and in this interview about a book written by Finck they use drawings in the margins of a more typical Q & A format to amplify the written responses.

Incorporating illustrations in interviews can be done in a number of ways:

  • interviewees respond in drawings, sketches, or even photographs
  • interviewees generate drawings that are used during an interview
  • interviewer drawings are used to enhance, elaborate, accompany questions

There are many examples of using drawings when doing research with children, but this strategy can work with adults as well.

Ethics

I use this prezi when I teach about research ethics.

This issue of Forum: Qualitative Social Research has an extensive special section on research ethics. Topics include: conceptual frameworks, ethics codes and research review practices, and ethical issues in many different particular research contexts (indeed, most of the issue focuses on ‘ethics in practice’).

The Introduction concludes with this coda:

The present collection of studies concerning ethics in qualitative research bears testimony that the research community has come a long way from where it still had been in the 1960s, when research was conducted that obviously harmed participants and bystanders. It is exciting to see that qualitative researchers tend to treat ethics not as a code but as a characteristic of the relation between researcher and researched. Once we consider the relation as an event (rather than thing), it is immediately apparent that ethical questions never are resolved with some formal institutional approval of the research. Instead, ethical questions are aspects of human life and relations and thus continuously pose themselves anew, remain for a while, and die away only to be reborn again in some other form.

Coding

Coding is the basic building block of analysis, and while it seems straightforward to code your data, it usually turns out to be quite mysterious.

The first step in any analysis is to remind yourself of the methodology you have chosen, and analysis will be impossible (or at least atheoretical, merely descriptive) if you have not chosen a methodology! This provides the context for first deciding what purpose codes will serve. For example, if you are doing narrative analysis codes may be useful in specific ways related to the methodology, such as:

  1. identifying narrative components, such as characters, time sequences, plot elements
  2. counting particular words, phrases, metaphors, and so on
  3. labelling the concepts within the narrative

So codes can serve many purposes, and even within the same analysis often do serve many purposes. We are often examining the trees, but with an interest in seeing the forest.

Perhaps most commonly we use codes to identify concepts/bigger ideas reflected in our data and then look for intensity of concepts and patterns among concepts. In addition, codes can be counts (of words, phrases, ideas); markers for magnitude (how much of something is present/absent, simplistically perhaps as high, medium and low); and organizational (keeping track of demographics, labelling particularly evocative quotes, or as bookmarks during the coding process). But these purposes should not be muddled together.

Occasionally the question arises: how many codes do I need? There is no answer for this question, you need as many codes as you need for the purpose they serve. And, the number of codes evolves, ebbs and flows, in relation to answering the research questions posed within a particular methodological framework.

Coding, again informed by the tenets of a methodology, may be done inductively (from the bottom up; from the data to theory), deductively (from the top down; testing a theory with the data), or most commonly abductively (moving iteratively back and forth between data and theory). This is a decision that needs to be made explicitly.

Keeping track of codes, used for various purposes and changing, is greatly facilitated by CAQDAS… computer assisted qualitative data analysis software.


Story Maps

A story map visually displays data in relation to places, location, or geography, and story mapping is the process of finding and analyzing the connections among human experience and place. Story maps can be simple or complex, low or high tech. And, story maps help in analyzing complex social issues such as human rights, climate change, refugee resettlement, student transcience, and community integration.

First, a simple example.

In a study of climate change, researchers worked with Ecuadorian subsistence farmers, used Post-It notes to facilitate a community discussion on climate change. Using a map as the basic reference, farmers in the mountainous central Ecuadorian province of Cotopaxi answered three questions: Has your community changed since you were a child? How has the climate changed since then? Are there any past climate-related events that affected you the most?

Responses were posted to the map, illustrating connections between place and observed human (such as illness) and climate (such as agricultural pests) events.

While this data collection and analysis was part of larger mixed methods approach, it illustrates how mapping human experience enhances our understanding of climate change. (Here is the article.)

More sophisticated examples.

Using existing web based templates (like StoryMapJS) or even Google Maps a story can be build that illustrate events and relationships. These tools rely on a narrative that moves through geographical space and the flow can be in space or time and space. An example of the former might be a subway line or interstate highway along which events, places or people can be placed. This story map of the Green Line train in Minneapolis is a good example. A static map example is of Pioneer Square in Seattle as a center for Queer history in that city. An example that combines movement through time and space is a story map illustrating the shifting population throughout USA history.

Often, story maps use GIS (geographical information systems) software, most commonly ArcGIS. Here is a link to Environmental Systems Research Institute, the most common portal for the use of this software, with illustrations from marketing, social science, and natural sciences. There are lots of examples on this website, but this story map of the experience of Rohingya refugees is a good place to start.

Story maps are often web-based, which facilitates interactivity and reveals movement within the story.

What applications might this have in educational research? Here are just a few ideas.

  1. Student mobility is an issue in the lives of some students, the quality of education received, experiences in school, and the experiences of schools. Mapping student mobility within a district or city combined with interviews, performance data, family characteristics, school environment and so on could provide insight into the experience of transcience and help schools plan better for the inevitability of student mobility.
  2. We know standardized test scores correlate as much with social class as with ability. Social class is closely linked to neighbourhoods and so mapping scores onto neighbourhoods, with additional information about income, types of housing, and cost of housing would reveal this relationship succinctly.
  3.  Generally, one might examine issues of space and educational inequality. Inequality that stems from race, ethnicity, or special needs are geographically unevenly distributed and revealing that distribution in communities, districts, schools and even classrooms could be done with story mapping.

embeddedness, truth & complexity

Fifteen years after the Iraq War began, Magnum photographers are reflecting on being embedded with the U.S. military and how it affected the work produced during the conflict. While the practice of embedding journalists is not new it very much came to the public’s attention during the Iraq and Afghanistan wars, estimates are there were 700+ journalists and photographers embedded with American military troops.

There is much controversy about this practice, some of which is highlighted in the Magnum photographers reflections. A key issue is the sympathetic and dependent relationship with the military, one that lead to what some journalists referred to as propagandizing.

We were a propaganda arm of our governments. At the start the censors enforced that, but by the end we were our own censors. We were cheerleaders.   Charles Lynch

Primary issues are:

objectivity: embedding potentially makes journalists tools of the military whose access and message can be manipulated and controlled; provides an insider view of military life; doesn’t allow for access to life in the context, the life of those against whom war is waged

access: embedding provides journalists with access in otherwise unsafe contexts

What does this have to do with research?

The same embedding strategy was used for anthropologists and other social scientists. Since 2007, the Pentagon’s Human Terrain System (HTS) started placing social scientists in every Army combat brigade, regiment and Marine Corps regimental combat team in order to improve the Army’s cultural IQ. The HTS has now been phased out, not because of ethical issues but because there were insufficient on the ground troops to warrant the program. Indeed, the protests of professional associations had little impact on the existence of the HTS. This article is a good summary of the HTS.

It is important to note, collaborations between social scientists and the military did not begin with Iraq, but have always been controversial. For example, Project Camelot, a program intended to help the U.S. Army assist friendly Latin American governments in dealing with insurgency as well as influence social and economic development, didn’t survive once it became public.

Nonetheless, it is useful to ask what has been learned?

  1. The ethical dilemmas presented by embeddedness are significant. Basic premises of informed consent are by definition ignored and violated.
  2. It is critical to ask how the methodological and value traditions of social science might be compromised/affected by the invitation to participate by one side of the conflict in a military zone. Will cultural knowledge be used against those in the invaded country/region, for example? Is the work meant to create knowledge or intelligence? What is the relationship between social science and politics?
  3. What are likely consequences the work will be controlled by the military, in other words, what is the likelihood of becoming a legitimation of propaganda?

These questions remain relevant because, at least on the military side, a desire to use the knowledge and skills of social scientists is still deemed useful, and there is the possibility the HTS has been reinvented under a new name, the Global Cultural Knowledge Network.

Tips on data analysis

Hop over to the QualPage, where Kathryn Roulston has an informative post on strategies and tips for thinking through data analysis.

Becker reminds us that we can only “see” using the ideas that inform our thinking. Since our training as researchers shapes the kinds of ideas we can think with, it is useful to think about how our perceptions are shaped by our individual fields of studies and ways that research is usually done. Becker (1998, p. 18) writes:

… in a strong sense, there aren’t any “facts” independent of the ideas we use to describe them….Recognizing the conceptual shaping of our perceptions, it is still true that not everything our concepts would, in principle, let us see actually turns up in what we look at.

Dissertation writing, at the margins

Although PhD students have much greater freedom to explore alternative ways of doing their dissertation research and presenting what they have learned, I suspect the academy is still pretty conservative overall. This conservatism no doubt has a number of sources, including the comfort level of faculty, the bureaucracy of creating dissertations, and even the views students bring to the dissertation enterprise. Students can be the source of inspiration though and there have been a couple notable examples, of late.

First is Dani Spinosa’s (pursuing a doctorate in English at York University) blog [generic pronoun] creates, a site for blogging by herself and others that will become her dissertation. “It explores the ways that the dissertation can become a site of activism and community as well as a place for research and academic scholarship.” The blog come dissertation begins with the post in the image, and is followed by longer posts on postanarchism, poststructuralism, and postmodernism. Her research focuses on 11 poets and seeks to explore political philosophies of post-anarchism as a literary theory of engaging with texts. She posts once a week and the entries and comments are read by her supervisor and committee. Her initial intent was for the blog to be the dissertation (the blog posts are sorted by categories one might associate with more traditional writing, like footnotes and appendices), but the University required a written document for the defense. “Chairs and the head of the graduate department said a blog is not a dissertation. The print version is halfway between what the department wanted and what I was willing to give.” (See more at: https://chroniclevitae.com/news/361-the-amazing-adventures-of-the-comic-book-dissertator#sthash.I5OQiUOn.dpuf)

Another example is Nick Sousanis’ (pursuing a doctorate in interdisciplinary studies at Teachers College) comic-book format dissertation. Unflattening: A Visual-Verbal Inquiry Into Learning in Many Dimensions is what it says it is, an investigation of the interconnectedness of the visual and the textual and that interconnectedness’ relationship to learning, and Sousanis blogs about his progress here. To explore the relationship between perception and visual strategies, he depicts his dog navigating a forest at night using a range of senses to perceive.

And recently, Clemson University doctoral student A.D. Carson produced a rap album for his dissertation.

The album, “Owning My Masters: The Rhetorics of Rhymes and Revolutions” uses hip-hop to explore such ideas as identity, justice, economics, citizenship and language.

Clemson University doctoral candidate A.D. Carson talks about the history of rap music in his home studio near campus, Jan. 30, 2017. Carson used the studio to produce “Owning My Masters: The Rhetorics of Rhymes and Revolutions”, a 34-track rap album that also serves as his dissertation. (Photo by Ken Scar)

Writing in hip hop Carson isn’t being gimmicky but rather communicating in a way that is natural and embodied for him and complements the content of his work.


I’m trying to examine how an authentically identifiable black voice might be used or accepted as authentic, or ignored, or could answer academic questions and be considered rightly academic. So I have to present a voice rather than writing about a voice.

These are examples of what might be a trend, a move away from traditional book and article formats as the only representations of knowledge, but the change comes at a glacial not a volcanic pace. The next several decades may expand and complicate the notion of representation, but in all this one hopes the focus on form, while integral, does not diminish a focus on quality (whatever that may end up meaning).

How to use a novel as a guidebook OR what is the difference between fiction and nonfiction?

A story in the NYT, which uses great graphics (another post, another important topic), describes how the author used Oliver Twist as a walking tour guide to London.

It was nearly eleven o’clock when they reached the turnpike at Islington. They crossed from the Angel into St. John’s Road; struck down the small street which terminates at Sadler’s Wells Theatre; through Exmouth Street and Coppice Row; down the little court by the side of the workhouse; across the classic ground which once bore the name of Hockley-in-the-Hole; thence into Little Saffron Hill; and so into Saffron Hill the Great: along which the Dodger scudded at a rapid pace, directing Oliver to follow close at his heels.

~ CHARLES DICKENS

The inference here is that literature, fiction that is, can be a guide to what we might think of as the “real world.” And in this short discourse, the author illustrates what he sees as the substantial over lap between the contemporary streets of London and the days when and where Dicken’s Oliver Twist descended into gang life.

There are plenty of instances of people looking for places and things described in literature… Platform 9 3/4 in King’s Cross Station, for example.

Umberto Eco also takes up this idea in Six Walks in the Fictional Woods, but comes to a slightly different conclusion… with the descriptions of the streets of Paris in Dumas’ Three Musketeers. Eco takes his reader along as he shadows D’Artagnan through the streets of seventeenth-century Paris, but Dumas fools us and we cannot quite follow the trail, not because the streets are not there but because the trail doesn’t make physical, logical sense.

In both instances, whether the mapping is “accurate” or not, the idea or possibility of mapping reveals the uncertain boundary between story and history, between fiction and nonfiction. Fiction is dependent on reality (even fiction that seems most unreal); but reality, too, depends on fiction. What connects fiction and nonfiction is the underlying idea of story. Whether we are writing/reading the stories created by others for us or we are telling/listening to stories of friends, family, research participants’ lives we are making sense of the world through narrative, through story.