
Posted On: December 07, 2020
Written By: Wei Cui
The tax that citizens in many modern economies are most familiar with is probably the personal income tax (PIT). The salience of the PIT, compared to other major taxes such as the corporate income tax and value added tax, is often, but not always, matched by the PIT’s significance as a source of revenue. In Canada, PIT revenue represented 49% of total federal government revenues in 2017-2018. In many developing countries, however, the PIT is a much less important revenue source. There are two standard explanations for this. First, the PIT, since its adoption in industrialized countries in the early 20th century, tends to generate the most revenue from the taxation of wage income. That is, most PIT revenue comes from employers’ withholding of the tax from paychecks written to employees. In many developing countries, however, the formal employment sector is small, and therefore the tax base of wages of formally employed workers may be too small to sustain the PIT. Second, it is often believed that the PIT must possess certain features—e.g. there must be progressive tax rates, certain types of deductions must be allowed, etc.—that make the tax administratively complex. Low administrative capacities in developing countries further handicap them in raising revenue through the PIT.
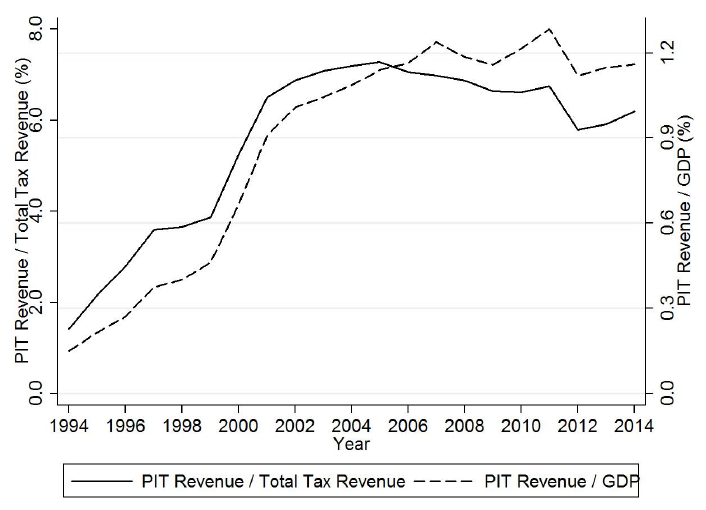
These standard explanations, however, are pretty much irrelevant for developments in China’s PIT in the last 25 years. China’s PIT revenue rapidly rose from 1994 to 2005 as percentages of total tax revenue and of GDP. But as the following figure from a 2017 paper by Professors Rong Li and Guangrong Ma at Renmin University shows, the PIT languished after 2006, at around 6% of total tax revenue and 1% of GDP. The trend since 2006 clearly bears no relationship to the rising income of the Chinese people or the maturity of Chinese tax administration.
China’s PIT revenue relative to total tax revenue and GDP (from Li and Ma 2017)
Instead, it all has to do with relentless—and highly successful—attacks on the PIT waged by China’s urban affluent class, attacks that China’s senior political leadership not only condoned but even embraced.
An essential strategy in these assaults is the thorough obfuscation of basic facts about the distribution of income in China, such as who is rich enough to be subject to tax. And this strategy is extraordinarily effective, partly because one of its most pernicious consequences is the destruction of the government’s ability to collect information about individual income. Because the PIT generates so little revenue, most tax agencies in China cannot afford to invest in auditing individual taxpayers and compiling databases about them. Therefore, even the government itself has little information about individuals’ income. Researchers studying income inequality in China thus have to rely on infrequent household surveys the government organizes, which in developed countries are generally considered less accurate (and less rich) than tax return data. (Impoverished data also makes it much harder for the painstaking work of researchers to gain academic prominence.)
Against this background, some recent analyses done by Chinese economists on the redistribution effects of China’s PIT are highly informative. The paper by Professors Li and Ma cited above used data from household surveys to simulate the impact of several increases in the monthly exemption amount for wage income that happened in 2006, 2008 and 2011. Another recent paper by researchers at Beijing Normal University (Zhan et al 2019) simulated the impact of the 2011 increase in the monthly exemption amount, as well as the consequences of even more dramatic changes in the PIT brought about by 2018 legislation. A few helpful figures from these two papers convey some basic facts about PIT changes since 2006.
One such fact is what one could almost simply call the demolition of the PIT. The monthly exemption amount for wage income was raised from CNY 800 to CNY 1,600 in 2006, and just two years later, to CNY 2,000. In 2011, this exemption amount was raised to CNY 3,500. That is, within just 5 years, the exemption level was increased by 337%. The following figure from Zhan et al 2019 shows the tax structure of the 2011 PIT on wage income against the background of the distribution of wage income in urban households.
The 2011 PIT and the Urban Wage Income Distribution
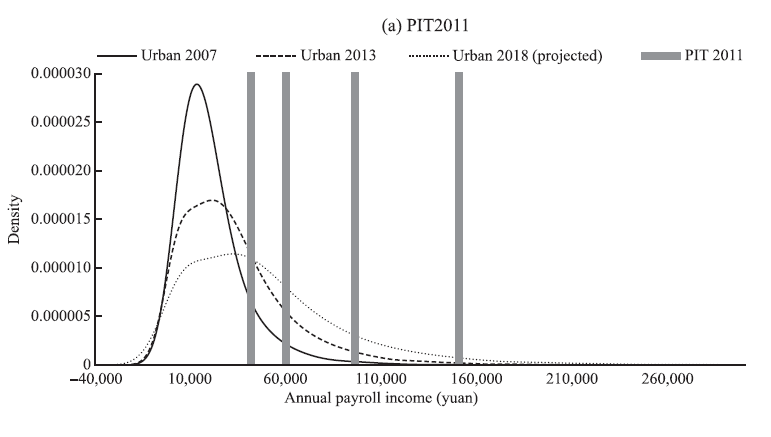
The three bell-shaped curves represent the distribution of monthly wage income in 2007, 2013, and 2018, respectively. Note that the data is based on surveys of urban households—the urban population being less than 50% of the total population in 2007 and less than 60% in 2018. That is, we are already looking at the richer half of the Chinese population. In 2007, the median wage income (somewhat to the right of the peak of the solid curve) was below CNY20,000, and most likely below the CNY 19,200 that corresponded to the CNY 1,600 monthly exemption applicable that year. In 2013, the median wage income is clearly to the left of CNY 42,000—the annual amount exempted under the 2011 PIT change—which is indicated by the first vertical bar from the left. In other words, at least half of the urban working population would have paid zero PIT on their wages in 2007 and 2011.
The second to fourth vertical bars from the left in the above figure indicate certain brackets in the 2011 PIT’s progressive rates on wage income. The second bar indicates the end of a 3% rate and the start of a 10% rate. The third bar indicates the start of a 20% rate. And the 4th indicates the start of a 25% rate. (Three higher marginal rates, 30%, 35%, and 45%, are not shown because they apply to income levels outside the range of the horizontal axis, i.e. to proportionally very few people.) It is clear that even in 2018, a vanishing portion of urban employees would have faced a marginal tax rate of 25% under progressive rates set in 2011.
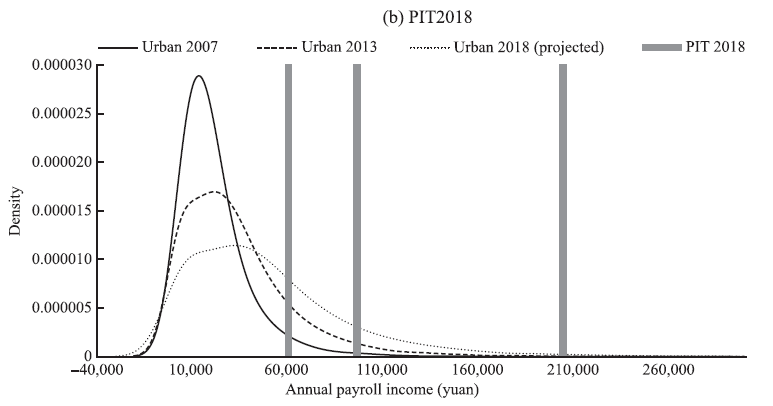
But this was not good enough for the urban affluent in China. In 2018, China raised the monthly exemption further to CNY 5,000, corresponding to an annual amount of CNY 60,000. It also further moved up the rate brackets, so that one has to earn CNY 204,000 a year to face even a 20% marginal tax rate. This is illustrated by the next figure from Zhan et al 2019 (the three vertical bars represent the start of the 3%, 10% and 20% marginal tax rates).
The 2018 PIT and the Urban Wage Income Distribution
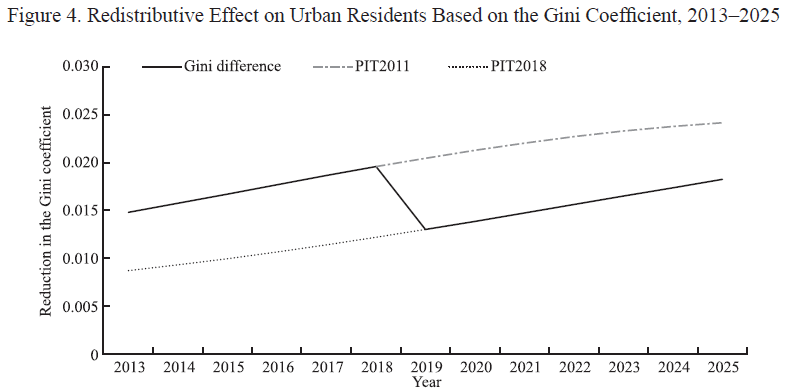
What the last two figures clearly illustrate is that, since 2008, China has been very busy cutting the PIT for the highest 10% or 5% of wage earners in the country. This has led to a dramatic reduction in the redistributive effect of the Chinese PIT. That effect was already very small to begin with. In an earlier paper in Chinese, Professors Guangrong Ma and Shi Li (along with a co-author) calculated that in 2007, the Chinese PIT had the most redistributive impact in its history, reducing China’s Gini coefficient by 1.25%. This was far smaller compared to advanced economies: Canada’s PIT, for example, reduces the Gini coefficient by about 4%. However, had the Chinese PIT been left intact after 2006, an increasing portion of the high urban wage earners would have become subject to the PIT, which would have increased the amount of redistribution in the entire population. The 2011 and 2018 tax cuts trounced this expectation. As the figure below from Zhan et al 2019 shows, the 2018 legislation sets back the PIT enough that its redistributive effect would not recover to 2017 levels even by 2025.
Even this is not the end of the story. On top of the generous exemptions and wide rate brackets, the 2018 PIT legislation introduced “additional special deductions” for high-income households, such as the mortgage interest expense deduction and deductions for children’s education. Indeed, Chinese families can send children to study in Canada and claim a PIT deduction for a portion of the expense. Zhan et al 2019 calculate that these special deductions may further remove 5% of the urban wage-earning population outside of the PIT tax base.
Unfortunately, this is a story currently buried in obscure academic journals. If you ask someone from China, that person is more likely than not to tell you that the PIT is high in China. This is first because the individuals from China one meets in North America are likely to be high-wage earners. It is also because even if that person may actually pay no or very little PIT in China, the Chinese news outlets she reads will have repeated falsehoods about the PIT for years. According to Chinese media targeted at the white-collar class, the low PIT rates in Hong Kong and Singapore are the international norm, and China needs to cuts its top marginal tax rates to 20% to be “internationally competitive.” The government’s lack of information and the white-collar media’s determination to disseminate mis-information generate a vicious circle. The work of inequality scholars is bound to be marginalized.
 Follow