
Developing an infographic with and for patient partners about conference abstracts
by Dr. Dawn Richards
Le français suit / French follows
The research and scientific worlds are full of processes and protocols that most people in these worlds take for granted. One of these items is the conference abstract. If you’re not in the research world, how would you describe a conference abstract to someone outside of research?
In planning for the Canadian Arthritis Research Conference 2022 (CARC), the Steering Committee created a new category of abstracts, those prepared and submitted by patients. The idea is to encourage more patients to submit abstracts for consideration to the conference, but how can you do that if you don’t even know what an abstract is? What happened was an organic process:
- I put out an initial call on Twitter from @TO_dpr, and asked patient partners to let me know if a resource or tool helping people know more about what abstracts are would be helpful. The overwhelming response was ‘yes.’
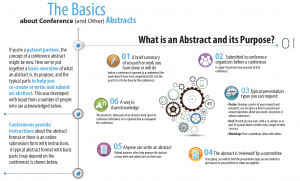
- Next, I drafted some text that described what an abstract is, what it’s used for and what the parts of an abstract are. My goal was to help demystify abstracts.
- Back on Twitter again, I followed up my original tweet and asked people to comment on the text for me via Google Forms, so that we could ultimately create something that was useful to patient partners. Through Google Forms I collected responses from 17 individuals, and incorporated their feedback into the text about abstracts.
- From there, my communications colleague helped to put the text into an infographic that made everything feel simple and uncluttered.
- I circled back to everyone who provided me with input – to let them know how they contributed, and where they can find the infographic, and if they wanted to be thanked, they are acknowledged on the infographic itself.
View the full Infographic in English here: Infographic_Abstract Preparation for Conferences and in French: Infographic _ Abstract Preparation for Conferences _FR
Within a matter of weeks, we went from having an idea about a resource on conference abstracts to having an infographic about conference abstracts created with input from patients. Engaging patients to co-create resources doesn’t always need to be a large, formal project. Our little project shows the power of taking a fairly simple idea, crowdsourcing input from patients through social media, and then putting that input in to action to create an infographic that anyone can use. We hope knowing this helps you with any of your co-creation projects – from big to small.
Création d’une infographie en collaboration avec les patients partenaires sur la préparation d’un résumé en vue d’un congrès
Dre Dawn Richards
Les mondes de la recherche et de la science regorgent de processus et de protocoles que la plupart des experts tiennent pour acquis. Parmi ces éléments, on retrouve les résumés rédigés en vue d’un congrès. Si vous ne faisiez pas partie du monde de la recherche, comment décririez-vous ces résumés à une personne néophyte?
Durant la planification de l’édition 2022 de la Conférence canadienne de recherche sur l’arthrite (CCRA), le comité directeur a créé une nouvelle catégorie de résumés, soit ceux préparés et soumis par des patients. Le but était d’encourager davantage de patients à soumettre des résumés pour le congrès. Mais comment s’y prendre quand on ne sait pas ce qu’est un résumé exactement? Une fois la question posée, la réponse n’a pas tardé à venir de façon tout à fait naturelle :
- J’ai d’abord lancé un appel à tous sur Twitter à partir du compte @TO_dpr pour demander aux patients partenaires si une ressource ou un outil expliquant ce qu’était un résumé leur serait utile. Ils ont presque unanimement répondu « oui ».
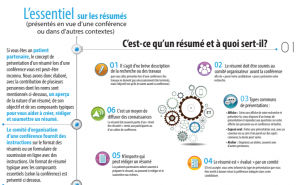
- J’ai ensuite rédigé un texte décrivant le résumé, notamment son utilisation et les différents éléments qui le composent. Mon objectif était de démystifier les résumés.
- De retour sur Twitter, j’ai donné suite à mon gazouillis initial en demandant aux gens de m’envoyer leurs commentaires sur mon texte dans un formulaire Google, pour que nous puissions proposer une ressource utile aux patients partenaires. Sur Google Formulaires, j’ai recueilli les commentaires de 17 personnes et les ai incorporés à mon texte.
- Une personne avec laquelle je travaille qui s’y connaît en communication m’a ensuite aidée à convertir mon texte en une infographie présentant l’information de façon simple et épurée.
- J’ai écrit à toutes les personnes qui m’avaient envoyé leurs commentaires pour leur dire comment elles avaient contribué et où elles pouvaient trouver l’infographie, et pour leur demander si elles souhaitaient que leur nom figure directement sur l’infographie en guise de remerciement.
Vous pouvez consulter l’infographie ici : Infographic – Abstract Preparation for Conferences (anglais) ou Infographie – Préparation d’un résumé pour un congrès _FR (français)
En quelques semaines, nous sommes donc passés d’une simple idée à une ressource bien concrète, créée en collaboration avec des patients. De toute évidence, la mobilisation des patients ne se limite pas aux gros projets officiels. Notre modeste projet montre l’efficacité d’une idée plutôt simple – recueillir les commentaires de patients au moyen des réseaux sociaux – pour créer une infographie accessible à tous. Nous espérons que cette histoire de réussite vous guidera dans vos propres projets de cocréation, quelle que soit leur taille.