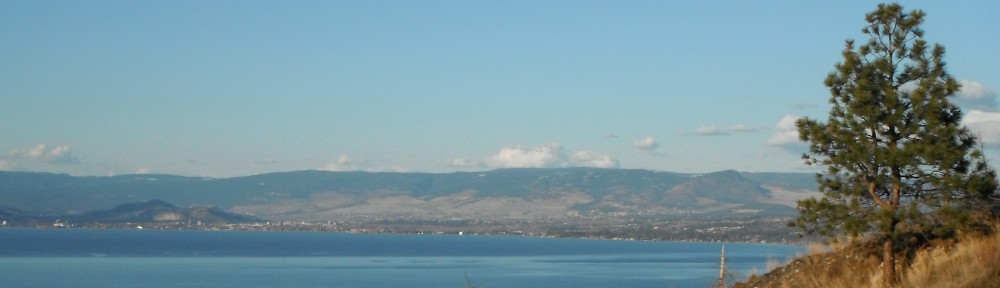
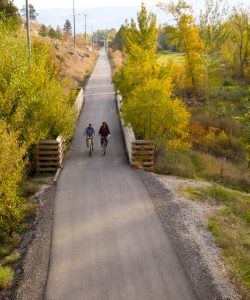
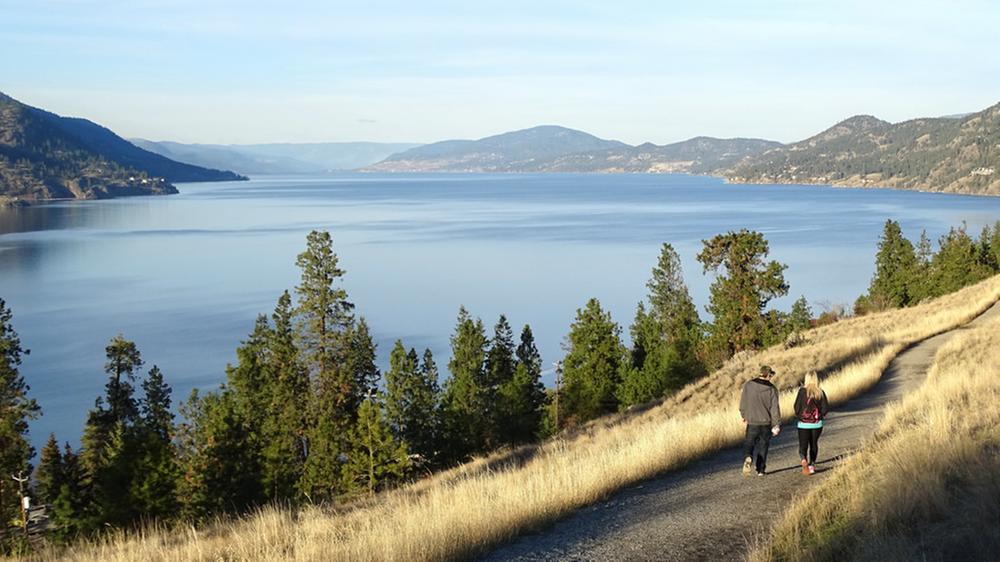
Okanagan rail trail. Photo credit Tourism Kelowna.
I like urban parks and pathways. I believe that public green spaces are important for our connection to the environment, to each other, and for encouraging healthy physical activity. My education as an economist also makes me wonder about measuring the value that public green spaces in our cities provide.
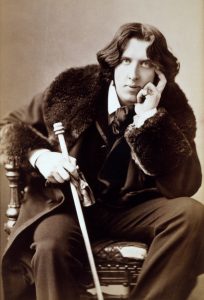 Oscar Wilde is credited with defining a cynic as someone who “knows the price of everything and the value of nothing.” Practitioners of the dismal science (economics) are often seem pretty cynical, and Wilde’s definition sees frequent application to economists who talk about the value of things like public parks. Maybe I’ll confirm Wilde’s cynicism.
One of the pleasures of being an academic is learning about the research others are doing. Recently, I attended (virtually) a talk by Dr. Peter Tsigaris of Thompson Rivers University. Dr. Tsigaris had charged his students with calculating an estimate of the value of the services provided by a number of Kamloops city parks. Many economists would argue that the best approaches to estimate these values is to carefully observe and interview park users and/or carefully analyse how property prices are affected by proximity to the park. Both of these primary research approaches are expensive and time consuming, beyond what can be achieved within the time available for a class project.
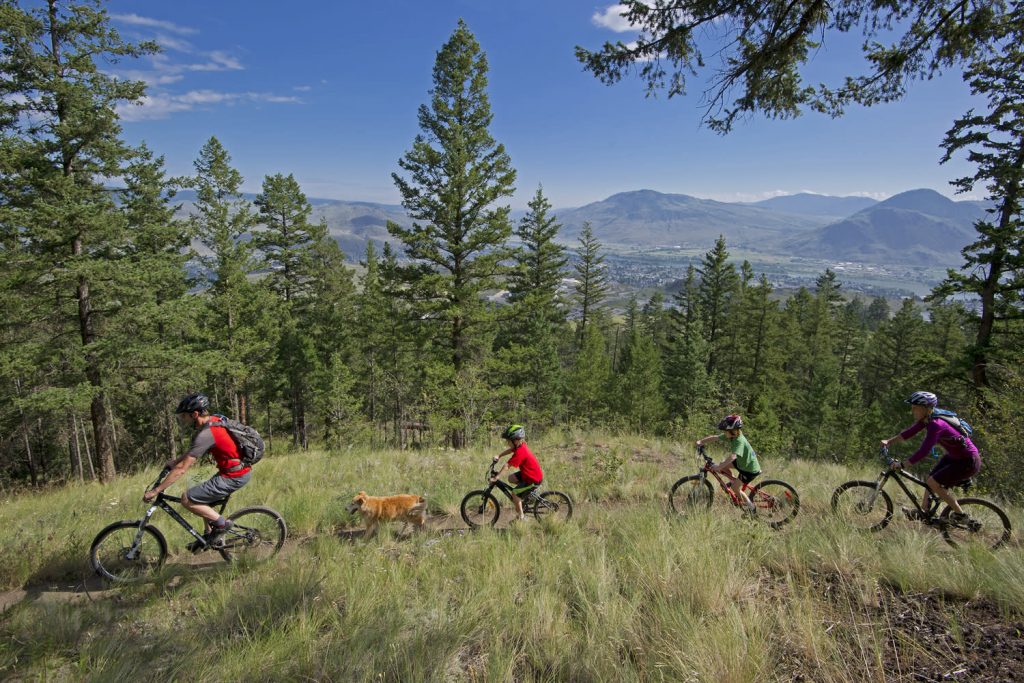
Kenna Cartwright Park. Photo credit Tourism Kamloops.
I would be one of those people who would reveal a high value for using or living close to protected green space. Conducting and reviewing this type of research reminds me that my own values may not be near the average of those in my community.
The cost and time challenges of primary research have created a demand from policy makers for quicker and cheaper ways to come up with value estimates. The resulting approach, known as ‘Benefit Transfer’, consists of adapting values from primary research done somewhere else to the site where a value of services is sought, those Kamloops parks.
The trick is finding primary research that is similar enough to the thing for which a value is sought. One solution to this challenge, known as ‘Meta Analysis’, is to collect results from a number of previous research projects and look at how differences among these projects are reflected in different value estimates. One recent meta analysis, by Bockarjova, Botzen and Koetse (2020), collected results from 60 previous studies, identifying features of green and blue nature and the urban settings where they are that predict the estimates of the value of those services reported in those reviewed studies. The results of this analysis were used by Dr. Tsigaris’ students in their Kamloops park value estimates.
In terms of estimated value provided per hectare of protected area, some of the important features identified by Bockarjova, Botzen and Koetse include:
- Area: Larger parks provide more services. The value of the services per hectare falls as the protected area size increases. That means that all else equal, two urban protected areas provide more service value than one protected area that is double the size.
- GDP: Urban areas with higher average income get more value from their urban protected areas.
- Population Density: Urban areas with more people per unit area get more value from their protected areas. As we densify our cities, providing protected areas is even more important.
- Park: If the type of protected area is a park, providing a variety of recreation and public use opportunities, it provides substantially more service value than other forms of protected areas.
- Water: Protected areas that involve water as well as land generate more service value.
- Complexity: Protected areas that provide a variety of landscapes provide a variety of environmental services. Some research showed this to generate higher value.
The analysis results in equations that can be used to predict the per hectare value of protected urban space. I’ve put the equations at the end of this post. If you are interested in the details, have a look. To apply the results developed by Bockarjova, Botzen and Koetse (2020), find and plug in the relevant values for an existing or potential protected area.
Note that analyses like these identify things that are common across the previous research. They are not able to capture the influence of unique features of individual protected areas. They also tend to be conservative (lowballing benefits and highballing costs), as the analysts prefer to underestimate the values. This is done so that possible mistakes in their analysis are more likely to result in a bigger value than a smaller value. Decision makers who might use these numbers prefer to be accused of making an investment that generates a return that is larger than expected rather than one that is smaller than expected.
Knox Mountain Park
Knox Mountain Park. Photo credit iHeartRadio AM 1150.
Knox Mountain Park is an iconic park in Kelowna. It covers a bit over 367 hectares. It provides a variety of landscapes and recreational opportunities. It is not a small urban park, nor does it provide much connection to water.
The city of Kelowna has a population density of 680 persons per square kilometer, and the larger metropolitan area (RDCO) has a population density of 76 persons per square kilometer. The per capita GDP in this area is $46,828. If we plug these number in we get the following results.
| Studies used in model: | All Studies | European Studies |
|---|---|---|
| Per hectare annual value: | 103,425 | 99,124 |
| Total annual value: | 37,956,840 | 36,378,570 |
It is rewarding to find a large number representing the value that Knox Mountain Park provides to Kelowna. Based on the proposed management plan for Knox Mountain Park (Management Plan Update 2022), the city is proposing to spend something over $340,000 per year on maintaining and upgrading the quality of the services provided by the park, which amounts to less than one percent of the estimated annual value of those services. The people of Kelowna love Knox Mountain park, and there is little chance that land will be taken out of the park. In fact, in recent years, the city has acquired some additions to this park which, given the estimated annual value of the services, is likely a good investment.
expanded downtown waterfront park
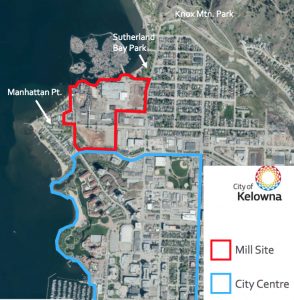
Source credit Kelowna Daily Courier.
We might also use the numbers these researchers have estimated to assess potential land use plans. Recently the Tolko mill in the north end of Kelowna was permanently closed, and planning for the future of the site is underway. Some people, such as myself, would like to see that future including a significant amount of public waterfront. The numbers below are calculated as if five hectares of waterfront park is added to the current 1.69 hectare Sutherland park.
| Studies used in model: | All Studies | European Studies |
|---|---|---|
| Sutherland Park value: | 39,007,226 | 28,846,826 |
| Expanded Sutherland Park value: | 40,987,977 | 31,458,862 |
| Difference: | 1,980,751 | 2,612,037 |
The calculations yield an annual value of more than thirty million in service value from 1.69 hectare Sutherland park, with about two million in annual value added with a 5 hectare addition. This calculation ignores the fact that there are alternative downtown waterfront parks that provide similar services to what this addition would provide that are close by. There are more than 26 hectares of waterfront park from the base of Knox Mountain to the highway 97 bridge across Okanagan Lake. If we consider adding five hectares to the current 26.87 hectares of park, then the calculations yield the following.
| Studies used in model: | All Studies | European Studies |
|---|---|---|
| Downtown Waterfront Parks value: | 43,091,815 | 34,338,794 |
| Expanded Downtown Waterfront Parks value: | 43,357,367 | 34,709,970 |
| Difference: | 265,552 | 371,176 |
These calculations result in an annual service value of about $300,000 from the five hectare expansion. Taken together these results suggest that the value of the services that adding five hectares of waterfront park to the existing downtown waterfront parks would be somewhere between $300,000 and $2,000,000 per year.
How do we interpret these numbers? The logic behind this approach implies that having Knox Mountain Park in our city is worth about the same as sprinkling $37 million per year across the population of the city. Likewise, adding five hectares of waterfront park when the Tolko lands are redeveloped is like sprinkling somewhere between $300,000 and $2,000,000 per year across the population.
This value is not distributed equally. People who live close to the park use it more and gain more benefit. These residents may pay more for housing (rent or ownership) because they live close to the park, so that some of this benefit is captured by property owners. For a waterfront park with easy access to food services, some of that value shows up as revenue for businesses near the park. Some of it will be money saved by people who would otherwise pay it to access other recreational opportunities that are farther away. In the next part of this blog, I will explore a bit more how these impacts are distributed.
Photo credit Kelowna Now.
To me, a key message is that while from an accounting perspective, parks are cost centers, they are also assets that provide services which can be very valuable. Expenditures on existing parks are maintaining assets that provide valuable services, and expanding parks are investments to acquire assets that can provide valuable services. Raising our local taxes to invest in parks can pay a very healthy return to our community!
- Bockarjova, Marija, Wouter JW Botzen, and Mark J. Koetse. “Economic valuation of green and blue nature in cities: A meta-analysis.” Ecological Economics 169 (2020): 106480.
benefit transfer equations
There are two equations offered in the research paper, one based on all the research they surveyed, and one based only on that research which looked at protected areas in Europe.
Benefit transfer function based on European studies:
![\\\ Service\ Value\ per\ Hectare = \exp [ 8.005 \\ - 0.937 \times ( \ln(Area\ in\ Hectares) - \ln(472) ) \\ + 1.496 \times (\ln(GDP\ per\ capita) - \ln(28,007)) \\ + 0.201 \times (\ln(Pop.\ Density) - \ln(211)) \\ + 2.402 \times (1\ for\ Park) + 0.837 \times (1\ for\ Small\ Urban\ Green) \\ + 0.107 \times (1\ for\ Water) - 0.807 \times (1\ for\ Complex) \\ + 4.041 \times 0.218 - 3.424 \times 0.299 ] \\\](https://s0.wp.com/latex.php?latex=%5C%5C%5C+Service%5C+Value%5C+per%5C+Hectare+%3D+%5Cexp+%5B+8.005+%5C%5C+-+0.937+%5Ctimes+%28+%5Cln%28Area%5C+in%5C+Hectares%29+-+%5Cln%28472%29+%29+%5C%5C+%2B+1.496+%5Ctimes+%28%5Cln%28GDP%5C+per%5C+capita%29+-+%5Cln%2828%2C007%29%29+%5C%5C+%2B+0.201+%5Ctimes+%28%5Cln%28Pop.%5C+Density%29+-+%5Cln%28211%29%29+%5C%5C+%2B+2.402+%5Ctimes+%281%5C+for%5C+Park%29+%2B+0.837+%5Ctimes+%281%5C+for%5C+Small%5C+Urban%5C+Green%29+%5C%5C+%2B+0.107+%5Ctimes+%281%5C+for%5C+Water%29+-+0.807+%5Ctimes+%281%5C+for%5C+Complex%29+%5C%5C+%2B+4.041+%5Ctimes+0.218+-+3.424+%5Ctimes+0.299+%5D+%5C%5C%5C+&bg=ffffff&fg=000000&s=0 "\\\ Service\ Value\ per\ Hectare = \exp [ 8.005 \\ - 0.937 \times ( \ln(Area\ in\ Hectares) - \ln(472) ) \\ + 1.496 \times (\ln(GDP\ per\ capita) - \ln(28,007)) \\ + 0.201 \times (\ln(Pop.\ Density) - \ln(211)) \\ + 2.402 \times (1\ for\ Park) + 0.837 \times (1\ for\ Small\ Urban\ Green) \\ + 0.107 \times (1\ for\ Water) - 0.807 \times (1\ for\ Complex) \\ + 4.041 \times 0.218 - 3.424 \times 0.299 ] \\\")
Benefit transfer function based on all studies:
![\\\ Service\ Value\ per\ Hectare = \exp [ 7.718 \\ - 0.964 \times ( \ln(Area\ in\ Hectares) - \ln(1474) ) \\ + 1.527 \times (\ln(GDP\ per\ capita) - \ln(23,026)) \\ + 0.241 \times (\ln(Pop.\ Density) - \ln(396)) \\ + 1.674 \times (1\ for\ Park) + 0.059 \times Forest - 0.144 \times (1\ for\ Small\ Urban\ Green) \\ - 0.589 \times (1\ for\ Green\ Linked\ to\ Grey) + 0.221 \times (1\ for\ Water) + 0.231 \times (1\ for\ Complex) \\ + 1.900 \times 0.218 - 2.723 \times 0.299 ] \\\](https://s0.wp.com/latex.php?latex=%5C%5C%5C+Service%5C+Value%5C+per%5C+Hectare+%3D+%5Cexp+%5B+7.718+%5C%5C+-+0.964+%5Ctimes+%28+%5Cln%28Area%5C+in%5C+Hectares%29+-+%5Cln%281474%29+%29+%5C%5C+%2B+1.527+%5Ctimes+%28%5Cln%28GDP%5C+per%5C+capita%29+-+%5Cln%2823%2C026%29%29+%5C%5C+%2B+0.241+%5Ctimes+%28%5Cln%28Pop.%5C+Density%29+-+%5Cln%28396%29%29+%5C%5C+%2B+1.674+%5Ctimes+%281%5C+for%5C+Park%29+%2B+0.059+%5Ctimes+Forest+-+0.144+%5Ctimes+%281%5C+for%5C+Small%5C+Urban%5C+Green%29+%5C%5C+-+0.589+%5Ctimes+%281%5C+for%5C+Green%5C+Linked%5C+to%5C+Grey%29+%2B+0.221+%5Ctimes+%281%5C+for%5C+Water%29+%2B+0.231+%5Ctimes+%281%5C+for%5C+Complex%29+%5C%5C+%2B+1.900+%5Ctimes+0.218+-+2.723+%5Ctimes+0.299+%5D+%5C%5C%5C+&bg=ffffff&fg=000000&s=0 "\\\ Service\ Value\ per\ Hectare = \exp [ 7.718 \\ - 0.964 \times ( \ln(Area\ in\ Hectares) - \ln(1474) ) \\ + 1.527 \times (\ln(GDP\ per\ capita) - \ln(23,026)) \\ + 0.241 \times (\ln(Pop.\ Density) - \ln(396)) \\ + 1.674 \times (1\ for\ Park) + 0.059 \times Forest - 0.144 \times (1\ for\ Small\ Urban\ Green) \\ - 0.589 \times (1\ for\ Green\ Linked\ to\ Grey) + 0.221 \times (1\ for\ Water) + 0.231 \times (1\ for\ Complex) \\ + 1.900 \times 0.218 - 2.723 \times 0.299 ] \\\")
 Follow