
On this page, I share my student evaluations of teaching (SEoTs), as they are one of the important ways to evaluate teaching. UBC provides an official route through which students can evaluate teaching. Among other questions determined by individual Faculties (e.g., Arts) and departments (e.g., Psychology), the teaching of all instructors at UBC are evaluated on six “University Module Items” or simply “UMIs.” All items are rated on a 5 point scale, 5= strongly agree, 4 = agree, 3 = neutral, 2 = disagree, 1 = strongly disagree.
- UMI 1. The instructor made it clear what students were expected to learn.
- UMI 2. The instructor communicated the subject matter effectively.
- UMI 3. The instructor helped inspire interest in learning the subject matter.
- UMI 4. Overall, evaluation of student learning (through exams, essays, presentations, etc.) was fair.
- UMI 5. The instructor showed concern for student learning.
- UMI 6. Overall, the instructor was an effective teacher.
2021 update on SET reporting values: Since 2018, the administrators of student evaluations at UBC have been emphasizing the Interpolated Median (IM) instead of the Mean. Basically, the IM starts with the Median and adjusts it to account for the amount of agreement among respondents (see here for the formula). Although it’s common to use the Mean in psychology for data on a Likert-type scale, I can see the descriptive benefits of this IM value. The downside, of course, is that it’s now really tough to compare my Student Evaluations scores from pre- vs post-2018, using just the information in the output file I’m provided. So I’m starting fresh with new graphs to begin to understand my values anew.
PSYC 417 Special Topics section title: Applied Psychology of Teaching and Learning (Coming January 2022 as PSYC 427)
In May/June 2019 I piloted a new course (10 students), designed to offer upper level students rigorous engagement in applying psychology (particularly topics in social and cognitive psychology) to understand teaching and learning at the undergraduate level. People who finish this course successfully are well-positioned to apply to become a Teaching Assistant in our Psychology Department (or elsewhere). In this blog post, please find my reflections on qualitative results, including concrete changes I made in response to feedback and my own judgments.
I offered this course again in July/August 2020 for 16 students, after substantially revamping it for online-only delivery with a fully asynchronous option for those joining us around the world. It was my very first course ever that I taught fully online. A full reflection of qualitative and quantitative data is available here.
The aggregate quantitative data from both offerings appears below. Please click on the graph to enlarge it. Importantly, the response rate was low for 2020 (7/16 students responded, which is below the threshold for a class this small). Nonetheless, based on the data I have, the second offering went even better than the first. The most room to grow is in perceived fairness of assessments. I’m not altogether surprised by this, and I’m glad to see a boost from 2019 given the changes to the project. The biggest jump was in Clear Expectations — again not surprising given I’d had a chance to actually clarify my expectations.

PSYC 217 Research Methods (W2008 to W2020: 24 sections, 1957 students)
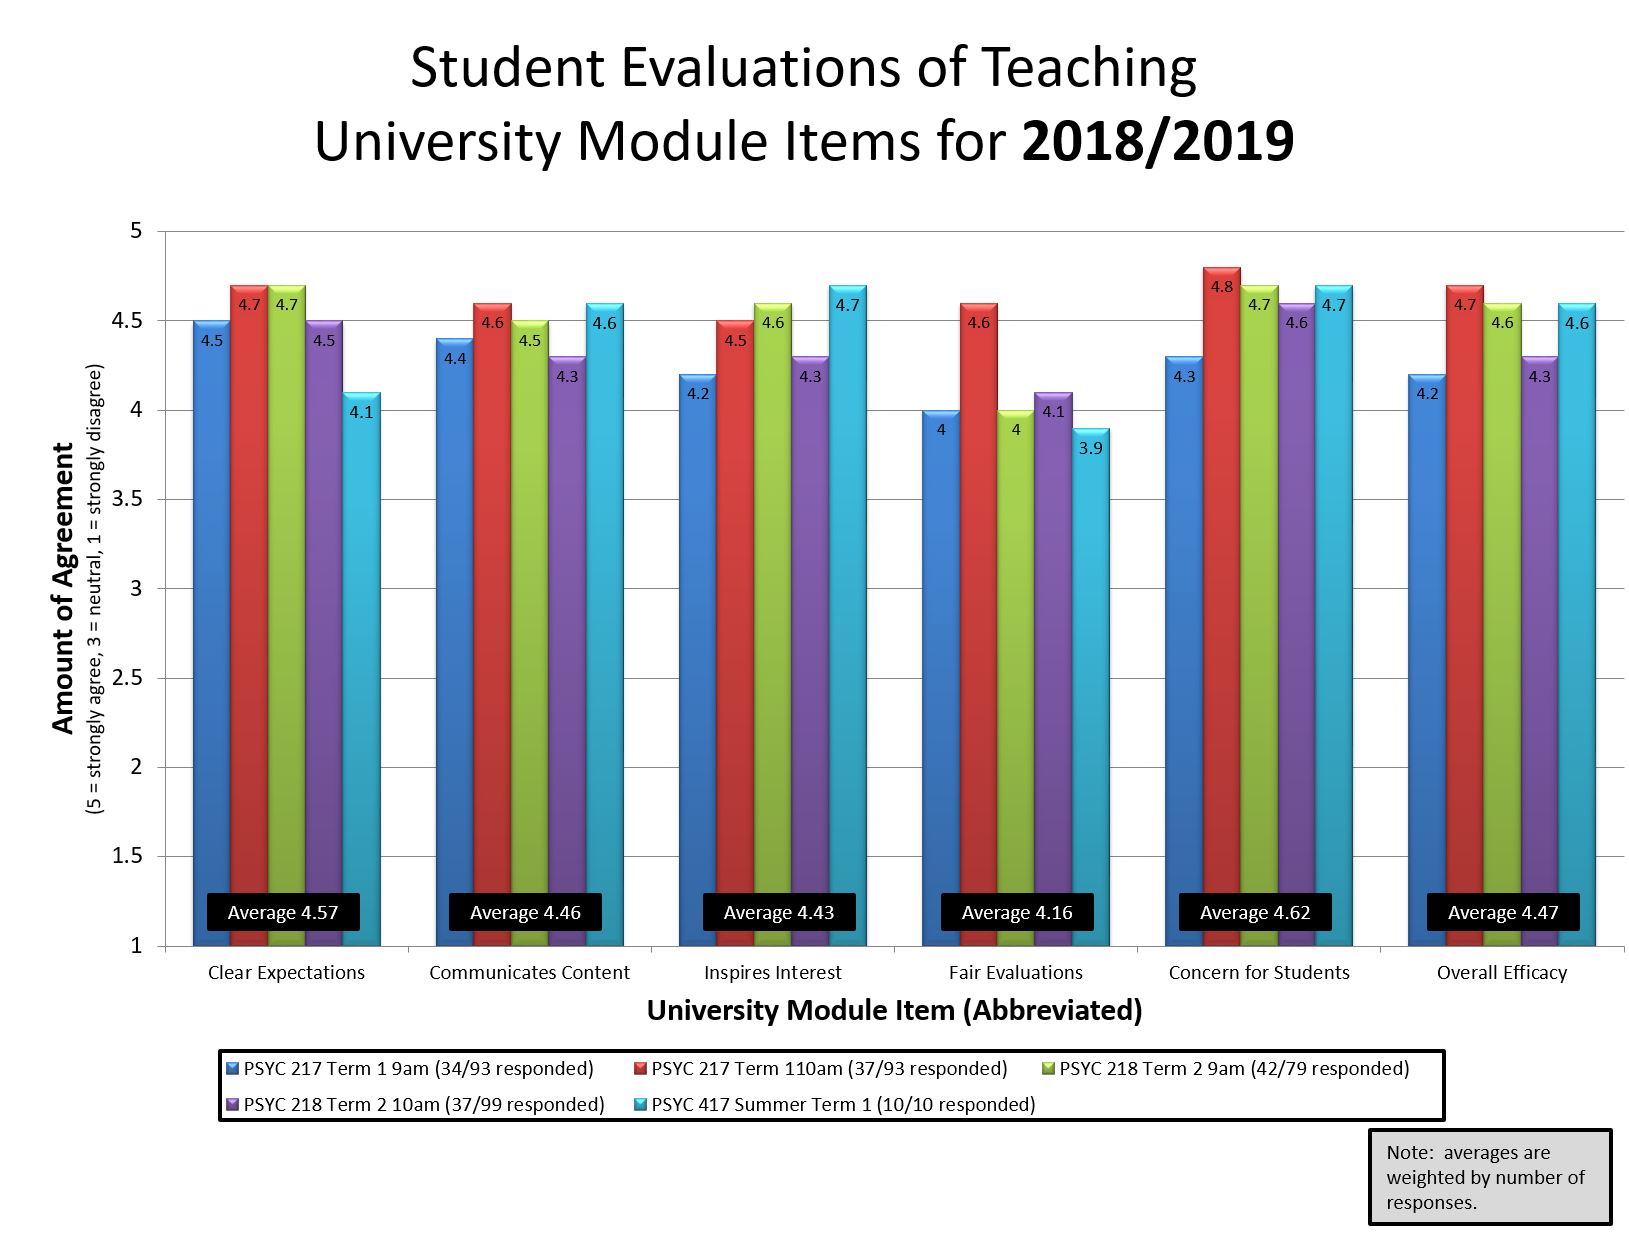
Each Fall, I teach two sections of Research Methods for Psychology Majors. In W2020, due to the pandemic, I revamped my course substantially for a fully online delivery, including a fully asynchronous option for those joining us around the world. It was my the second course ever that I taught fully online. A full reflection of qualitative and quantitative data is available here. If you just want the numbers, please click the image below to enlarge a graph of the last 3 years of aggregate quantitative data (interpolated medians, see above).

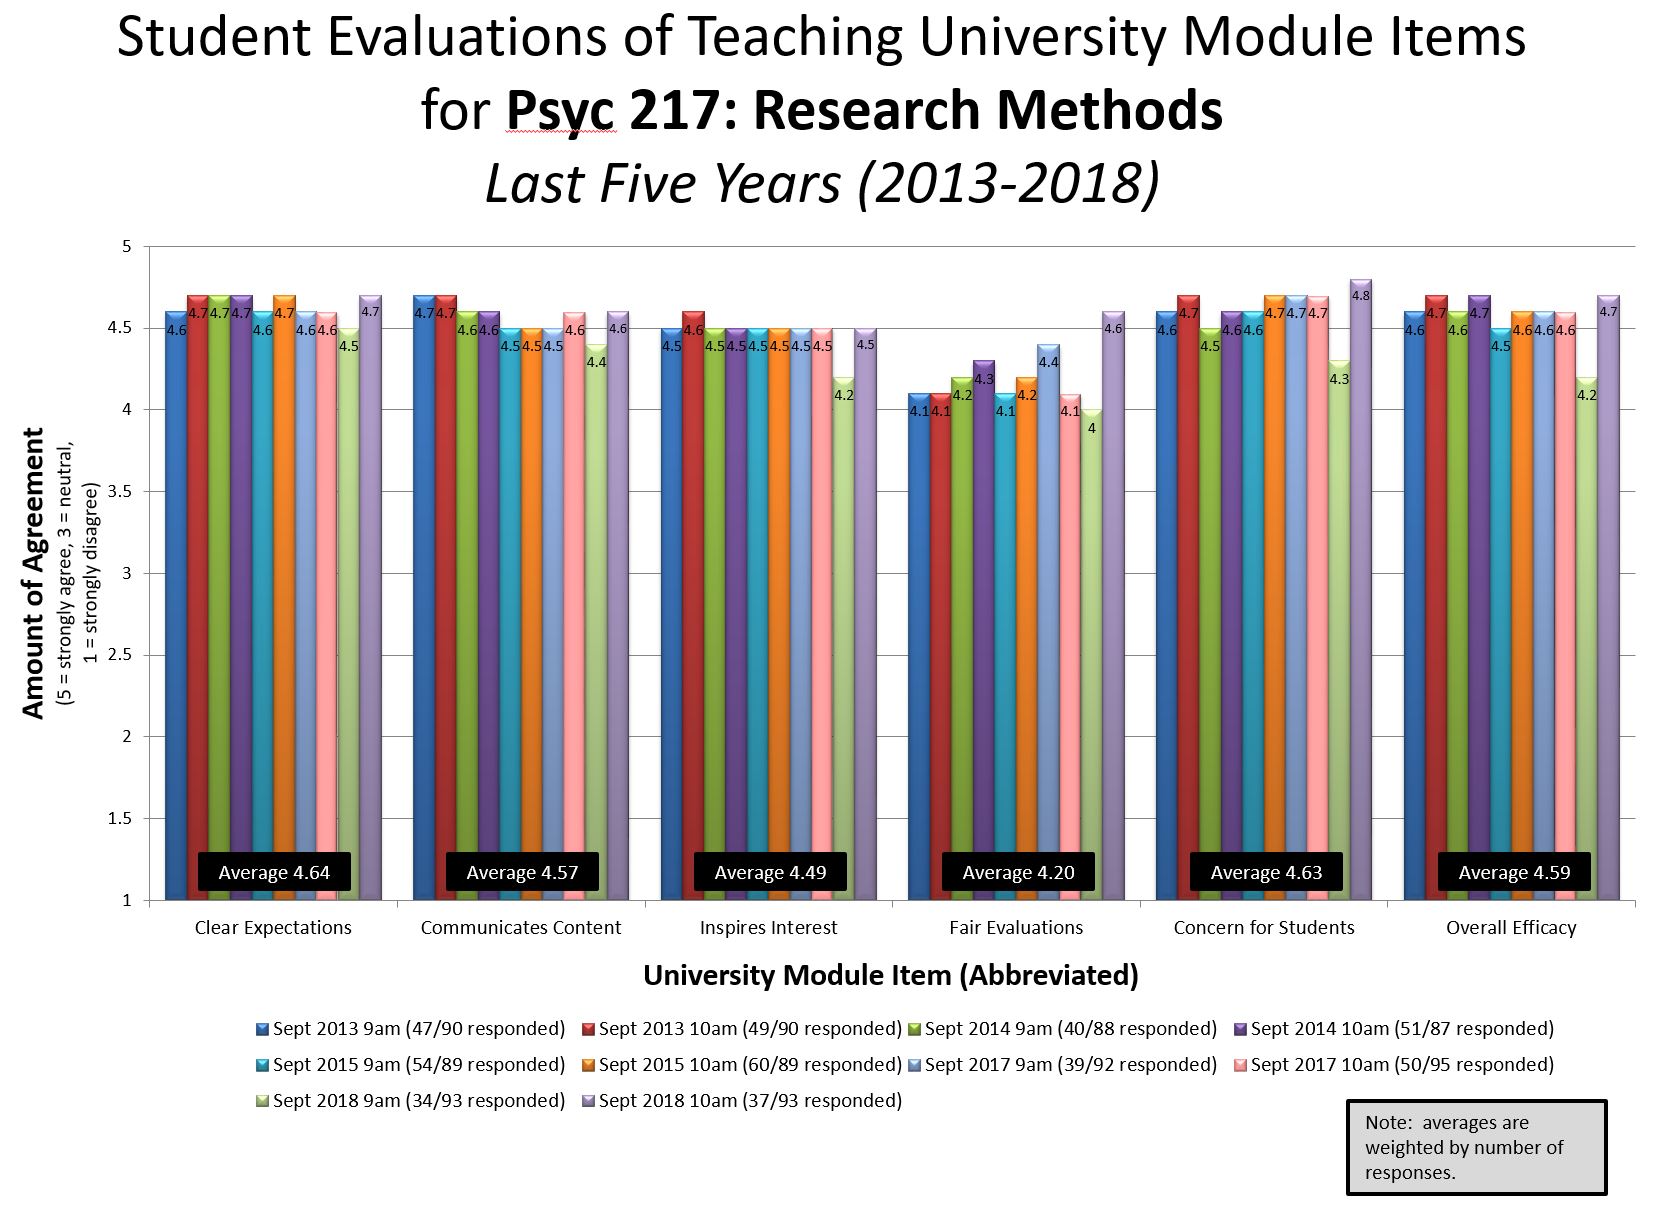
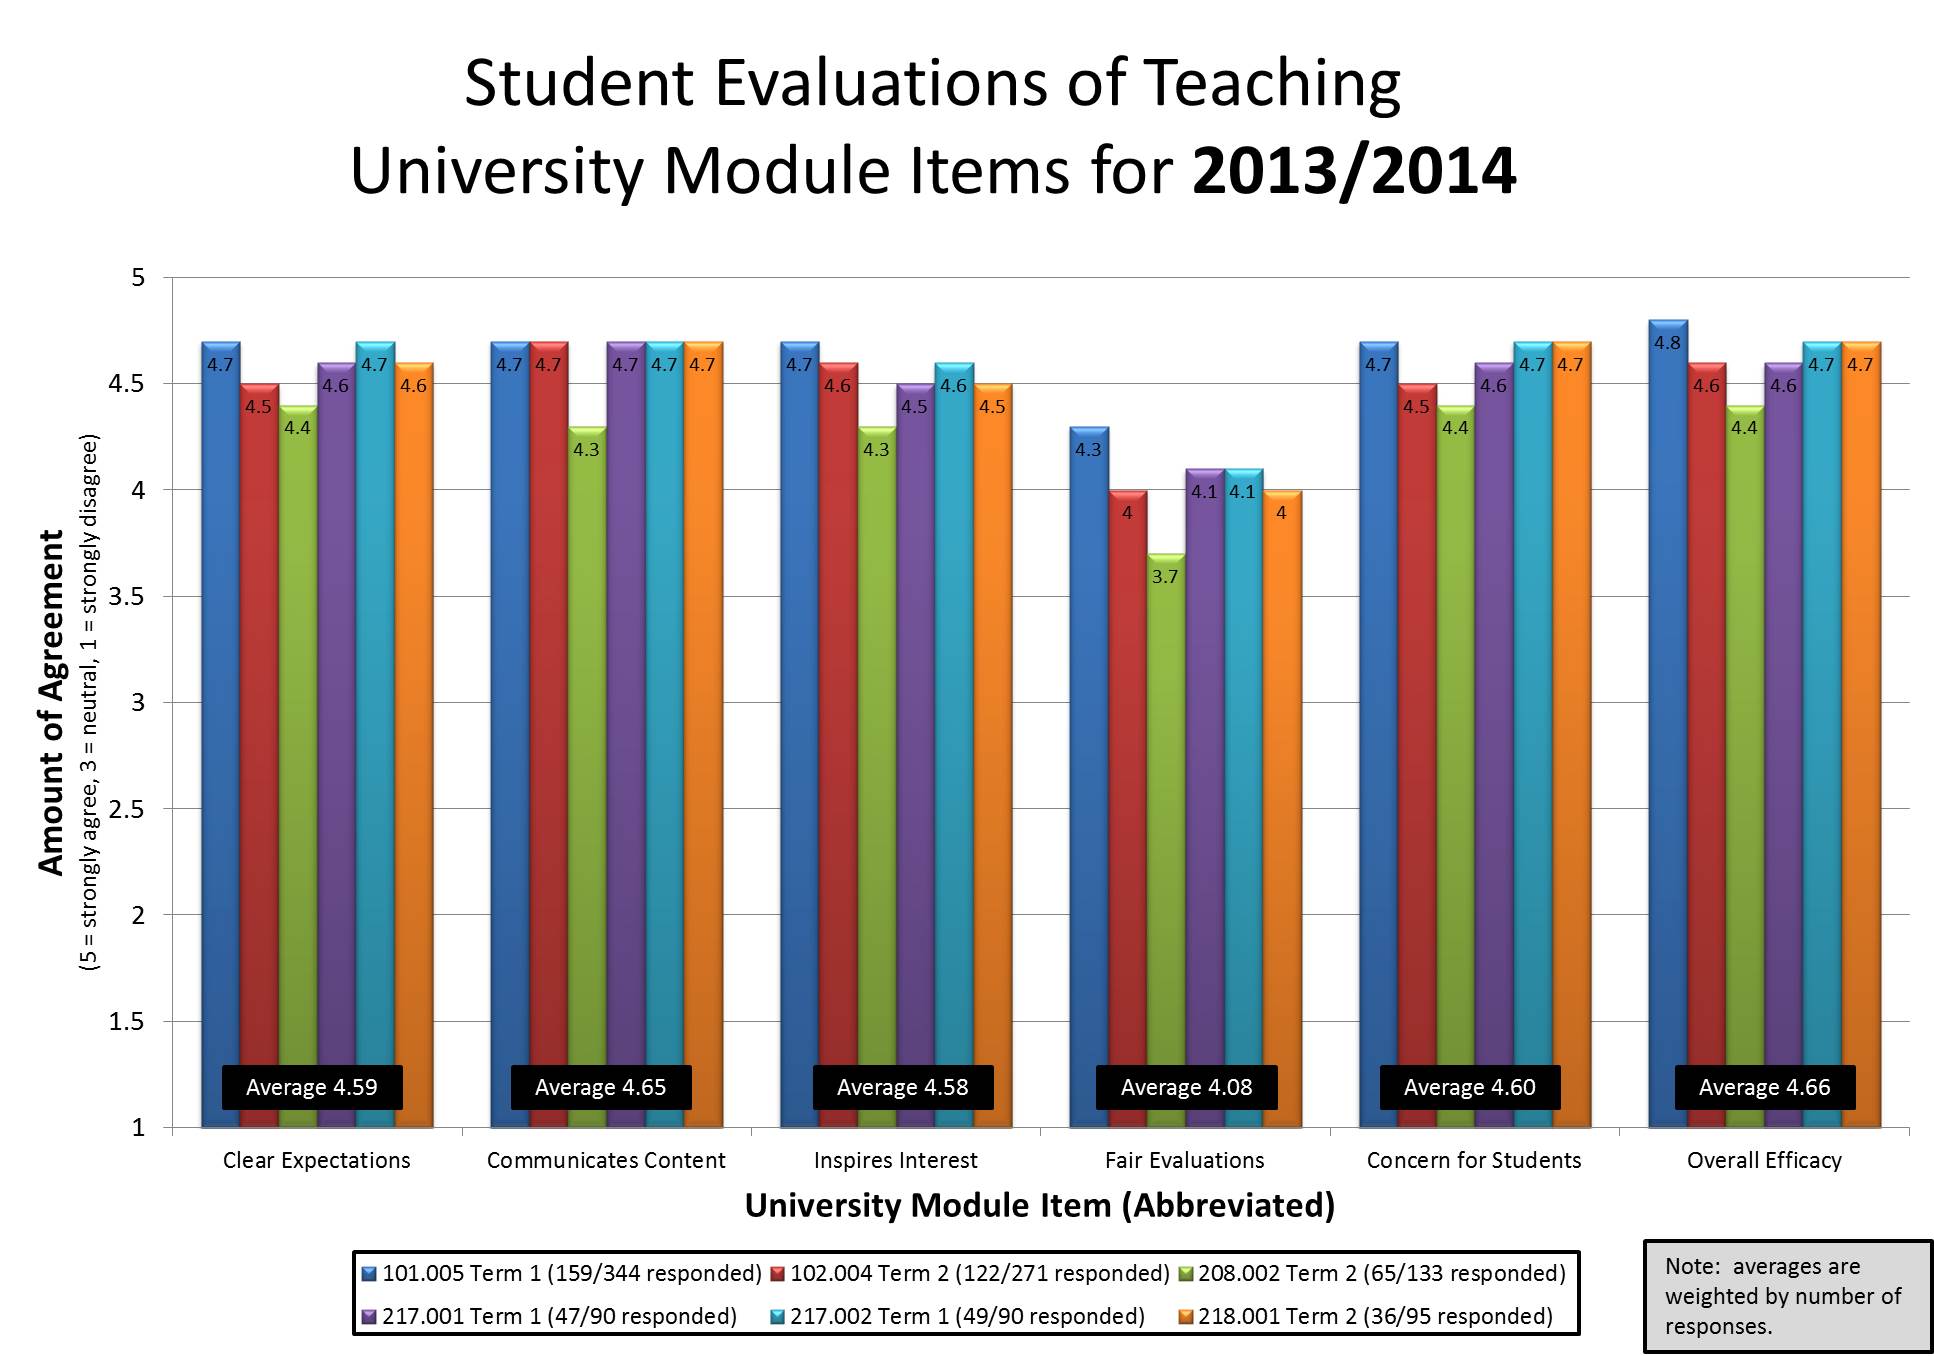
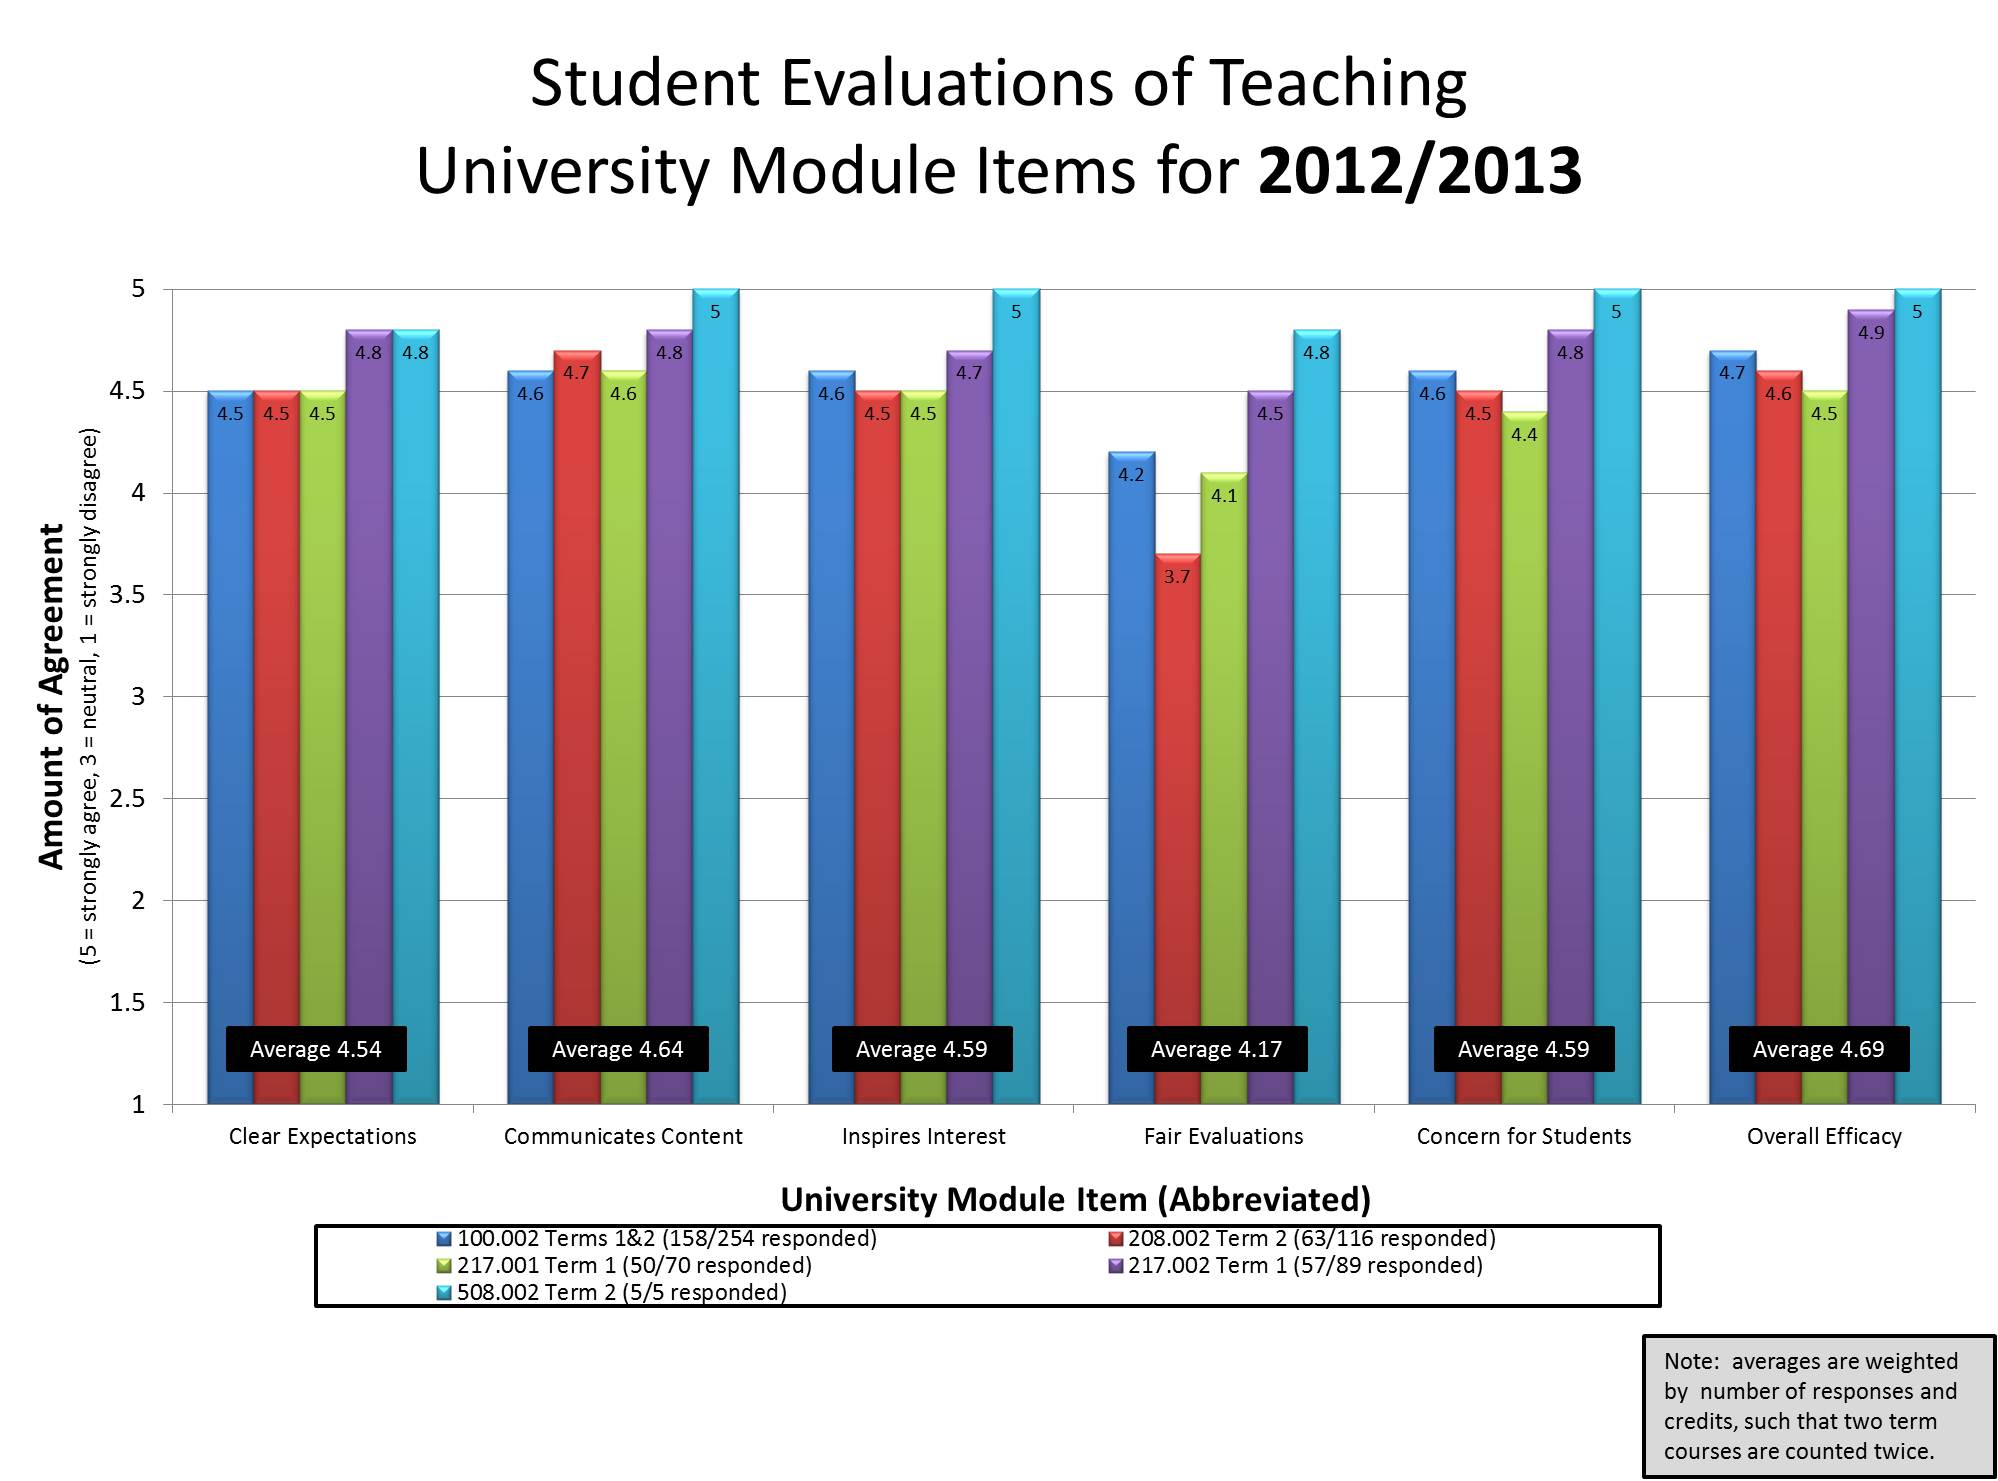
Below are student evaluation data (means) from my sections of research methods across the 2013-2018 academic years. I posted a formal response to and a summary of the qualitative and quantitative data here in 2011/2012, here in 2012/2013, here in 2013/2014, and here in 2014/2015. Note that I still read and consider all my student evaluations including all written comments, but don’t usually formally respond as they are pretty consistent year-to-year and I haven’t made substantial changes.
My favourite quote from W2018T1: “Her ability to make research methods engaging and dynamic was a welcome surprise. She clearly outlined expectations for this course, from the most detailed syllabus I’ve ever seen to concrete learning objectives that were clearly reflected in our tests. Furthermore Dr. Rawn gave the impression of a prof who truly cared about her students wellbeing. The level of respect I felt from her really added to my UBC experience this term.”
Overall, students perceive my learning assessments as much more fair than they once did when I started teaching this course. I thank past students for their candid feedback, and to colleagues whose assessment methods have inspired positive changes year over year. Please click on the graph to enlarge it.
PSYC 218 Analysis of Behavioural Data (i.e., Statistics for Psych Majors) (W2012 to W2020: 11 sections, 1026 students)
Each January term, I teach two sections of Introductory Statistics for Psychology Majors. In W2020, due to the pandemic, I revamped my course substantially for a fully online delivery, including a fully asynchronous option for those joining us around the world. It was my the second course ever that I taught fully online. A full reflection of qualitative and quantitative data is available here. If you’d just like the numbers, please click the image below to enlarge a graph of the last 3 years of aggregate quantitative data (interpolated medians, see above).
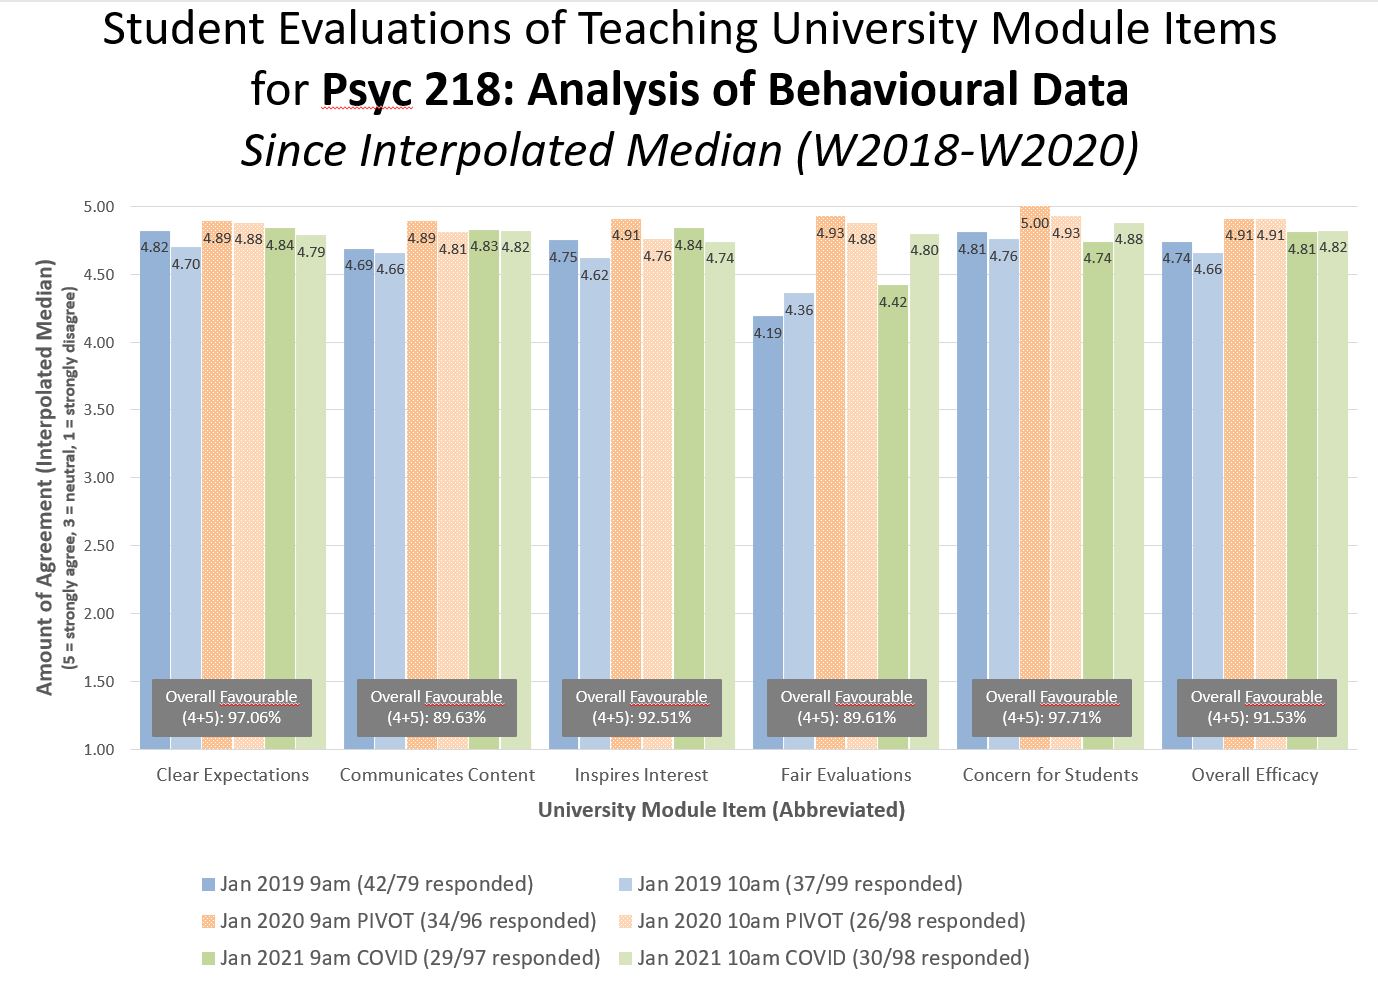
Below are student evaluation data (means) from my sections of research methods across the 2013-2018 academic years. Please click on the graph to enlarge it. I posted a response to and a summary of the qualitative and quantitative data here in 2011/2012, and here in 2013/2014. Since then, I have read and reviewed all my feedback, but have responded less formally.
My favourite quote from W2018T2 (and maybe from ever!): “She’s a tough one but I can honestly say I’m excited every time I walk into her classroom because I know she’s going to make me give it everything I’ve got.”

Archives
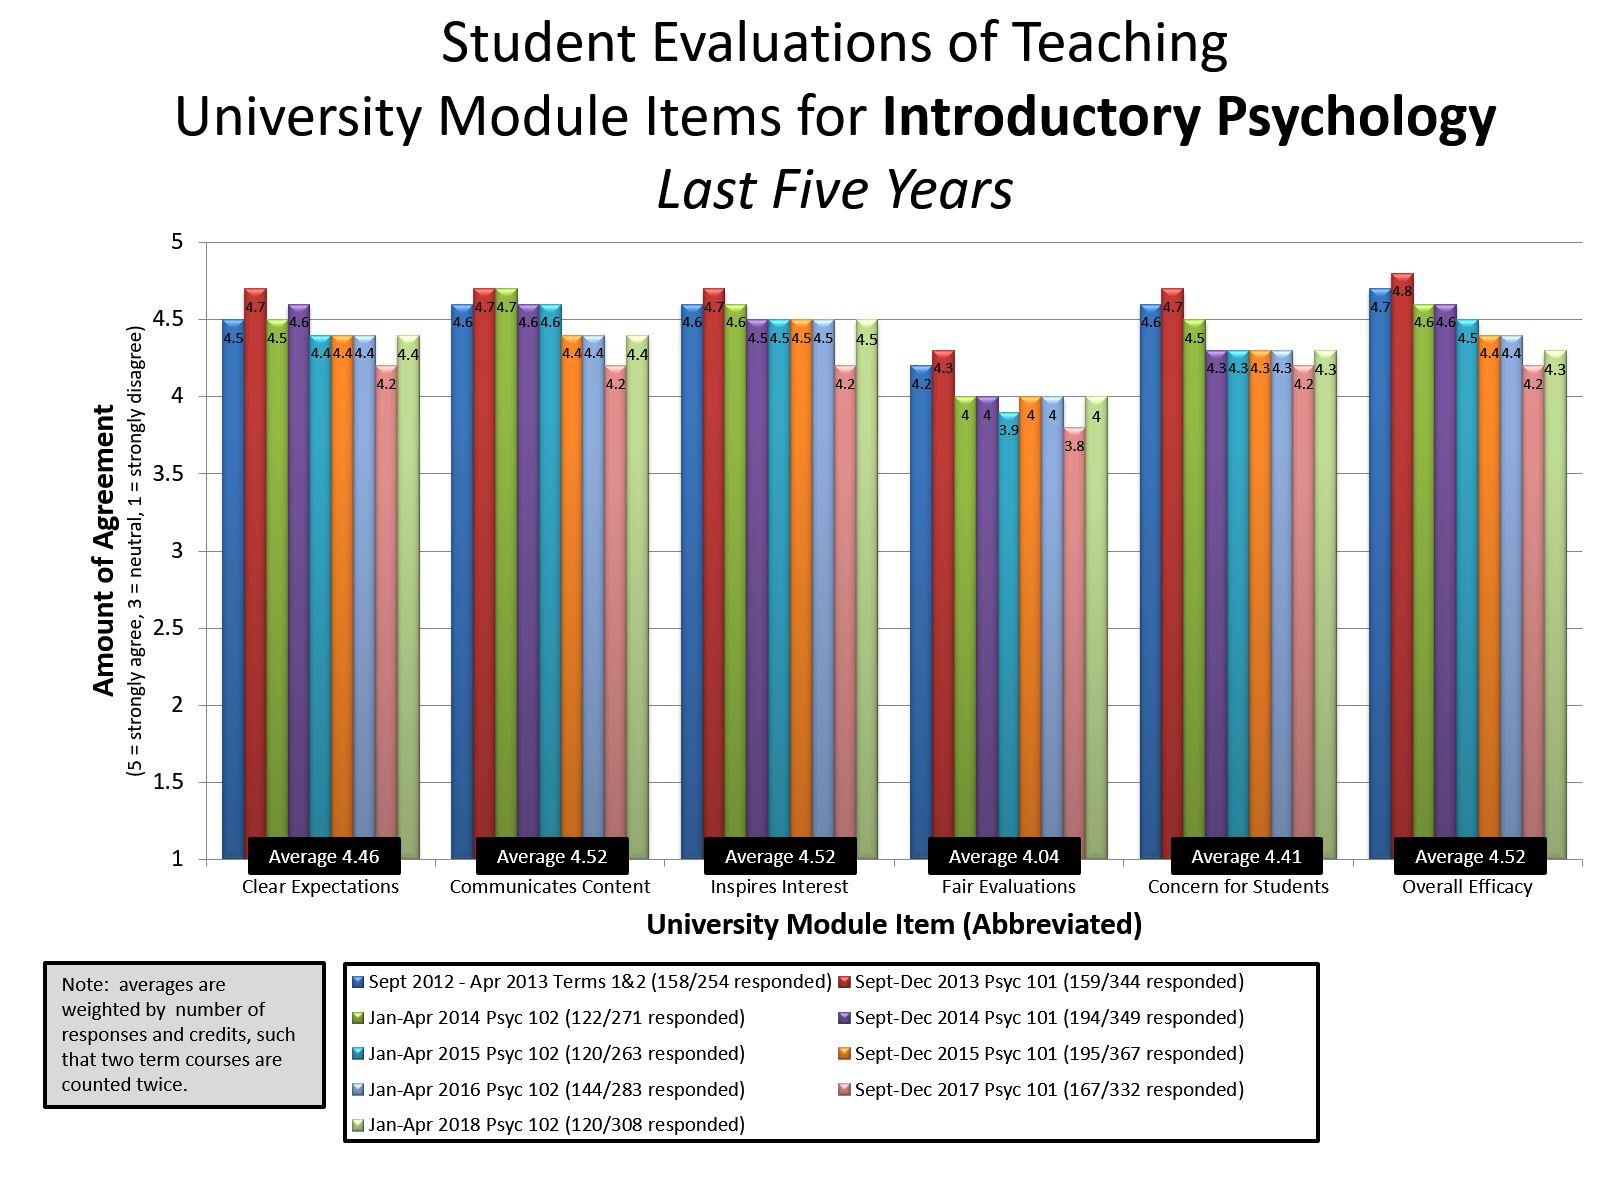
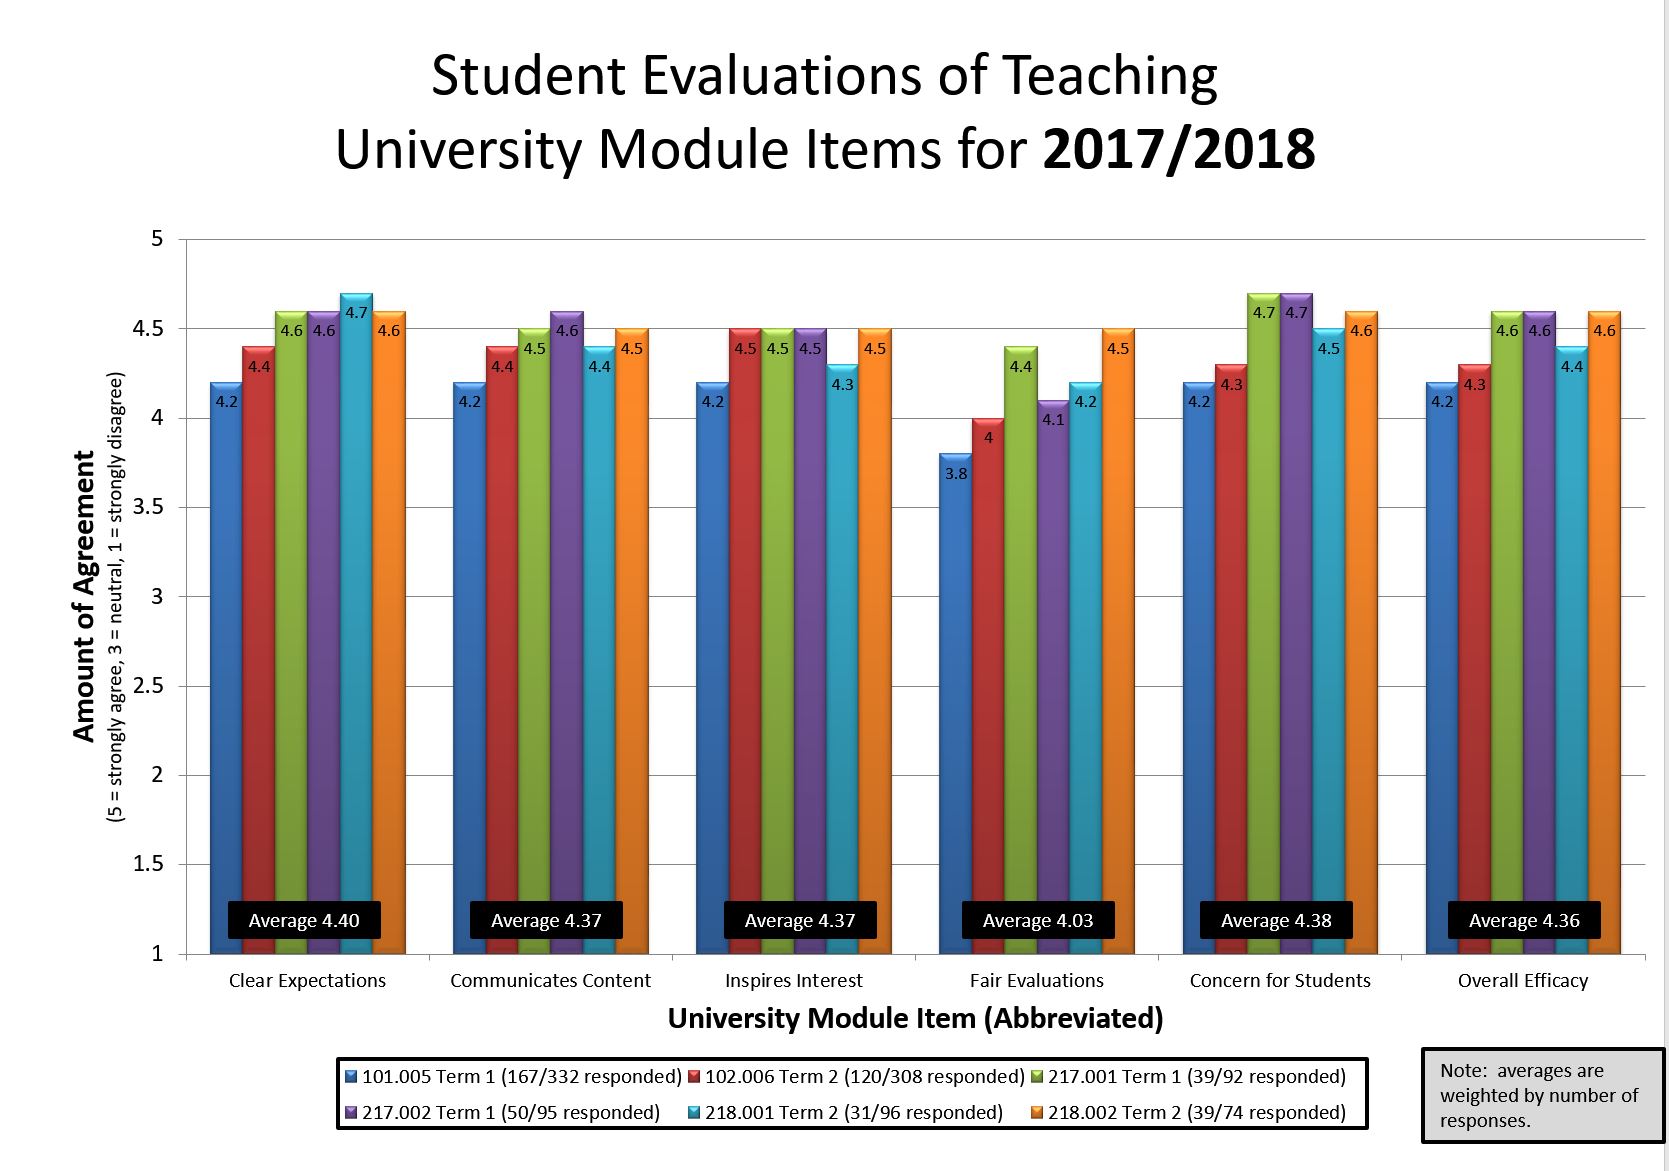
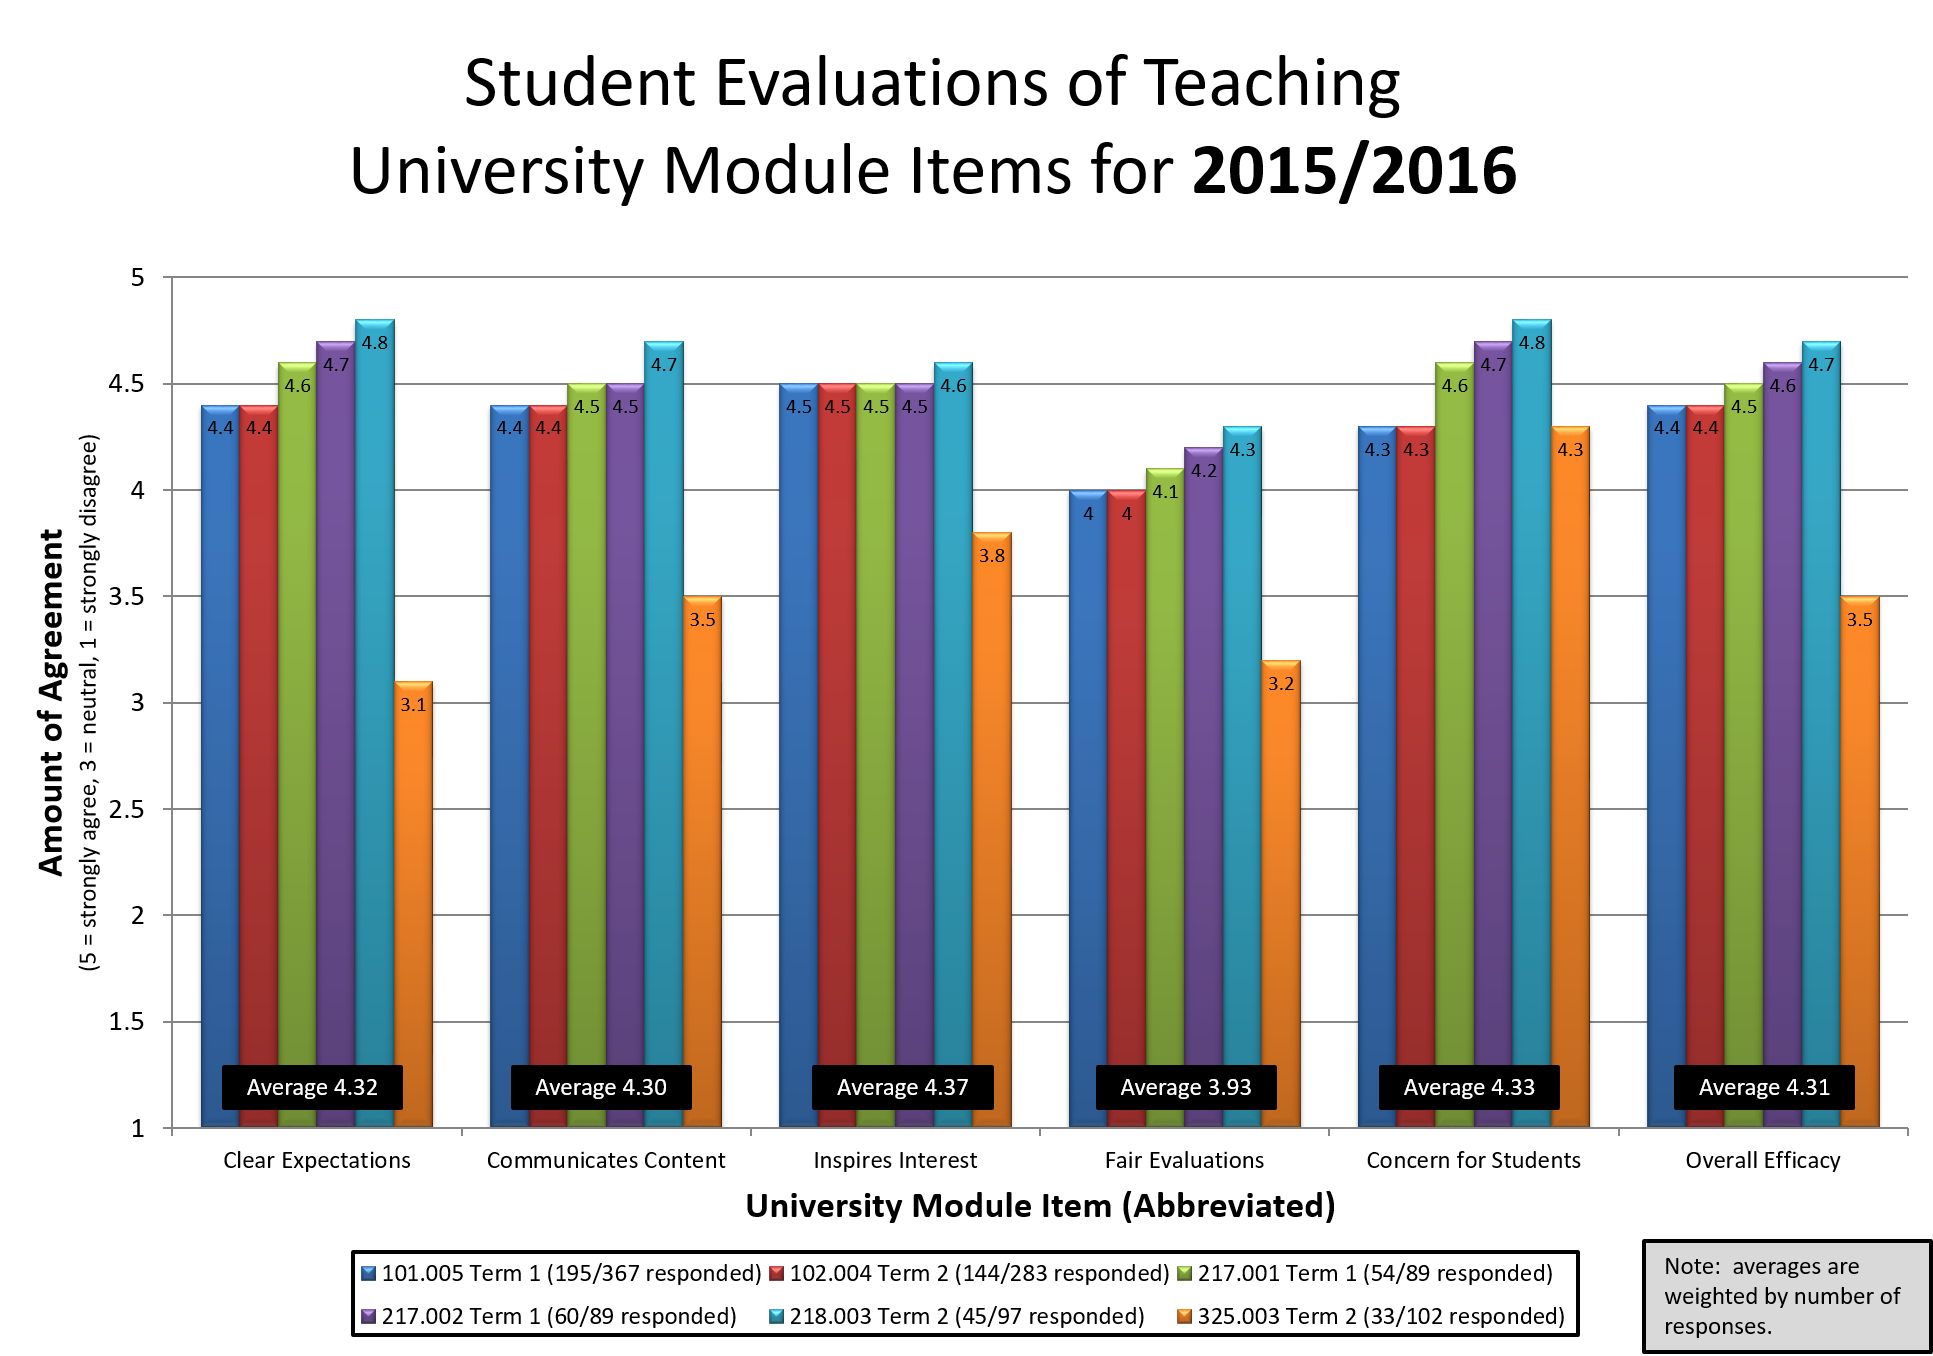
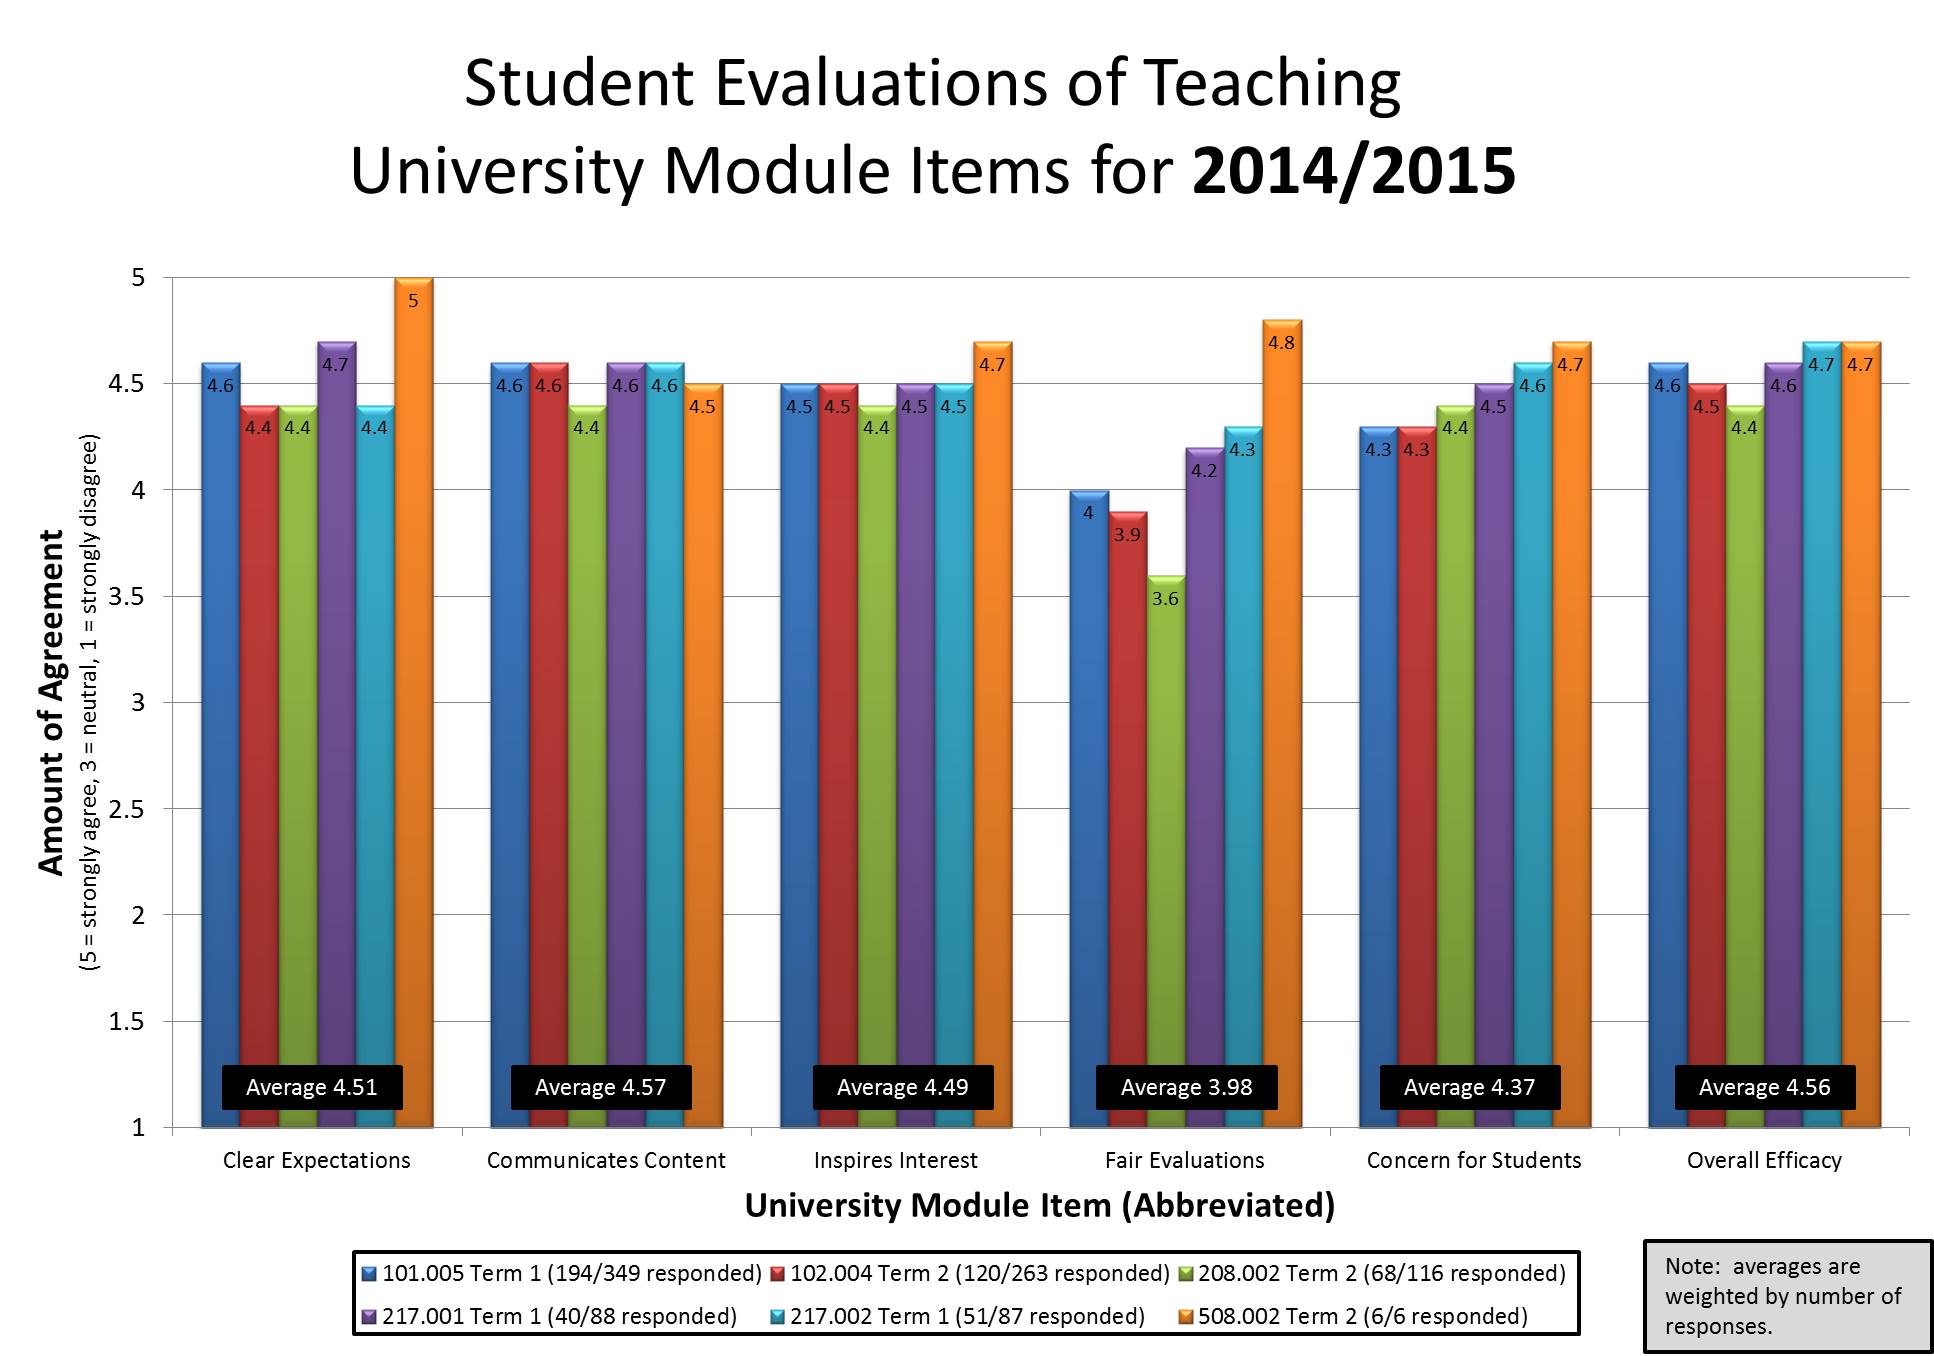
Introductory Psychology (PSYC 100 or PSYC 101 and 102, W2009 to W2017: 8 sections of each half, 5124 students total across all variations)
I taught students in Introductory Psychology from 2009/10 until 2017/18. The content changes quite substantially from 101/term 1 (where the focus is on the biological side) to 102/term 2 (where the focus is on the social side). The average UMI scores I present next are from the last five years I taught that course, weighted by number of student responses, with 6 credit courses counting twice (1537 respondents, 51% response rate): 4.46 (Clear expectations), 4.52 (Communicates content effectively), 4.52 (Inspires interest), 4.04 (Fair evaluations), 4.41 (Concern for students), 4.52 (Overall efficacy). Overall, students report being pleased with the way these courses are going. The qualitative data is mostly very positive. Check for blog posts containing my reflections on the numbers and qualitative comments: here for 2015/2016, here for 2014/2015, here for 2013/2014, here for 2012/2013, and here for 2011/2012. Please click on the graph below to enlarge it.
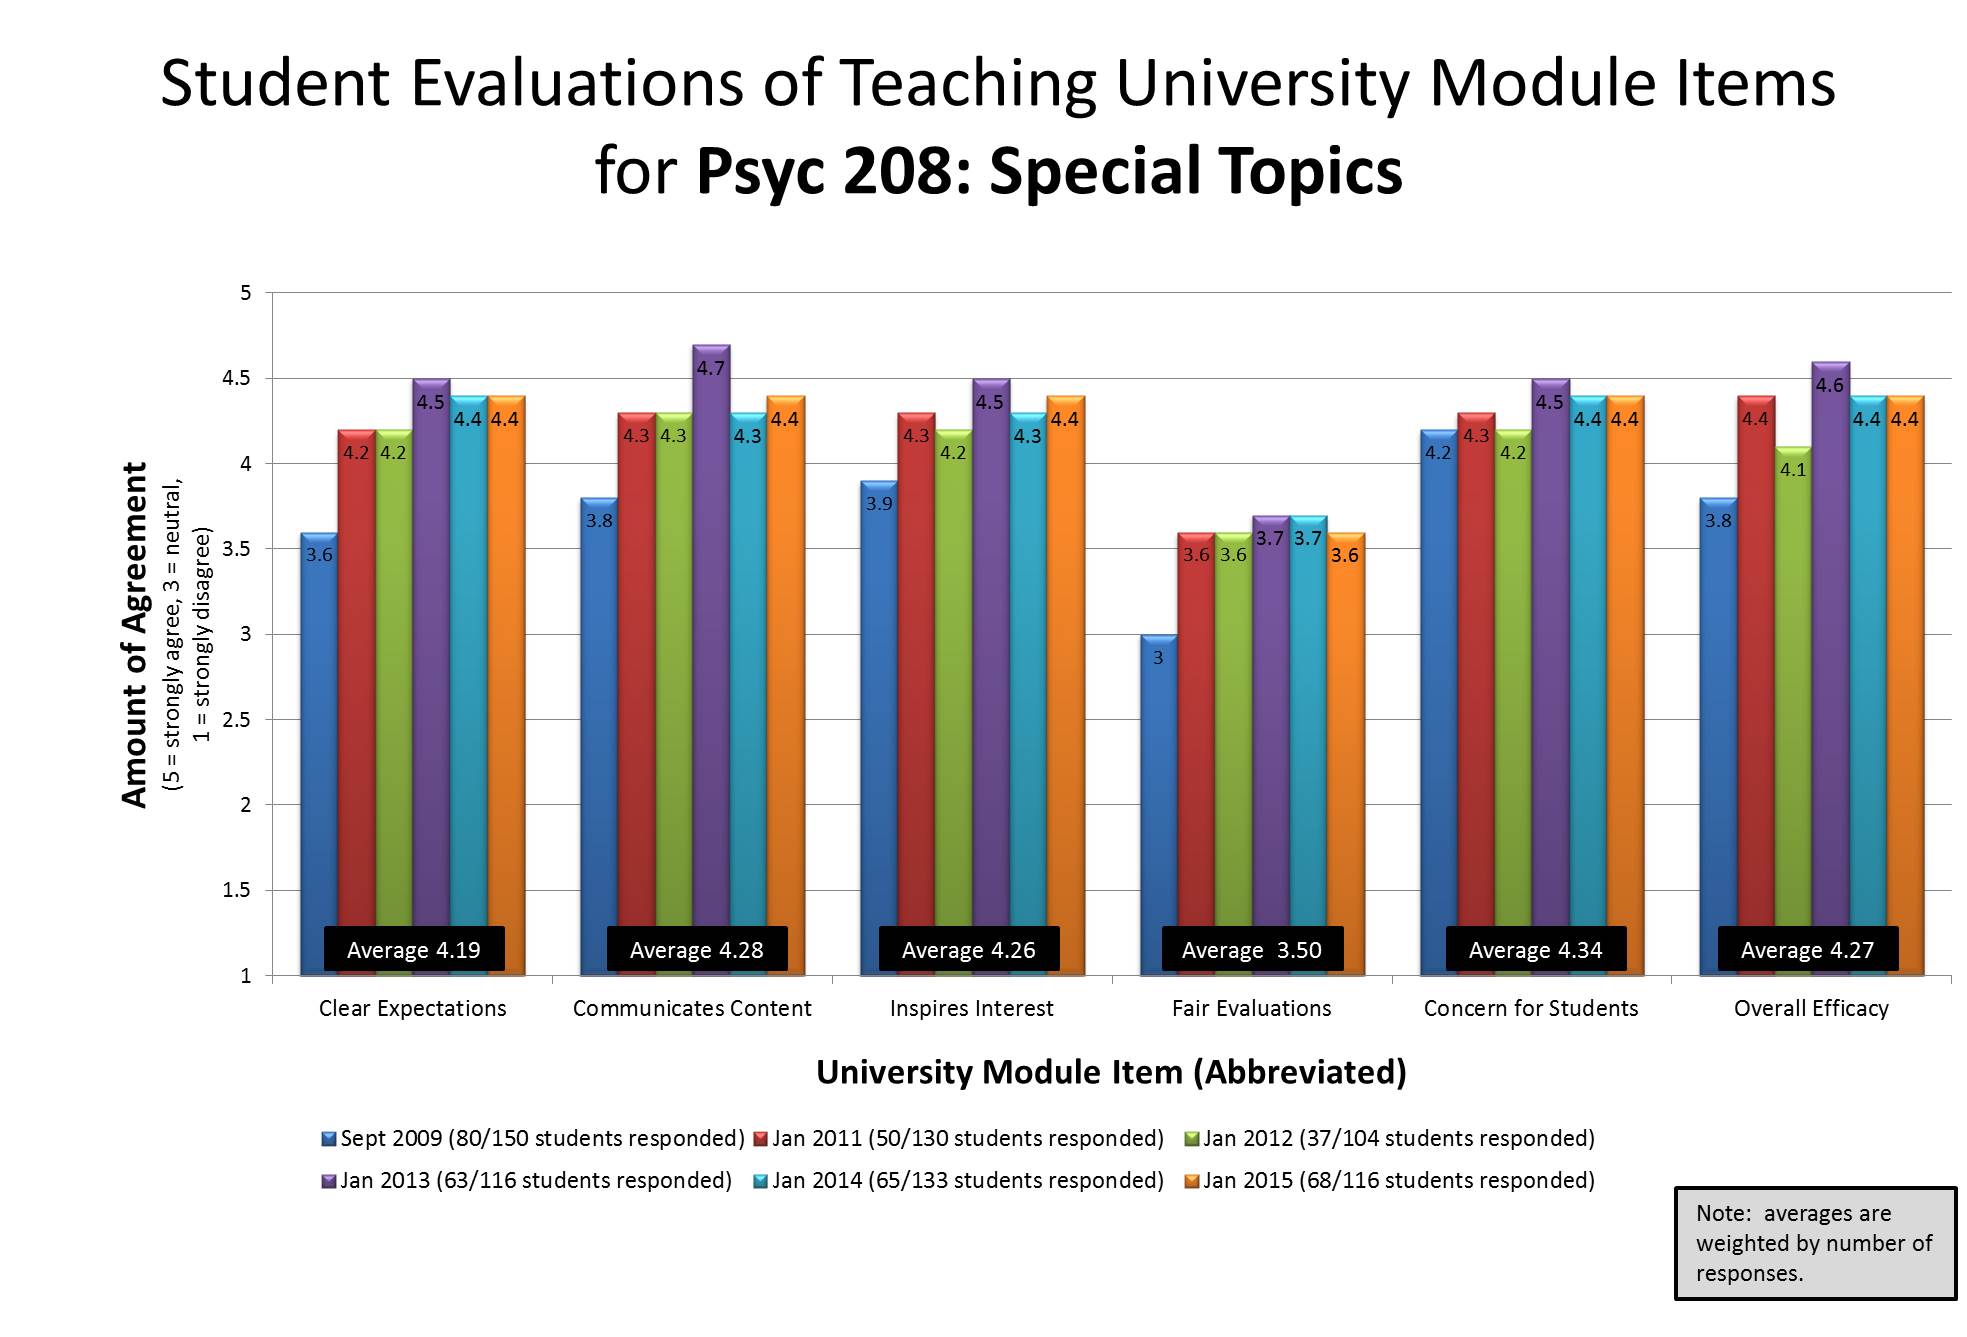
Psyc 208: Special Topics (6 sections from 2009-2015)
In the graph you can compare the scores I received from students for this course since fall 2009. I took a huge risk developing this course in the first place. I had open reign, and chose to design a course with student learning in mind. I titled the course: “Psychology in your life: How social psychology can help you succeed” (see the syllabus on the “courses” page). Based on feedback from the first iteration, I made substantial changes in 2010/2011. I am pleased to report these changes were reflected in greatly improved student ratings, which were repeated in 2011/2012 and jumped slightly higher in 2012/2013. In 2013/2014, ratings decreased a bit, coinciding with another fairly major renovation. On average, weighted by number of student responses (n=363, N=749, 48% response rate), my UMI scores are 4.19 (Clear expectations), 4.28 (Communicates content effectively), 4.26 (Inspires interest), 3.50 (Fair evaluations), 4.34 (Concern for students), 4.27 (Overall efficacy). Check out my blog post on the ratings and qualitative feedback here for 2013/2014, here for 2012/2013 and here for 2011/2012. Please click on the graph to enlarge it. Beginning in 2015-2016, I will no longer be teaching this course.
Overall, By Year of Full-Time Teaching (Please click on the graphs to enlarge.)
This graph shows the weighted average of all my courses separated by each year of teaching. In my first year of full-time teaching, 2009/2010, I struggled to keep up with my new workload, and that reality was reflected in how my students evaluated my teaching. Since then, my students have consistently rated my teaching fairly highly overall.


And here are student evaluation data from my six courses/sections 2009-2010. Please see my blog post highlighting some of my reflections on these numbers.
 Follow
2 responses to “Teaching Evaluations”