My challenging concept is the effect of the earth’s tilt on the causes of the seasons. This has been identified by Schneps (1988) in “The Private Universe” as a significant and persistent misconception within science education. Complex visualizations involving 3 dimension systems over time and changing points of view, such as is required in this case, are well documented as being particularly challenging for students of all ages (Barnett et al., 2005, Schneps et al., 2014).
In order to attack this problem through a t-Gem cycle, I have selected a Khan Academy simulation as my primary tool (https://www.khanacademy.org/computer-programming/path-of-the-sun/5075733592408064) . This simulation shows the celestial sphere and the path of the sun. Adjustable variables include the latitude of the observer, time of day, date, and tilt angle of the earth. This technology will afford students the ability to generate and examine data relevant to their latitude and the true tilt as well as provide several possibilities for extensions.
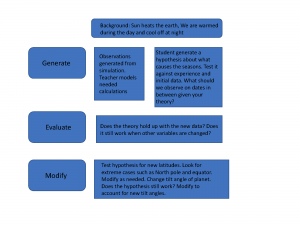
To generate hypotheses, students would first need some background knowledge in order to understand the variables. These would include the fact that the sun is the primary source of warmth on earth and that we are warmed during the day and cool at night. The following chart will guide students in their initial data collection
| Date | Day Length | Night Length | Peak Light intensity | Max height of sun above the horizon |
| June 21 | ||||
| September 22 | ||||
| December 21 | ||||
| March 20 | ||||
The students will fill in data for the provided dates first (solstice and equinox dates). From this data students would generate a hypothesis as to what causes the seasons. The will be prompted to evaluate the data and their hypothesis in light (pun most definitely intended) of their experience with these times of year as compared to their data. Do they agree? Next, students will select their own intermediary dates between those provided to check their hypothesis against further data and their own experience. Does the new data continue to represent the predicted trend? The students will then modify their hypothesis to fit and incongruous results this the help of the instructor. The cycle begins again when the students use their previously generated model to examine how this would translate to the north pole, equator, a moderate southern latitude, and the south pole. Students would then collect all their data to assemble a general theory of how latitude and time of year affect seasons on earth. The activity can be further extended into new cycle by changing the tilt angle in the simulation first slightly, the eliminating it altogether, and finally setting it to directly horizontal.
(You may need to use your browsers zoom function to view the graphic as it kept distorting when I tried to scale it)
My science 6’s will be looking at exactly this topic on Tuesday when we return from spring break. I’ll try to post back here and let you know how it goes.
References:
Barnett, M., Yamagata-Lynch, L., Keating, T., Barab, S. A., and Hay, K. E. (2005). Using virtual reality computer models to support student understanding of astronomical concepts. Journal of Computers in Mathematics and Science Teaching, 24(4):333-356.
Path of the Sun. Retrieved February 25, 2017, from https://www.khanacademy.org/computer-programming/path-of-the-sun/5075733592408064.
Schneps, M. H., Ruel, J., Sonnert, G., Dussault, M., Griffin, M., and Sadler, P. M. (2014). Conceptualizing astronomical scale: Virtual simulations on handheld tablet computers reverse misconceptions. Computers & Education, 70:269-280.
Pyramid Film & Video (1988). A private universe: An insightful lesson on howwe learn: Harvard-Smithsonian Center for Astrophysics.
Hi Daniel, Love it! Thanks for getting your post up early— it is a great exemplar for me to get my own ideas going in Physics 11/12. Cheers, Dana
Hi Daniel,
When I taught Science 9, I found my students had trouble with this issue as well. We usually completed a basic lab with miniature models of the Earth and ray boxes to demonstrate the reasons for the seasons. Unfortunately, this method does not really involve collection of data as it only gave students an approximation of events. I really liked the Khan Academy simulation and the ability for students to obtain data to confirm their hypothesis. Hopefully, I’ll get an opportunity to try it out one day!
Thanks for sharing,
Darren
I believe the use of physical models falls under our next topic, “embodied learning”, which I ran across in my TELE design project. I am curious how this theory treats physical vs. computer models and whether the have differnet affordances under it.
Hi Daniel,
The references to Schneps’ research on the Private Universe help to frame the challenge with learning about the seasons in a prior activity. Your T-GEM exercise helps to addresses this challenge. In the evaluation phase, it is noted that students are asked does the theory hold up and what happens when variables change? Can you imagine what students might say (eg. what their theory from the first phase might entail and which variables might they change)? Thank you for utilizing the flow chart and table to show your teaching sequence, Samia.
In terms of student responses, I fully anticipate that many of them will not see the changes on their own. I intend to ask probing questions to get them to uncover the dissonant information. Pointing out the perspectives of people on other hemispheres and lookign at diagrams of the earth in december but not at its furthest point fromt he sun are key strategies I intend to employ.