Monthly Archives: February 2017

T-GEM & Titrations

The Challenge:

Acid-base chemistry is a core section of Chemistry 11 and leads to the study of a variety of other chemical reactions. Typically, the concept of acid-base titrations is taught with traditional methods with teacher-based lectures followed by examination (Gonzalez-Gomez, Rodriquez, Canada-Canada, & Jeong, 2015). Additionally, ‘scripted’ laboratory classes can accentuate this method where students practice their observational skills and link between theory and practice. However, various misconceptions and student problems affect the ability of students to effectively learn the material. These misunderstandings can include a variety of topics such as the nature of acids and bases, and the recognition and use of acid-base chemistry (Cooper, Kouyoumdjian, & Underwood, 2016). From my own personal experience teaching acid-base titration, there is a disconnect between the laboratory work involving observations and technique and the calculations that accompany the laboratory work. Typically, students are able to complete titrations successfully in a laboratory setting and are able perform specific calculations in the classroom. However, they often struggle when the two concepts are joined or completed together. As proposed below, the use of T-GEM cycle might help alleviate some of these issues.

T-GEM Cycle:

Briefly, the T-GEM cycle involves three levels of instructional strategies (Khan, 2007):

  • Compiling information and generating a relationship
  • Evaluating the relationship
  • Modifying the relationship

The propose T-GEM cycle for the acid-base titration lessons would involve the teacher initially providing a minimal amount of background information. This would include introducing the concepts of acids, bases, and indicators.

The first level of T-GEM involves compiling information and generating a relationship. Students would be introduced to the first simulation (see below). This simulation allows students to manipulate the amount of NaOH in the Erlenmeyer flask and virtually perform a titration to the equivalence point. Students would be tasked with determining a general relationship between the concentration of base and acid as the titration proceeds.

Following the introductory simulation on titrations, students are then asked to revaluate the relationship using a second simulation (see below). This second simulation is more involved as it allows greater control and manipulation of variables (type of reaction, specific acids, specific bases, and verification of calculation). For example, students can be tasked with finding a more specific relationship between variables and perform calculations to verify results.

The final teacher strategy involves students modifying and summarizing their initial relationship based on their observations from the second simulation. Also, students would need to solve a new case. In my classes, I would then integrate the technical lab work for students to attempt and further confirm their hypothetical relationships.

The strategies are summarized below:


Digital Tech:

Simulation #1

http://glencoe.mheducation.com/olcweb/cgi/pluginpop.cgi?it=swf::800::600::/sites/dl/free/0023654666/117354/Titration_Nav.swf::Titration%20Simulation

Simulation #2

http://group.chem.iastate.edu/Greenbowe/sections/projectfolder/flashfiles/stoichiometry/acid_base.html

References:

Cooper, M., Kouyoumdjian, H., & Underwood, S. (2016). Investigating students’ reasoning about acid-base reactions. Journal of Chemical Education, 93(10), 1703-1712.

Gonzalez-Gomez, D., Rodriguez, D., Canada-Canada F., & Jeong, J. (2015) A comprehensive application to assist in acid-base titration self-learning: An approach for high school and undergraduate students. Journal of Chemical Education, 92(5), 855-863.

Khan, S. (2007). Model-based inquiries in chemistry. Science Education, 91(6), 877-905.


A million points of light

Thoughts on Chemland:

I spent quite a while investigating the units on Chemland (General Chemistry Interactive Simulations). I found being able to change variables, predict outcomes and then seeing the outcomes very helpful. If my prediction was wrong I could test and retest my theories to help me build a new understanding of the concept. Chemland was interesting but the curriculum is far beyond anything that is ever tackled in my grade 6-8 classroom.

Seeing the interactive simulations sent me on a quest. I wanted to see what other science and math concept simulations were available for my grade levels. I have to admit I totally nerded out and spent way too much time “playing” with these simulations. Although I investigated a few simulation sites the one I found to be the most comprehensive, interactive and helpful was the PhET Interactive Simulations created by the University of Boulder Colorado.

The website is https://phet.colorado.edu/en/simulations/category/new is free and registering provides you with access to lessons and other teacher add-ons.

Thoughts on GEM and T-GEM

GEM (Generate, Evaluate, Modify) and T-GEM (which includes technology) is a cyclical approach to science education. The image below explains how T-GEM can be used in the science classroom.

I feel a valuable component of the T-GEM approach is that students are not given explicit information about a science topic and asked to regurgitate these facts, rather students are expected to compile information, and generate a statement about how factors are related. Students are then expected to test their ideas and discuss their findings with others and the teacher. Students test and retest their ideas to see if they were correct. Students are also able to change the parameters of the tests to see what would happen in any given scenario. Being able to change the parameters helps students solidify concepts in a new way. Khan 2007 states that Inquiry is associated with an array of positive student outcomes, such as growth in conceptual understanding, increased understanding of the nature of science, and development of research skills (Benford & Lawson, 2001; Marx et al., 2004; Metz, 2004; Roth, 1993; Wallace, Tsoi, Calkin, & Darley, 2004) (p 877).

Khan 2012 quotes the science teacher in the case study:

A lot of the kinds of things we do with computer simulation could be done with pieces of paper. The thing that’s better about the computer part of it is, you can do a lot more exploring, so [the computer simulation] gives [students] more control over what they’re going to look at, as opposed to if I give them a sheet of paper with numbers on it. It’s like I’m going to look at this information, I’m going to come to some conclusion, I’m going to look at some more information, an I’m going to test those conclusions…So when I throw up an overhead, I’m doing the exploring and they [the students] are explaining it. And that’s ok, but when it’s a simulation and they are choosing things, then they are doing the exploring much more  (p 225-226).

This quote highlights how students can have control over their learning when using simulations and through the iterative process can dispel their own misconceptions about scientific concepts.

Challenging concept in your field: Light Snell’s Law, Reflection and Refraction

  • State how you know it is a challenge for students (eg. practice, student tests, and research on misconceptions).

One of the challenging science units I have taught is Light (including Snell’s Law, Reflection and Refraction).

I know that Light is a difficult unit for students because it involves both scientific and mathematical concepts. Students voice their difficulty with the concepts during lessons and experiments. Often traditional test scores have been quite low and finally, students are not able to talk about or demonstrate their understanding of the concepts with any degree of certainty.

Plan a 3-step T-GEM cycle for this challenging concept in your field. Use a visual to assist in showing the plan.

T-GEM Approach to a science unit on Light

Select an appropriate digital technology that may work for this concept.

Below is a link to the simulation I chose to accompany this unit. Just click the image.

http://

Bending Light

Click to Run

References:


Khan, S. (2007). Model-based inquiries in chemistryScience Education, 91(6), 877-905.

Khan, S. (2012). A Hidden GEM: A pedagogical approach to using technology to teach global warming. The Science Teacher, 79(8). This article was written about T-GEM with middle-schoolers.

https://phet.colorado.edu/en/simulation/legacy/bending-light

Technology, Learning for Use (LfU) and Supporting Students in Science

After reading and reflecting on the aims of LfU (Learning for Use) I believe there are a number of ways that LfU has the capability of supporting students who are experiencing conceptual challenges understanding Earth Science. The main goal of LfU experiences are to seamlessly integrate content and process activities so that students achieve robust and useful understandings that are deep and accessible (Edelson, 2001). In particular, technology supported inquiry learning provides an opportunity for these students to be supported throughout their learning. The Create-a-World Project which includes the use of the programs WorldWatcher and Progress Portfolio demonstrate a robust example of how technology can be used to support these learners. WorldWatcher provides a geographic visualization and data analysis engine whereas Progress Portfolio provides a place to record and monitor investigations and capture the ongoing work done in Worldwatcher.

The objective of the  Create-a-World Project is to have students investigate relationships between temperature and geography from a climatic perspective. Since this project is designed with the LfU model it follows certain protocols. Most importantly LFU focusses on the application of knowledge and through a knowledge application task LfU creates demand for learning and offers space for refinement as students apply knowledge they have learned (Edelson, 2001).  Reflection is also built into this process and a necessary part of the learning cycle. LfU is similar to the traditional learning cycle in which students are involved in an exploration or activities that help them understand a concept. This includes hands-on observations, measurement and gathering of evidence. Through this process, students begin to explore relationships and concepts and/or discuss findings and finally additional observations are discussed, noted and shared then applied and refined.

Examining a knowledge application task will illustrate the process and how technology can support the aims of LfU. In the introduction of the Create-a-World project students are inspired to begin to think about global temperature through guessing and colouring in the average temperatures in the world in July. This is to start the discussion about the concept and to promote communication. The LfU reasoning for this is to elicit curiosity and to have students confront limitations in their understandings (Edelson, 2001). It is noted in other literature that students are not likely to change their understandings in science until they notice contradictions to existing ones and that constructing relationships is a way to breach this divide (DeLaughter, Stein, Stein & Bain, 1998).

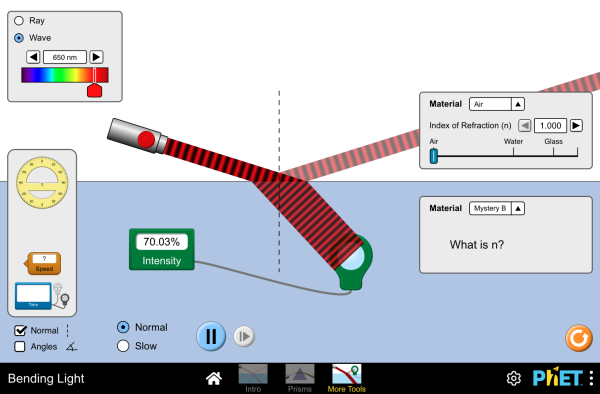
In step 2 students compare conjectures using WorldWatcher using real data. They use visualization and analysis tools to compare their own maps with actual July temperatures around the world. The LFU reasoning for this is that this allows students begin to observe patterns of temperature variation and to elicit curiosity in their causes (Edelson, 2001).

In fact, deeper more robust learning occurs when we encourage students to pursue a concept in a variety of contexts and examples until these new models are integrated. The students need to understand why they are pursuing the problem and this is best achieved  when students encounter information in the context of pursuing larger problems and  issues that they find intriguing (DeLaughter, et al., 1998)

In step 3 the students invent their own worlds using a paint interface and data sets. The LfU reasoning is to create a demand for student learning. Students must have an understanding of temperature to create this world.

In activity 4 students begin to explore the relationship between geography and temperature using WorldWatcher tools. The maps created are inputted into the Progress Portfolio program and they are able to annotate the relationships they see. Then they engage in group discussions in which they further refine their understandings. In this way they acquire additional knowledge construction.

In activity 5 the students begin to explain findings through discussions and have the opportunity for hands-on laboratory explorations of concepts thus explored. At this time the teacher can offer explanations or address misconceptions.

Finally, in activity 6 the students create temperature maps for their created worlds based on all the factors they have studied. They also document the rules they are using while creating these maps and record these in their progress portfolio. Then they present to their classmates and explain their work and have an opportunity to discuss the reasoning behind their choices.

So after outlining this example, here are the ways that I believe that LfU has the capability of supporting students who are experiencing conceptual challenges understanding Earth Science. Firstly, LfU design creates demand for learning and eliciting curiosity. In the Create-a-World project the students are required to create a fictitious world, and this would be the impetus for learning about temperature and climate. The technology used in WorldWatcher allows them to paint data and manipulate data for this purpose. So technology is supporting this type of learning.

In addition, eliciting curiosity through identifying potential misconceptions and for activating existing knowledge is achieved with technology. Technology provides simulations which may be unavailable to direct observation (Edelson, 2001). Technology may also provide ways to articulate and demonstrate concepts using, for example, drawing programs.   Eliciting curiosity may not happen with traditional style lecture or through textbooks which often tend to be outdated or misrepresent scientific concepts.

As students continue to discover more about scientific concepts and delve deeper with their understandings, technology can assist with data collection and analysis, modeling, and prediction which may be hampered without these technology tools due to time constraints, lack of resources or complex data management capabilities.

The computer is also used as a communication tool which provides the ability to present information in a wide variety of formats, which may not be possible in traditional presentations. This not only allows for differentiation but also allows for students choice, both aims of educational reform.

Finally, technology provides a place for reflection. It supports record-keeping during inquiry and also provides for the possibility of ongoing discussion threads for communication as well as presentation tools. In addition, investigation tools are provided through visualization and analysis capabilities, artifact construction, expressive and record keeping data collection and tools such as annotation as well as drawing capabilities.

I look forward to your reflections.


DeLaughter, J. E., Stein, S., Stein, C. A., & Bain, K. R. (1998). Preconceptions abound among students in an introductory earth science course. EOS Transactions, 79 (36), 429-436.

Edelson, (2001). Learning for use: A framework for the design of technology-supported inquiry activities. Journal of Research in Science Teaching. 38 (3), 355-385.

T-GEM and Chemland Readings

Hi Everyone,
If you are having difficulty finding the readings for module B lesson 4 (when you click on the links takes you to the site to pay for the reading) I managed to get them all by cutting and pasting the titles into the UBC library search (once you have logged in using the CWL) and all are available there. That was the only way I could find them in their entirety.
Catherine

Developing Spatial Literacy using Google Earth

I really enjoyed exploring GIS platforms this week and exploring ways they could be integrated into the classroom.

If I were to develop something to use in my grade 3 classroom I think that I would utilize Google Earth. My reasons for doing so would be that this is a mainstream platform that is user-friendly and easy to access from home as well. While I do see the importance and relevance of using platforms developed specifically for educational practices, I also see the necessity to show students mainstream tools that they can easily use on their own time and access from home (Bodzin, Anastasio, & Kulo, 2014).

Curriculum connections using maps are endless. With the push towards integrating more place-based learning and environmental education, the ability to easily access all different kinds of maps of our local areas is exciting. In grade 3 in particular, these maps could be utilized to investigate biodiversity and the local habitats of our plants and animals; how wind, water, and ice change the shape of the land; as well as measurement and construction of 3D objects, to name a few specific outcomes.

If I were to choose one activity to develop I might focus on using these maps for measurement and geometry. I liked the Google Earth activity of adding paths and polygons and how it could relate to our “Frolicking Friday” adventures. Every Friday we take our learning outside to our local area. Often this is in the form of treks down in the gully beside our school, and walks to our neighbourhood gardens and parks for various activities connecting to the science, socials studies, language arts, arts education, physical and health education, and math curriculum, thus beginning to foster spatial thinking by guiding these outings to be cross-curricular (Perkins, Hazelton, Erickson, & Allan, 2010). When I searched maps of our local area (Kimberley, BC) there were not many landmarks noted on our small town. It would be a worthwhile activity, then, for students to use these maps and add landmarks important to them and then measure distances using the measurement tools to begin to form an understanding of how long these distances take when we are walking them during our Frolicking Friday time. This activity would meet the four principles of the LfU model of construction and modification of knowledge structures (actual distance between local landmarks such as school and community garden), conscious and unconscious understanding of goals (calculating how long it would take to go to a local landmark and if we would have time to walk there during Frolicking Friday), the circumstances of knowledge construction (using the local environment that students experience daily is relevant to their construction of knowledge), and constructing knowledge in a support form (using maps found in Google Earth of the local area and then applying it during our outings) (Edelson, 2001). It would follow the foundation of the LfU principles that “understanding must be developed incrementally through the stepwise elaboration of knowledge structures” (p. 357) as well as the motivation understanding that “the motivation to acquire specific skills or knowledge within a setting in which the student is already reasonably engaged” (p. 358). Using “well-defined, guided investigation activities” and “interweaving…investigations and discussions” (p. 362) through our class blog and student digital portfolios, this activity could also lead to the creation of new motivation for learning.


Bodzin, A. M., Anastasio, D., & Kulo, V. (2014). Designing Google Earth activities for learning Earth and environmental science. In Teaching science and investigating environmental issues with geospatial technology (pp. 213-232).

Edelson, D.C. (2001). Learning-for-use: A framework for the design of technology-supported inquiry activities. Journal of Research in Science Teaching,38(3), 355-385.

Perkins, N., Hazelton, E., Erickson, J., & Allan, W. (2010). Place-based education and geographic information systems: Enhancing the spatial awareness of middle school students in Maine. Journal of Geography, 109(5), 213-218.

T-Gem and the Seasons: Investigating the effect of axial tilt on the seasons

My challenging concept is the effect of the earth’s tilt on the causes of the seasons. This has been identified by Schneps (1988) in “The Private Universe” as a significant and persistent misconception within science education. Complex visualizations involving 3 dimension systems over time and changing points of view, such as is required in this case, are well documented as being particularly challenging for students of all ages (Barnett et al., 2005, Schneps et al., 2014).


In order to attack this problem through a t-Gem cycle, I have selected a Khan Academy simulation as my primary tool (https://www.khanacademy.org/computer-programming/path-of-the-sun/5075733592408064) . This simulation shows the celestial sphere and the path of the sun. Adjustable variables include the latitude of the observer, time of day, date, and tilt angle of the earth. This technology will afford students the ability to generate and examine data relevant to their latitude and the true tilt as well as provide several possibilities for extensions.


To generate hypotheses, students would first need some background knowledge in order to understand the variables. These would include the fact that the sun is the primary source of warmth on earth and that we are warmed during the day and cool at night. The following chart will guide students in their initial data collection


Date Day Length Night Length Peak Light intensity Max height of sun above the horizon
June 21
September 22
December 21
March 20

The students will fill in data for the provided dates first (solstice and equinox dates). From this data students would generate a hypothesis as to what causes the seasons. The will be prompted to evaluate the data and their hypothesis in light (pun most definitely intended) of their experience with these times of year as compared to their data. Do they agree? Next, students will select their own intermediary dates between those provided to check their hypothesis against further data and their own experience. Does the new data continue to represent the predicted trend? The students will then modify their hypothesis to fit and incongruous results this the help of the instructor. The cycle begins again when the students use their previously generated model to examine how this would translate to the north pole, equator, a moderate southern latitude, and the south pole. Students would then collect all their data to assemble a general theory of how latitude and time of year affect seasons on earth. The activity can be further extended into new cycle by changing the tilt angle in the simulation first slightly, the eliminating it altogether, and finally setting it to directly horizontal.


(You may need to use your browsers zoom function to view the graphic as it kept distorting when I tried to scale it)


My science 6’s will be looking at exactly this topic on Tuesday when we return from spring break. I’ll try to post back here and let you know how it goes.

References:

Barnett, M., Yamagata-Lynch, L., Keating, T., Barab, S. A., and Hay, K. E. (2005). Using virtual reality computer models to support student understanding of astronomical concepts. Journal of Computers in Mathematics and Science Teaching, 24(4):333-356.

Path of the Sun. Retrieved February 25, 2017, from https://www.khanacademy.org/computer-programming/path-of-the-sun/5075733592408064.

Schneps, M. H., Ruel, J., Sonnert, G., Dussault, M., Griffin, M., and Sadler, P. M. (2014). Conceptualizing astronomical scale: Virtual simulations on handheld tablet computers reverse misconceptions. Computers & Education, 70:269-280.

Pyramid Film & Video (1988). A private universe: An insightful lesson on howwe learn: Harvard-Smithsonian Center for Astrophysics.

A Very Simple Way To Look At TELEs

I really like this statement from the overview,

Educational technology is a combination of the processes and tools involved in addressing educational needs and problems, with an emphasis on applying the most current tools, such as computers and their related technologies”

Because a pencil can be seen as technology because it address educational needs, although it is not the most current, it has stood the test of time.

I think that a designer of learning experiences should make the experience as engaging and useful as possible.  I think that it is important to include students in the process, it should allow for critical thinking, creativity, and collaboration.  Even though the technology aspect is important, designers must make sure that outcomes are covered and students are learning the information intended.  There must also be room for dialogue and communication


I would design a technology based learning experience that allows students to be more active participants in their own learning, allowing them to be content creators as well as content consumers.  I want my experience to be easy to use, fun and educational all at the same time.

Creating Spatial Awareness

It is important for teachers to find ways to LFU is a way for teachers to support learners by allowing them to situate their knowledge so that concepts will be easily accessible when they require it (Edelson, 2001). Using place based education has benefits beyond simply learning new software. Students need to be able to bridge the gap between the real and digital worlds (Perkins et al, 2010).  It is valuable to teach students how to use GIS when it comes to place-based learning because it gives them a tangible experience that they can relate to. It is important that students establish spatial awareness.  Perkins et al (2010) demonstrates that students are able to improve their understanding on spatial awareness and grasp geographical primitives using place specific exercises with GIS. Perkins et al (2010) further states that GIS can be used as an effective classroom tool to topics in areas such as ecology.


The Create-a-World project is an activity that I wish to explore a bit more in my own teaching practice. The goal of the Create-a-World project is to have the students formulate a hypothesis and collect and evaluate data as well as create visualization of that data using data analysis tools. As Edelson (2001) explains, Create-a-World  allows students to refine their inquiry skills and participate in guided investigation activites. As a result, students will be engaged in something meaningful to them that incorporates a wide variety of skills sets.


Fortunately, I had am quite familiar with GIS software, as I took a few courses in this area in my undergraduate degree. I used ArcGIS at the grade 7 level to map out ancient civilizations with my students as well as for making maps to visualize environmental issues. When I first took GIS and digital cartography courses, the software was not very user friendly, and it would take hours of trouble shooting to get the right projection that you were looking for.  There seems to be an explosion of GIS software now that is very intuitive and user friendly. Creating GIS maps is something that does not require a professional anymore.  Learners are able to experiment with GIS at a very young age and develop some very interesting maps.


Edelson, D.C. (2001). Learning-for-use: A framework for the design of technology-supported inquiry activities. Journal of Research in Science Teaching,38(3), 355-385


Perkins, N., Hazelton, E., Erickson, J., & Allan, W. (2010). Place-based education and geographic information systems: Enhancing the spatial awareness of middle school students in Maine. Journal of Geography, 109(5), 213-218.

Finding One’s Place Through Inquiry

Edelson’s (2001) writing on the framework of Learning for Use (LfU) model requires the teacher and learner to situate inquiry-based learning within a context of technology use and relevant future use. LfU is designed with three processes of learning, each incorporating the use of technology and causing the student to recognize the “usefulness of the content beyond the learning environment” (p.373). These three processes are defined as motivation, construction and refinement.

Edelson goes into significant depth about the LfU design strategies and elements contained within the Create-a-World Project, as well as a reasoning description of the purpose for including technology into the LfU model. For each strategy supporting a learning process, Edelson states the purpose behind the technology. These purposes include: a way of affording constructive learning , “improv[ing] upon the real world for discrepant events [i.e.] phenomena that are too small or too large, too fast or too slow, too hot or too cold for direct observation can all be reproduced using recording or simulation technologies” (p.376),  offering students participation in “guided discovery by allowing them to conduct investigations with data … [and] by providing simulations of physical phenomena that students can directly interact with” (p.377). Furthermore, technology provides “[t]he ability to present information in a wide variety of formats …  [i.e.] text, graphics, audio, and interactive computational objects” (p.378) as well as support the act of record keeping during inquiries for student reflection. Edelson’s intentional use of technology within the LfU framework, offers a standard for designers when considering the inclusion of technology within a learning framework. Does the technology enhance knowledge construction by affording practical tools for inquiry? Edelson’s inclusion of technology is extended in necessitating use and application: “Because knowledge application requires meaningful, goal-directed tasks, the technologies that can support knowledge application are the technologies that will allow learners to conduct meaningful tasks” (p.380).

Within both Edelson’s example of students using Create-a-World Project and Perkins, Hazelton, Erickson and Allen’s (2010)  study on students using a GIS (Geographic Information Systems), there is a connection to what David Sobel (2004) refers to as place-based learning. Sobel describes place-based education as “the process of using the local community and environment as a starting point to teach concepts … emphasizing hands-on, real-world learning, enhanc[ing] students’ appreciation for the natural world, and creat[ing] a heightened commitment to serving as active, contributing citizens” (Sobel, 2004).

The connection between LfU and place-based learning is worth consideration as GIS tools afford the opportunity for students to interact initially within their community and then beyond. Interestingly, the practice of place-based learning is promoted within the BC Ministry’s curriculum in relation to indigenous learning. Combining place-based learning with GIS tools offers opportunity for indigenous and western learners to gain a deeper understanding of their local world, and intuitively of the world beyond them. Inquiries related to physical environmental changes, population increase or decline of species, migration patterns and weather patterns are all relevant areas of situated learning for both indigenous and western learners.

In Perkins’ et al (2010) study, there is support for the inclusion of place-based learning with GIS tools as middle school students participate in mapping their school yard using My World GIS curriculum. Perkins et al (2010) find a significant increase in students’ spatial skills after only three days of working with the GIS and GPS tools. They partially attribute this increase in skills to the inclusion of place-based learning: “Introducing GIS and GPS in the students’ familiar and immediate surroundings more easily bridges the gap between the real and digital worlds. Each student has tangible experience with their schoolyard and, therefore, some sense of that space that will allow them to construct new knowledge in the context of a place that they know”(p.217).

In closing, the LfU model requires highly structured inquiry-based processes such as “hypothesizing, collecting and evaluating evidence, and defending conclusions based on evidence” (Edelson, 2001, p. 362). Furtak (2006) describes guided scientific inquiry as inquiry when the teacher knows the answer, but is cautious with the power of suggestion. In Linn, Clarke and Slotta’s (2003) article on WISE, a more structured approach to inquiry is also suggested: “If inquiry steps are too precise, resembling a recipe, then students will fail to engage in inquiry. If steps are too broad, then students will flounder and become distracted. Finding the right level of detail requires trial and refinement and, in some cases, customization to local conditions and knowledge” (p.522). Through the explorations of various technology-based inquiry environments, it is evident that the teacher and/or designer is an expert in processes and in content, allowing for processes of inquiry to be experienced and developed, while supporting inquiry problem-solving and refinements through in-depth knowledge of content.


Aboriginal Education, (n.d.). https://curriculum.gov.bc.ca/sites/curriculum.gov.bc.ca/files/pdf/aboriginal_education_bc.pdf
Edelson, D.C. (2001). Learning-for-use: A framework for the design of technology-supported inquiry activities. Journal of Research in Science Teaching,38(3), 355-385.
Furtak, E. M. (2006), The problem with answers: An exploration of guided scientific inquiry teaching. Sci. Ed., 90: 453–467. doi:10.1002/sce.20130
Linn, M. C., Clark, D. and Slotta, J. D. (2003), WISE design for knowledge integration . Sci. Ed., 87: 517–538. doi:10.1002/sce.10086
Perkins, N., Hazelton, E., Erickson, J., & Allan, W. (2010). Place-based education and geographic information systems: Enhancing the spatial awareness of middle school students in Maine. Journal of Geography, 109(5), 213-218.
Sobel, D. (2004). Place-based education: Connecting classroom and community. Retrieved from https://www.antioch.edu/new-england/wp-content/uploads/sites/6/2017/02/pbexcerpt.pdf