Category Archives: C. Information Visualization

T-GEM, PhET, and Water Conductivity

Many concepts are difficult for students to understand without some form of visualization to aid the description. This week I have integrated T-GEM with a water conductivity PhET Simulation to create a lesson activity which can address misconceptions. A regular misconception that students have is that pure water conducts electricity. By the end of this lesson students should be able to communicate what makes water conductive.


Step 1: Introduction

-Students form groups of 2-3, each group will have a computer, paper, and writing utensil

-Review as a class:

1 – What is electricity? What is flowing?

2 – How do we make electricity?

3 – What is concentration (with respect to dissolved solids)?

4 – How could we make things more or less concentrated?


Step 2: Generate

Have students as a group generate ideas around the following key questions:

1 – Is water conductive?

2 – How does electricity move in water?

3 – Would dissolving solids in the water change its properties?

Each group will write their predictions down on a piece of paper.


 Step 3: Evaluate

Have groups use PhET Simulation “Sugar and Solutions” to investigate water conductivity.

Ask students to test if their predictions are correct.


 Step 4: Modify

Ask students to create a situation where their new knowledge of water conductivity could be useful.

(The use of Makey-Makeys can be used so students can make an apparatus which physically uses water conductivity to control a computer)


Step 5: Reflect

Have students revise their original ideas and together formulate the main points of water conductivity.


References

Friedrichsen, P. M., & Pallant, A. (2007). French fries, dialysis tubing & computer models: Teaching diffusion & osmosis through inquiry & modeling. The American Biology Teacher, 69(2), 22-27.

Khan, S. (2010). New Pedagogies on Teaching Science with Computer Simulations. J Sci Educ Technol, 20(3), 215–232. http://doi.org/10.1007/s10956-010-9247-2

Srinivasan, S., Perez, L. C., Palmer,R., Brooks,D., Wilson,K., & Fowler. D. (2006). Reality versus simulation. Journal of Science Education and Technology, 15 (2), 137-141. http://ezproxy.library.ubc.ca/login?url=http://dx.doi.org/10.1007/s10956-006-9007-5

T-GEM, Illuminations & Angles


Model-based learning is a theory that allows students to learn from building, critiquing and changing our ways of thinking on how the world works (Khan 2007).  One of the big ideas from BC’s grade 6 math curricula is: Properties of objects and shapes can be described, measured, and compared using volume, area, perimeter, and angles. I’ve decided to use a T-GEM model to support student inquiry while using an information visualization technology from a website called Illuminations. In particular, to examine the challenging concept of how the angles of shapes add up when manipulated. Triona and Klahr argued that computer simulations can be as productive a learning tool as hands-on equipment, given the same curriculum and educational setting (As cited in Finkelstein et al., 2005).

T-GEM Model for understanding how angles in shapes work:

Introduction: Students will be introduced to pictures of different environments: downtown of cities, houses, construction, buildings, cars et. What shapes do you see? Patterns? Can you determine the measurement of each angle? The sum of all angles within these shapes?

Generate: Using the following link below, students will choose a polygon and reshape it by dragging the vertices to different locations. The students will see that when the figure changes shape, the angle measures will automatically update. Are there any patterns? What relationships do you see with triangles, quadrilaterals, pentagons, hexagons? Does the sum of all angles change or remain the same when they are manipulated? They will record their observations down.

http://illuminations.nctm.org/Activity.aspx?id=3546

Evaluate: Find a formula that relates the number of sides (n) to the sum of the interior angle measures. Why are we learning this? Can you think of any real-world examples when you would need to know the different angles within shapes? On the applet, play the animated clip in the lower right corner. Is there a different result for different shapes? Compare your results with a different group. Did you find the same formula?

Modify: Can you now look at shapes and determine the sum of all angles? Are there instances where you are not sure? Do shapes must be a certain size?

Reflection: Students will revisit the simulations again and create their own shapes. They will test their peers by asking them questions such as, “What will happen to sum of all angles when I move vertices upward?” They will reflect on their findings by posting a response to a collaborative tool called Padlet.

Finkelstein, N. D., Adams, W. K., Keller, C. J., Kohl, P. B., Perkins, K. K., Podolefsky, N. S., … & LeMaster, R. (2005). When learning about the real world is better done virtually: A study of substituting computer simulations for laboratory equipment. Physical Review Special Topics-Physics Education Research1(1), 010103.

Khan, S. (2007). Model‐based inquiries in chemistry. Science Education91(6), 877-905.

T-GEM, PhET and Friction

Understanding the effects of friction on the motion of objects can be a difficult concept for some students to understand. To explore the topic further, I designed a blended lesson using the T-GEM model and a PhET simulation, along with two others. The de Jong and van Joolingen (1998) review of simulation use in discovery learning contexts cited the importance of structuring and supporting students’ work in ways to prevent difficulties (Stephens, 2014). The teacher will lead some aspects of the lesson but students will be active participants throughout. Small groups will record observations and responses on this collaborative document which will help guide and structure the experience.

https://retsdca-my.sharepoint.com/personal/dcowan_retsd_mb_ca/_layouts/15/guestaccess.aspx?docid=01843f29779f34b4f9e90e979ac60d047&authkey=ASVFUvZz6FPh6-Ls2CQzl-k&expiration=2018-02-06T14%3a17%3a00.000Z

Generate

Prior knowledge accounts for the largest amount of variance when predicting the likelihood of success with learning new material (Srinivasan, 2006). Therefore, it is essential to activate relevant prior knowledge. Students will discuss and analyze scenarios where friction is the cause of their observations. Two common ones at my school would be tobogganing on the hill and hitting a patch of grass or participating in Halloween gym and having to scooter over a long stretch of carpet. Students will also play a game emulator of Mario Kart (http://www.nintendoemulator.com/snes/781) and drive over different surfaces and use different characters to observe the impact that their characteristics have on the motion of the vehicles. Students will explore a simple BBC simulation (http://www.bbc.co.uk/schools/scienceclips/ages/8_9/friction.shtml) in which they can test the effects of different surfaces on the motion of a vehicle using the same applied force. Students will record observations on the recording sheet and generate ideas regarding the relationship between friction and motion.

Students will then engage with a more detailed PhET simulation at https://phet.colorado.edu/en/simulation/forces-and-motion-basics. They will freely engage with the simulation but also use information on the recording sheet to test specific scenarios to observe and compare the interaction of multiple variables in more detail.

Evaluate

Students will engage in a whole class lesson using the simulation. The teacher will highlight crucial concepts, spend time addressing conceptual difficulties, focus on key visual features of the simulation (frictional force), and promote students using key visual feature in their thinking (Stephens, 2015). Students will evaluate their generated ideas relative to their whole group experience.

Modify

Students will go back and use the simulations again. They will reread answers on the recording sheet as well. They will have the opportunity to revise and update their groups initial responses to reflect a new more comprehensive understanding.

Using a variety of objects, surfaces, and spring scales, students will create a real-life scenario that demonstrates the effect of friction on the movement of objects based on the simulations they used.

References

Srinivasan, S., Perez, L. C., Palmer, R., Brooks, D., Wilson, K., & Fowler, D. (2006). Reality versus simulation. Journal of Science Education and Technology. 15(2), 137-141.

Stephens, A. L. (08/2015). Computers and education: Use of physics simulations in whole class and small group settings: Comparative case studies Pergamon Press. doi:10.1016/j.compedu.2015.02.014

T-GEM, NetLogo and public health

This week, I found myself really intrigued by NetLogo, especially the model on AIDS. I wanted to use this in a lesson on public health using the T-GEM approach (Khan, 2010).

Target audience: medical students

Topic: Public health

Lesson:

Step 1 – Introduction
Students will work in groups of 3-4 during this lesson. I would introduce the lesson by giving them the following scenario:

“ The CDC has just announced that a new retrovirus has emerged. No treatments for this virus has been established. It acts similarly to HIV in that it is sexually transmitted and the use of condoms significantly decreases the risk of infection. Infected individuals are initially asymptomatic, but later develop an immune deficiency, just like AIDS. A test has been developed to detect this virus but infected individuals only test positive 3 months after infection. You are public health officials who have been tasked to identify the most effect method to keep infection rates as low as possible.”

Step 2 – Prediction/Generate
Based on their current level of knowledge, students will be asked to predict methods that will be effective in minimizing the infection rate. They will likely come up with a few ideas, but will be asked to narrow it down to just one (given our current budget issues), based on their group discussion. This will then be presented to the rest of the class

Step 3 – Evaluate
Students will then be asked to use the NetLogo AIDS model to run their prediction. They will then explore other variables (condom use, frequency of screening, etc) to see if changes to these variables cause the desired effect (decreased infection rate). Based on the data, students will start to understand the relationship between these variables and infection rate.

Step 4 – Modify/Reflection
Students will then be asked to go back and look at their original predictions, and modify it as they see fit. Students will reflect on their initial predictions and their modified predictions to address any misconceptions they had at the beginning of class.

Step 5 – Peer review
Groups will then present their finial recommendation as public health officials and receive feedback from the remainder of the class.

References

Khan, S. (2010). New Pedagogies on Teaching Science with Computer Simulations. J Sci Educ Technol, 20(3), 215–232. http://doi.org/10.1007/s10956-010-9247-2

Perimeter, Area & T-GEM

Determining the area of irregular and unusual shapes is one of the more challenging geometry based topics that elementary students encounter. For this information visualization lesson, I have decided to design a lesson around the T-GEM model, and the students will have the opportunity to work with applets from Illuminations and PhET to further explore these mathematical concepts. Simulations, such as these applets, help support students and provide the necessary level of novelty and interest that significantly impacts student approach to learning and processing (Srinivasan et al., 2006). This lesson allows students to build their own 2-D shapes, both regular and irregular, as well as unusual shapes that defy categorization. Working with these applets will help ensure that the students achieve visible results that they can observe and make/modify conclusions upon. According to Finkelstein et al. (2005) although these types of simulations do not necessarily promote conceptual learning, they are useful tools for enhancing student learning when properly designed and implemented.

  1. Generate
  • students will explore the following PhET simulation on Area using Area Builder – https://phet.colorado.edu/en/simulation/area-builder
  • students will examine the relationships between area and perimeter for a variety of regular and irregular shapes
  • What strategies can we use to find the area of a shape? How do these strategies differ for regular and irregular shapes?
  • Through observing perimeter and area within the simulation, can you create a rule that describes how perimeter and area change when the scale of a shape changes?


  1. Evaluate
  • based on their observations and findings using Area Builder, students will evaluate their work and identify further questions that they have, and areas that they would like to explore
  • students will collaborate with a peer and exchange findings from their work with Area Builder


  1. Modify
  • students will collaborate in small groups to discuss their findings and observations and share how their initial ideas and predictions have been changed through their interactions with the simulation
  • student groupings will create a list of ideas and strategies that they believe will help determine the area of regular, irregular, and unusual shapes


  1. Further Application
  • students will further apply their understanding of the concepts by using the Area Tool applet on the NCTM Illuminations website – https://illuminations.nctm.org/Activity.aspx?id=3567
  • students will attempt to utilize their strategies to determine the relationship between the perimeter and area of trapezoids, parallelograms, and various triangles


  1. Reflecting and Sharing
  • students will reflect on their findings using Area Tool and compare the processes and strategies that they utilized to determine the area of trapezoids, parallelograms, and various triangles
  • Were the findings consistent with the strategies applied previously, or did this require a reevaluation of these ideas?
  • student groups will decide how they would like to compile their observations and understandings to be shared with the whole class – Can these findings be compiled within a table or chart for sharing purposes?


References

Finkelstein, N.D., Perkins, K.K., Adams, W., Kohl, P., & Podolefsky, N. (2005). When learning about the real world is better done virtually: A study of substituting computer simulations for laboratory equipment. Physics Education Research,1(1), 1-8.

Srinivasan, S., Perez, L. C., Palmer, R., Brooks, D., Wilson, K., & Fowler, D. (2006). Reality versus simulation. Journal of Science Education and Technology. 15(2), 137-141.


Linear Equations anchored in the Man In Motion Tour

Of the four instructional frameworks we explored in module B, I chose to look at anchored instruction where students are required to generate sub-questions based on a broader question anchored in a real-world situation.

The school I teach at is named after Rick Hansen; a man who has raised many millions of dollars in the name of spinal cord research.  When referring to Rick Hansen, his Man In Motion tour often comes up as it was the worldwide launch of his attempt to create awareness around spinal cord injury.  My lesson will develop a driving question around Rick Hansen’s Man In Motion Tour and the curriculum requirements around Cartesian coordinates and linear equations.

Driving Question: How can we explain Rick Hansen’s Man In Motion Tour using math?

Step 1:

Students are given a chance to brainstorm what this question means to them.  There is no context to this problem other than the math we have already covered in the class thus far – linear equations have not been studied yet.  Once they have had a few minutes to brainstorm, they add their ideas to a shared Google Doc.  Students are aware of the requirements of online collaboration and the behavior and accountability that comes with that.  Discuss as a class.

Step 2:

Introduce to students the route data that has been acquired from the Rick Hansen School program (in spreadsheet form) of daily mileage traveled, dates traveled and each city that Rick stayed overnight.  This brings a new dynamic to the problem as students are now given some context.  Ask students to revisit their contributions from the previous step and update their position.

Step 3:

Take students outside to the soccer field where ‘treasure’ has been previously placed throughout the field.  In pairs, have students brainstorm effective ways draw a map for their peer to reach this treasure.  The aim is to have students begin to work with the x/y plane and Cartesian coordinates.  Guide students and ask probing questions as required.

Step 4:

Explore the concept of constant speed and how it can be illustrated by a linear equation.

As a class, explore the PhET simulation:

https://phet.colorado.edu/en/simulation/graphing-slope-intercept

And speak about how any point on that line (position) can be expressed with some value of x or y.  Allow students a chance to play around with the slope and y-intercept.  Provide a list of questions students need to answer to better familiarize themselves with the y=mx+b form.

Step 5:

Assign students a country (each country has about 10 stops) that Rick visited during his Man In Motion tour and task students with using linear equations to try and explain his position at any point during a given day.  They can assume that he was travelling for eight hours per day.

This should be enough information for them to find his average speed and come up with a linear equation for each day.  Students will find that some days were longer than others in regards to distance – ask them why they think this is the case?  They could look at elevation changes on certain days etc.


I would love feedback on potential pitfalls or areas of development you may see.

Baljeet

T-GEM and Buoyancy

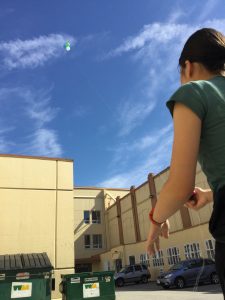
TLDR;  We designed and flew a helium balloon probe and studied the complex system of forces through PHeT simulations.  I’d conclude that age and stage of the students matters a lot, making the teaching of “real world” science to K-10 a unique challenge requiring more than good simulations.

***

This summer I ran a STEM program with a colleague.  One of our projects was to make a cheap, simple aerial probe using Helium balloons.  The ultimate goal was to send various probes to collect data at inaccessible heights in the area around the school.  Jacobsen and Wilensky (2009) describe a complex system as having many interacting parts that are interdependent.  With no fewer than five independent parameters, this certainly qualified!  Our first probe (by student preference) was a camera.  We ran the lesson in five parts, loosely following a T-GEM model of exploring and modifying a model.

Lesson 1:  What is buoyancy?

In groups, students defined buoyancy, and tried to describe the model by which it worked, using words and pictures.  Everyone agreed that buoyancy acts upward, but there was a split as to what causes the upward motion.  Competing theories included reduced gravity, air pushing up, and helium pushing up.  Given ten balloons each, groups had to measure and report how much buoyancy each balloon offered, in units of their own choosing.  Most went with things like “paperclips/balloon”.

Lesson 2:  Balloons and Buoyancy

We discussed standardized units and the SI system from the previous class.  Students were given access to the PHeT module “Balloons and Buoyancy” and asked to answer the question:  What parameters can you control to make the balloon have the most buoyancy?  This activity was difficult to use—the display had too many options for them, but they did eventually agree that a cold, external heavy species gas, and hot, light species balloon gas was the best combo.  As Stephens and Clement (2015) note, hands on the keyboard sometimes means mind elsewhere, and students often need heavy scaffolding to use these simulations effectively.  We tried “pairs programming” in which students work in pairs, which seemed to help.  Stephens and Clement (2015) also suggest that student generated questions can be very effective.

Lesson 3:  Actually Flying the Balloons

We determined how many balloons were required for our load, and flew a balloon camera.  It was awesome.  Students agreed that our model of how much lift we should get was less than expected.  Also, wind complicated our model.  We collected observational and height data.

Lesson 4:  Buoyancy as a Force

We agreed that based on observation, many things were pushing on the balloon at the same time.  We used PHeT a second time, with another buoyancy simulation.  This time, students were asked to name and describe the forces pushing on the blocks, and how to maximize the buoyancy.  They seemed unbothered by the fact that it was blocks in water, not balloons in air.  Everyone figured out to minimize the mass, and maximize the volume.  Nobody referred to this in terms of density.

Lesson 5:  Putting It All Together

In designing our second probe, students were asked to list all the parameters that the system depended upon, and how to optimize them.  This was compared to their Lesson 1 drawings and definitions, and they had a discussion about the difference.  Ultimately, they did embody that buoyancy is actually the combination of many forces.  They could show physically how to control buoyancy.  They could not, however, make the words come out.  It is hard to say if this is problematic.  Most of them identified buoyancy as the central controlling force that acted upward.  While true from an outside perspective, it lacks granularity or a casual link between buoyancy and forces with other origins.  On the positive side, most of them agreed that they had not considered that more than one force could be acting at the same time, which is perhaps the beginning of a “strong” or “radical” conceptual change (Jacobsen and Wilensky, 2009).  The second probe flew better, but had very wobbly footage because of the winds.

Q:  When is the best age/stage to engage in more complex systems?
Q:  If students are motivated by real phenomena, but studying that phenomena is complex, is there a high quality middle ground?

Friedrichsen, P. M., & Pallant, A. (2007). French fries, dialysis tubing & computer models: Teaching diffusion & osmosis through inquiry & modeling. The American Biology Teacher, 69(2), 22-27.
Jacobsen, M. & Wilinsky, U. (2006). Complex systems in education. Scientific and educational importance and implications for the learning sciences. Journal of the Learning Sciences, 15(1), 11-34.
Stephens, A. & Clement, J. (2015). Use of physics simulations in whole class and small group settings: Comparative case studies. Computers & Education, 86, 137-156.

Equivalent Fractions with Info-Vis

The concept of information-visualization allows for students to visualize and make sense of conceptual understandings that are not easy to grasp, either due to the minuscule size (of atoms, for example), or the lack of tangible familiarity, such as fractions being parts of a whole. Where children experience their three-dimensional world on a regular basis as a concrete experience, rather than a conceptualized environment, spatial reasoning, relationship-building with the physical world and information-visualization are key components to develop at a young age. Jones and Mooney point out that “physical experience, especially the physical manipulation of shapes, is important at all ages”, particularly through geometrical experiences to build “a firm understanding of geometrical relationships” (Jones, K., Mooney, C., 2003). Although computer simulations are not the be-all, end-all for learning about geometry and visualizing difficult concepts in the physical world, Finkelstein et al. highlight the many benefits of using computer software and applications to simulate geometric environments, “providing simulations are properly designed and applied to the appropriate contexts” (Finkelstein, N.D. et al., 2005).

In my own context, I have found that in the lower intermediate grades, students have difficulty grasping fractions. Physical models of fraction circles help them to understand that a quarter of a pizza is not comparable to half an apple, but when it comes to finding and comparing equivalent fractions, they need more opportunities to play around with the numbers that they see on the page and apply it to something tangible, more concrete in their minds. Therefore, the example below is of a lesson using the Learning for Use model, where students are introduced to equivalent fractions using a card game I’ve been teaching with for many years. However, I have enhanced the game to include Knowledge construction activities using Illuminations’ app for Equivalent Fractions. Students have plenty of opportunities to ‘play around’ with different fractions to improve their visualizations of what equivalent fractions mean.


Understanding Equivalent Fractions

Goal: Students will be able to visually represent equivalent fractions.

Materials:

Lesson based on LfU model:

Motivate:

  • Students are introduced to the game ‘Fraction Wars’, a card game where students flip over two cards (A=1, to 10), placing them one above the other to create a fraction. Whoever has the higher fraction collects all the cards. Students may also experience a draw, known as ‘war’. This applies to equivalent fractions. When ‘war’ is declared, students flip another two cards, until there is a winner who collects all the cards. The student with the most cards at the end wins.
  • To properly identify a ‘war’ situation, students need to be able to understand, identify and compare equivalent fractions. Students will play a class-vs-teacher round until war is declared.


Knowledge construction:

  • In the event of a war, students must illustrate, using drawings or objects, how the fractions are equivalent, bigger or smaller.
  • Students will share their explanations in table groups. When the group has a consensus, they will place their hands on their heads. Allow 5-10 minutes if a group has not yet reached consensus.
  • Hand out laptops and have students go to the Illuminations site – Equivalent Fractions app.
  • Students work to identify equivalent fractions of the computer-given fraction, using Illuminations.
  • Students build their own equivalent fractions to build understanding, using Illuminations.
  • Students compare different fractions and discuss with each other which fractions are deemed larger or smaller. What is their proof?
  • Students may recreate physical or drawn models to further illustrate their proof of equivalent, larger or smaller fractions.


Knowledge Refinement:

  • Students return to teacher example and share consensus, using their model as proof.
  • Students play Fraction Wars against each other, regulating the game based on their refined understandings of fractions, with models or Illuminations to help in their visualizations.


References:

Finkelstein, N.D., Perkins, K.K., Adams, W., Kohl, P., & Podolefsky, N. (2005). When learning about the real world is better done virtually: A study of substituting computer simulations for laboratory equipment. Physics Education Research,1(1), 1-8.

Jones, K. and Mooney, C. (2003). Making Space for Geometry in Primary Mathematics. In: I. Thompson (Ed), Enhancing Primary Mathematics Teaching. London: Open University Press. pp 3-15.


Equivalent Fractions & T-Gem

According to Finklestein et al. (2005) students who use computer visualization simulations are better able to understand concepts and knowledge regarding a particular subject matter. One area that students have demonstrated consistent difficulty in has been the understanding of equivalent fractions in math. Through the use of Illuminations visual simulation, students can begin to explore this concept as an extension of hands-on activities done in class. As Clements (2014) notes, within the field of mathematics there are many different definitions to describe visualization. Zimmermann and Cunningham (1991) describe visualization as, “we take the term visualization to describe the process of producing or using geometrical or graphical representations of mathematical concepts, principles or problems, whether hand drawn or computer generated.” Therefore to aid in the understanding of equivalent fractions I have used the T-Gem model along with Illuminations.
Materials:

Math learning log
Computer to log onto site
iPad to document reflection (App-pic collage)

Step One (Independent reflection)
Generate

To begin the lesson, have students record their definition of what an equivalent fraction is (IB Key concept of form) and what the function of an equivalent fraction is (IB Key concept of function*) into their learning log. Have students write or draw pictures of times they may have used equivalent fractions in their day to day life. Students essentially are completing a KWL of what they intend to learn about equivalent fractions before exploring the web-based site.

*Within the IB Curriculum framework, students in the PYP explore the central idea of the unit (similar to BC’s Big Idea) from one of the 8 key concepts. Through the use of the key concepts often used in science and social studies curriculum, students continue to learn about the key concepts in math class, and reinforce the connect to the big ideas.

Possible extension is to have students share their KWL in small groups of 2-3. Providing opportunities for students to express confidence and misconception with their peers is important part of the scaffolding process, so that all learners feel confident and willing to take risks in their inquiry process.

**Students can take pictures of their written work to include in the reflection piece where we use Pic Collage to create an image consolidating their thinking and learning.

Step 2- Evaluate

Students log onto the Illuminations site

Working independently at first they begin to explore the different options, either choosing the automated option or creating a fraction of their choice.

Afterwards, have students work together in pairs to choose their own fraction. One student chooses and the other attempts to find equivalent fractions. Part of the process should be verbal discussion explaining their decision making. The student who chose the fraction should record the other students thinking in their learning log. This can be used as part of the reflection piece as well as class discussion. Switch so that both partners have a chance to visit site and record thinking and learning.

During this time, teacher circulates around to groups to discuss the form, function, accuracy and misconceptions. Provide timely and meaningful feedback for students to attend to their understanding.

Step 3 Modify

Students then return to their seats to work on completing an equivalent fraction of their choice. Students take a picture of their computer simulation to include in their reflection piece.

Step 4 Reflection

Students return to their KWL in their learning log to amend any ideas thoughts in a different colour pen. They then begin working on their pic collage to include all elements of the learning engagement (KWL, partner notes, etc.) Teacher circulates to read the changes in student thinking, taking note for next lesson’s hook.

Step 5-Exit Ticket

Students share their Pic Collage with the teacher, allowing the teacher to look over their work and revisit any misconceptions for the next class. The reflection piece will be included in their student portfolios.

References

Clements, M. K. A. (2014). Fifty years of thinking about visualization and visualizing in mathematics education: A historical overview. In Mathematics & Mathematics Education: Searching for Common Ground (pp. 177-192). Springer Netherlands.

Finkelstein, N.D., Perkins, K.K., Adams, W., Kohl, P., & Podolefsky, N. (2005). When learning about the real world is better done virtually: A study of substituting computer simulations for laboratory equipment. Physics Education Research,1(1), 1-8. Retrieved April 02, 2012.

Khan, S. (2010). New pedagogies for teaching with computer simulations. Journal of Science Education and Technology, 20(3), 215-232. Khan, S. (2012). A Hidden GEM: A pedagogical approach to using technology to teach global warming. The Science Teacher, 79(8). This article was written about T-GEM with middle-schoolers.
T-GEM and Computer Simulation

A common misconception that students form when presented with the process of photosynthesis, is to think that plants obtain their energy from the soil through the roots instead of producing organic compounds through the process of photosynthesis. Several misconception studies revealed that elementary students tend to believe food comes from outside an organism. This may be common to animals but plants produce starches and sugars through the chemical process of photosynthesis. Often students form this type of misconception because they tend to imbue plants with human characteristics.

The following 5-step T-GEM activities prompt students to generate ideas about plant needs, share those ideas, go through a photosynthesis simulation, and then revisit their ideas in light of new knowledge obtained via the simulation, and then work in groups to create diagrams based on the re-evaluated relationship between what plants need to grow and survive and how plants manufacture food.

  1. Use the following questions to generate ideas:
    • What do plants need to grow and survive?
    • Why do you think those needs are important for plants to grow and survive?
    • How do you think plants obtain nutrients?
  2. After the activity, have students come up with answers and compile those answers in a Google Doc to share with the rest of the class.
  3. Exploring the computer simulation – https://authoring.concord.org/activities/1008/single_page/4d989d7d-36c2-4ec4-9213-21bccc90b705
  4. Ask students to revisit their predictions in light of new information obtained during the photosynthesis simulation and to modify their predictions generated in step 1. Students can then reflect these prediction modifications in the Google Doc.
  5. Two parts:
    • Through group work, students re-evaluate the relationship between what plants need to grow and survive and how plants manufacture food
    • Following that students create a photosynthesis diagram with the help drawing software, like Cacoo, and share the diagram with the group.

Linn et al. (2004) have demonstrated that using the computer as a learning partner supports students’ mastery of concepts and ability to integrate knowledge. Computer simulations provide authentic learning experiences where students are afforded immediate feedback enabling them to refine and mature their evolving ideas, and take ownership of their learning (Lee et al., 2010). They promote active engagement in higher order thinking, and help students learn abstract concepts (Hargrave & Kenton, 2000).


References:

Hargrave, C. P., & Kenton, J. M. (2000). Preinstructional simulations: Implications for science classroom teaching. Journal of Computers in Mathematics and Science Teaching, 19(1), 47-58.

Khan, Samia (2011).  New pedagogies on teaching science with computer simulations. Journal of Science Education and Technology 20, 3 pp. 215-232.

Lee, H. S., Linn, M. C., Varma, K., & Liu, O. L. (2010). How do technology‐enhanced inquiry science units impact classroom learning? Journal of Research in Science Teaching, 47(1), 71-90.

Linn, M. C., Eylon, B. S., & Davis, E. A. (2004). The knowledge integration perspective on learning. Internet environments for science education, 29-46.