Category Archives: C. Information Visualization

Using NetLogo for the States of Matter

Elementary Science

Topic: Chemistry – Gas

Misconception: Gases are not matter because most are invisible

Gas can be a difficult concept for children since those commonly experienced, like air, are invisible. Stavy (1988) suggests this invisibility prevents children from forming a concept of gas spontaneously. She explains that instruction is important for children to acquire knowledge about gas properties. Using a T-GEM Model and NetLogo, students will work through a variety of experiments to construct a solid understanding of the states of matter, specifically gas.

Materials:

iPad Book Creator App – to document KWL (Know, Wonder, Learn) about Gas knowledge

Computer – to access NetLogo (Students will use NetLogo to simulate and visualize the molecules inside a bicycle tire as it is being pumped up with air). Lesson can be found here: http://ccl.northwestern.edu/classroomresources/connectedchem/CC_GasLawsStudent.pdf
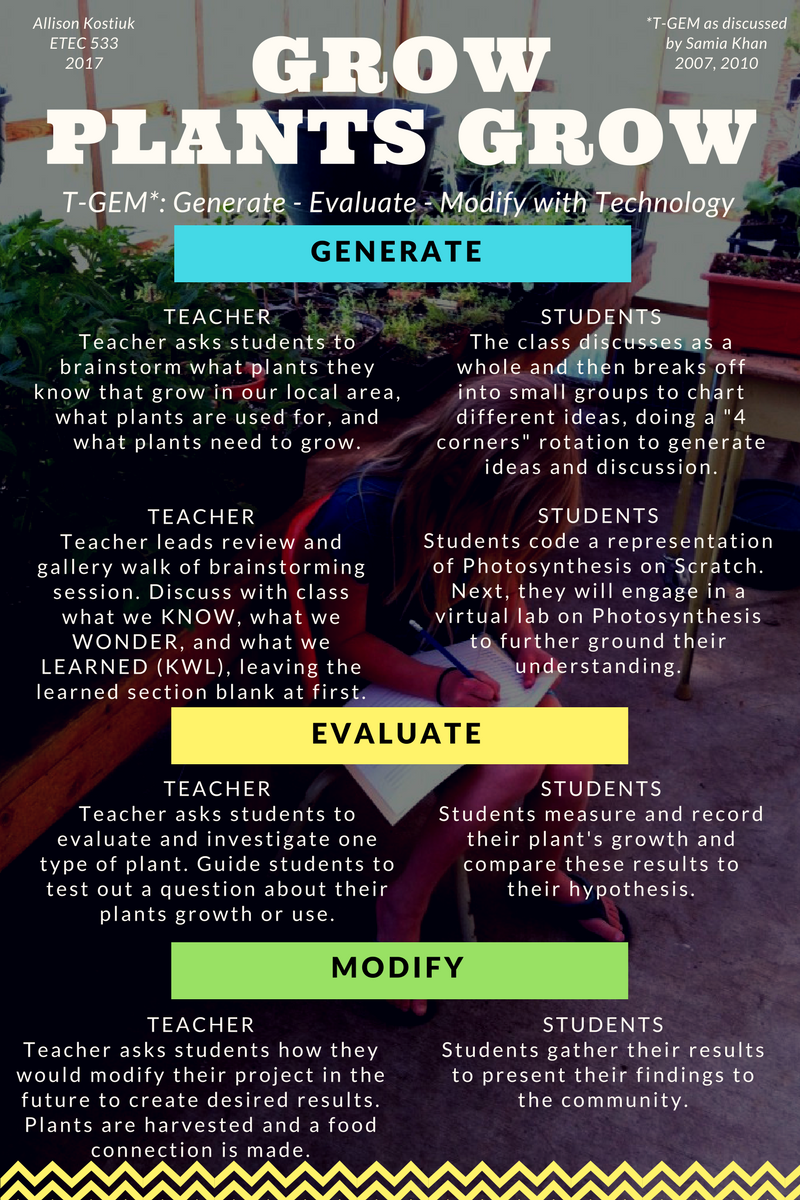
Using a T-GEM Model

Assess prior knowledge: Students will begin by using a Know, Wonder, Learn (KWL) model developed by Ogle (1986), where students will write down what they already know about matter – gas before the science unit begins (Collins, 2011). They will also write down any ‘wonders’ that they want to learn about matter. Students will share their chart with a partner to compare and contrast. Khan’s T-GEM model (2007) follows three steps: Generate, Evaluate, and Modify. Students will generate their own ideas by predicting results through hands-on experiments and the use of NetLogo to simulate the molecules inside a bicycle tire. The Evaluate portion occurs after students have tested their predictions. Students will reflect and evaluate experiments, inquiring into the why and how by documenting their learning through Book Creator app on the iPads. The last part of the model is Modify, where students will look back at their KWL chart and compare their original beliefs to what they’ve learned. This will help clear up any misconceptions students may have had surrounding matter. It also allows for the teacher to check-in and ensure students understand if their original ‘know’ included a misconception.

References:

Collins, J. W. (01/01/2011). The greenwood dictionary of education: KWL chartGreenwood.

Khan, S. (2007). Model-based inquiries in chemistryScience Education, 91(6), 877-905

Stavy, R. (1988) Children’s conception of gas International Journal of Science Education 10 (5) 553 – 560

Teaching the meaning of negative exponents

One of the common misconceptions by students when they first encounter the concept of a 0 exponent is to think that a number to the power of 0 is equal to 0. For example, many students believe that 20 = 0. The correct result is actually 1, in other words 20 = 1.

This misconception stems from their initial understanding of what exponents are. Students are taught that 23 = 2 x 2 x 2, and so when they encounter the situation of 20, it is natural to believe that it is equivalent to the number 2 multiplied by itself 0 times, which should give a result of 0. What students often fail to understand is that each time an exponent increases by 1, the value doubles. Taken in reverse, the value of 20 should be half of the value of 21, which would give the correct conclusion that 20 = 1.

To teach the concept of the 0 exponent, I have decided to take the TGEM approach as discussed by Khan (2010) , using an activity I created using the Desmos platform. The activity can be viewed here:

https://teacher.desmos.com/activitybuilder/custom/597642998fb671717b38af33

This activity encourages students to brainstorm, and share their thoughts as to what 20 is equal to, before diving into an exploration that will eventually lead students to the value of 1 using a visual approach. The activity builds on the idea to discuss the concept of negative exponents and their meaning. I would utilize the above activity using the following steps:

  1. Point students to the above link to allow them access to the activity. Ensure that a class code is created so that the class can join. Turn on teacher pacing for this activity to ensure students don’t work ahead, and to encourage discussion along the way.
  2. On the first screen, pause and allow the students to read. Allow students to brainstorm what their initial thoughts are about the meaning behind the concept of a 0 exponent. Using the teacher dashboard, display the students input to look for commonalities in thinking.
  3. On the second screen, ensure students understand that the numbers are doubling at each step. Students should be informed that they need to be precise, and that the “numbers are increasing” is will not adequately describe the pattern they see.
  4.  On the third screen, ensure students understand that the numbers are halving at each step. Students should be informed that they need to be precise, and that the “numbers are decreasing” will not adequately describe the pattern they see.
  5. On the forth screen, ensure students can now reach the conclusion as to what the value of 2^0 is. Spend some time explaining the idea that a power with an exponent of 0 is equal to 1, no matter what the base is.
  6. On the fifth screen, ensure students continue the pattern to reach a conclusion as to the meaning of a negative exponent.

Khan, S. (2010). New pedagogies for teaching with computer simulationsJournal of Science Education and Technology, 20(3), 215-232. Available in Course Readings.

Info-VIS and comparing decimals

The purpose of Information visualization tools or Info-Vis is to create TELE’s where students can explore more abstract concepts to help build conceptual understanding.  First I found it helpful how Clements (2014) uses Zimmermann and Cunningham (1991) definition of visualization in Math as “to describe the process of producing or using geometrical or graphical representations of mathematical concepts, principles or problems, whether hand drawn or computer generated. ” In this week’s readings I explored NetLogo and how it could be used to help students build understanding around decimals.  Often as we begin the exploration of decimals students apply the knowledge of numbers help previously.  For example 100 is bigger than 50 they can draw 100 things and then 50 and show that their thinking is correct.  When you change that to 0.101 and 0.0101 you often find they say they are the same, there is 101 in each and struggle to imagine/conceptualize what 1/10th and 1/100th of something looks like.  Finkelstein et al. (2005) looked at the effects of learning in a science classroom with students learning circuits and found that overall the long term understanding was greater for those students who used computer generated simulations versus those that used real circuits.  It is encouraging to hope that the same would apply in this scenario allowing for deeper and greater understanding of decimals.


Comparing Decimals

Goal: Students will be able to compare and order decimals from largest to smallest.

Materials Required:

Chrome Book

App – NetLogo – Colour Fractions

Lesson (using LfU model)

Motivation:

– students are presented with two decimal numbers on the board, they can choose how much additional recess time they will receive.  Their goal is to determine which will give them more recess time.

Knowledge Construction:

– students working on own write down the two numbers and what they know so far.

– Students working in partners compare what they know and complete the following statement that “I believe ________ will allow us more recess because (provide reasoning – using words, pictures.

– Students access Color Fractions Model on NetLogo site and start by using it to represent known decimals, such as 0.1 and 0.5 to build familiarity with program.

– Students create Color Fractions Model for two represented decimals

– Students use models to determine which decimal in indeed larger.


Knowledge Refinement:

– Students return to initial statement and refine as needed with a focus on expanding and using new knowledge of why one number is larger.


References:

Clements, M. K. A. (2014). Fifty years of thinking about visualization and visualizing in mathematics education: A historical overview. In Mathematics & Mathematics Education: Searching for Common Ground (pp. 177-192). Springer Netherlands. Available from UBC. https://lib-phds1.weizmann.ac.il/Dissertations/Mathematics_and_Mathematics_Education.pdf#page=175

Finkelstein, N.D., Perkins, K.K., Adams, W., Kohl, P., & Podolefsky, N. (2005). When learning about the real world is better done virtually: A study of substituting computer simulations for laboratory equipment. Physics Education Research,1(1), 1-8. Retrieved from https://journals-aps-org.ezproxy.library.ubc.ca/prper/abstract/10.1103/PhysRevSTPER.1.010103

Wilensky, U. (2005) NetLogo Color Fractions model. http://ccl,northestern.edu/netlogo/models/ColorFractions. Center for Connected Learning and Comptuer-Based Modeling, Northwestern University, Evanston, IL.

Wilensky, U. (1999) NetLogo. http://ccl,northestern.edu/netlogo/ . Center for Connected Learning and Comptuer-Based Modeling, Northwestern University, Evanston, IL.

Xiang, L., & Passmore, C. (2014). A framework for model-based inquiry through agent-based programming. Journal of Science Education and Technology, doi:10.1007/s10956-014-9534-4

WisWeb Minecraft

Dynamic visualization software has completely changed how students can view concepts in Science and Math. I explored the WisWeb site and looked at the two graphing applets which I decided to link to a lesson that I do in Minecraft based on the coordinate system.  The LfU framework can be seen throughout this lesson as the 3 elements of motivation, construction and reflection are apparent.  Students in grade 5 often have a hard time discerning when they will actually use a coordinate system that employs an x, y axis. Minecraft uses not only an x, y axis but employs a z axis which brings the 3rd dimension to the graphing process. Students are placed in the Minecraft environment and are introduced to the x,y, and z axis’s through a virtual orienteering exercise.  This incorporates social studies with math in an environment that has no physical limitations.  I can also control the environment by freezing students, giving rewards or warping them to a new lesson “Simulations provide the instructor considerably more freedom in designing and applying constraints” (Finkelstein, Perkins, Adams, Kohl,  & Podolefsky, 2005). By the end of the 2 day lesson students are quite involved in their environments, have a much better understanding of coordinates and graphing and are keen to start to develop their own coordinate quest platforms. “By presenting concepts at multiple levels using multiple representations and providing students the opportunity for guided exploration with instant feedback” (Stieff & Wilensky, 2003)


Goal: to help students understand the idea of an axis,  locating/plotting points on a 2D plane, Relationship between points, introduction of third dimension

Materials: MinecraftEdu, custom coordinates lesson maps (2 maps)

Lesson

  1. Introduce students to the “Coordinates test area” map where they will be confined to move about on a grid in a confined zone to record 9 seperate coordinates on a seperate piece of paper
  2. Once a basic understanding of how the x,y,z coordinate system works warp students to “Coordinates quest area” and form students into teams of 2
  3. Place 20 coordinates on projector and give students 40 minutes to locate as many as they can
  4. Each coordinate location contains a artifact that they must retrieve and that location must be recorded on their pen and paper coordinate hunt map
  5. When completed ask students to build their own coordinate quest on their private servers, must be complete with seperate recording map

References

Finkelstein, N.D., Perkins, K.K., Adams, W., Kohl, P., & Podolefsky, N. (2005). When learning about the real world is better done virtually: A study of substituting computer simulations for laboratory equipment. Physics Education Research,1(1), 1-8. Retrieved April 02, 2012, from:http://phet.colorado.edu/web-pages/research.html .

Stieff, M., & Wilensky, U. (2003). Connected chemistry – Incorporating interactive simulations into the chemistry classroom. Journal of Science Education and Technology, 12(3), 285-302.

Simulated & Paper Circuits

Information Visualization Tools allow students to engage and interact with technology to further their math or science knowledge and understanding. They also allow the invisible to become visible.  One common area where misconceptions occur in science is with simple and parallel circuits (Brna, 1988). Many students have difficulty taking their knowledge of circuits from linear worksheet diagrams into system and simultaneous projects. To address these misconceptions, I have combined the Info-Vis PhET for simple circuits along with a tangible paper circuit lesson plan. Finkelstein, Adams, Keller, Kohl, Perkins, Podolefsky and Reid (2005) found that students were very successful transferring simulated circuits to real-life situations.


Goals:

  • Students will be able to demonstrate basic knowledge of simple circuits and parallel circuits.
  • Students will have an opportunity to use their knowledge of simple and parallel circuits in the creation of a paper circuit card


Materials:


  • Paper Circuit Materials: Cardstock, 3mm or 5mm LED lights, 3v coin cell battery, paper clip, copper tape, other paper materials as needed (coloured paper, tissue paper, recyclables, etc.)


STEM Activity – 5 Steps


Step 1 – Access prior knowledge by reviewing simple and parallel circuits. Address any misconceptions that arise.

Step 2 – Generate – Students will generate a hypothesis about simple or parallel circuits and the flow of electrons through the circuit.

Step 3 – Evaluate – Students will evaluate their hypothesis using the PhET simulation and share out their findings. What did students notice using the simulation?

Step 4 – Modify – Based on their experiences with the PhET simulation, students will modify their thinking. They will begin to outline their construction of their paper circuit using the information gained from the simulation. Transferring the knowledge from the simulation to the real-world application (the paper circuit) card and go back through T-GEM cycle using real-world circuit.

Step 5 – Extend – Students will extend their knowledge by adding a switch to their circuit.


References

Brna, P. (1988). Confronting misconceptions in the domain of simple electrical circuits. Instructional Science, 17(1), 29-55.

Finkelstein, N.D., Perkins, K.K., Adams, W., Kohl, P., & Podolefsky, N. (2005). When learning about the real world is better done virtually: A study of substituting computer simulations for laboratory equipment. Physics Education Research,1(1), 1-8. Retrieved from https://journals-aps-org.ezproxy.library.ubc.ca/prper/abstract/10.1103/PhysRevSTPER.1.010103


Excel vs. Chemland

Similar to my final design project TELE for teaching Periodicity but relevant to this post, interactives through Module B: Chemland Suite visualize periodic trends as 3D bar graphs on periodic table outline:

http://employees.oneonta.edu/viningwj/sims/periodic_table.html

Pictorial representations are more approachable than raw numbers from the data booklet, intuitively comparing values between elements on different periods and groups. It however does nothing to explain fundamental concepts like why ionization energy increases across periods, resulting in similar traditional instruction problems to memorize trends without understanding. Based on my final project, Excel can be used to zoom in on specific trends, having students work through observations at their own pace, noting discrepant events through guided inquiry (Driver et al., 1994). Simulations embed just in time prompts, minimizing unnecessary details and pressing variables freely. Otherwise pure discovery can be frequently overwhelming where learners cannot reflect upon their own learning.

5 Steps

  • Define ionization energy, electron affinity, electronegativity and melting point, having students explore trends visually using Chemland.
  • Plot Excel graphs to examine patterns across periods and down groups. Does the data fit with expectations?
  • Have students modify conclusions posing anomalies and discrepant events. Learners can think-pair-share to explain personal ideas convincing others of reasoning.
  • Discuss rationales graphing IE, EA, EN and MP against radii directly to examine whether Coulomb’s Law theory applies.
  • Have group debrief getting students to justify periodic trends, focusing on reasons more than stating from memory.

Simulations can be used to supplement lectures and verify empirical data from lab work, reviewing concepts to fill in missing information. Inquiry through agency models scientific reasoning, actively constructing knowledge. Conceptual models communicate invisible ideas, developing explanations to make sense of the natural world. Although textual representations enable higher precision and control, concrete environments help students use knowledge rather than simply memorize. With flexible private theories, learners develop original hypotheses formalizing ideas towards knowledge, enabling self-directed study with sufficient freedom testing alternative iterations (Xiang and Passmore, 2014). Modelling involves analyzing, synthesizing, debugging and explaining, progressing through multiple cycles of construction, quantification, interpretation and revision.

References

Driver, R., Asoko, H., Leach, J., Mortimer, E., & Scott, P. (1994). Constructing scientific knowledge in the classroom. Educational Researcher, 23(7), 5-12.

Xiang, L., & Passmore, C. (2014). A framework for model-based inquiry through agent-based programming. Journal of Science Education and Technology, doi:10.1007/s10956-014-9534-4

Planning multi-layered lessons with visualization

Planning multi-layered lessons with info-vis


There have been many well informed technology-enhanced lessons emerging in this forum, a number of which postulated the affordances of visualizing with the programs. Additionally, there were excellent examples of possible teacher questions and student responses in your posts in this forum. Some of your posts employed LfU, Anchored instruction, WISE, and others T-GEM, while also drawing upon the research on visualization in math and science learning to enrich your ideas. Challenging concepts, use of labs, demonstrations, physical manipulatives, affordances of digital and non-digital technologies,  and opportunities for dialogue and reflective tasks created a multi-layered enhanced set of activities. It is noteworthy that none of the lessons lectured the entire content of the math or science topic with an “add on” of technology at the end —arguably a more traditional approach to using technology in the math and science classroom. Rather, these emergent lessons illustrated, in effect, a substantiated pedagogy behind the use of the technology. The frameworks and tasks were varied, as well as the choices of digital technologies, underscoring an incredible growth of ideas that has occurred this semester and your facility with addressing challenging concepts in STEM in a well-integrated technology enhanced fashion.  Bravo!

Samia

Lesson: T-Gem and Simple Circuits

Objective: Students will be able to construct simple circuits, as well as identify the equipment needed to do so.

Materials: Computer lab, wires, light bulbs, batteries, switches.

https://phet.colorado.edu/en/simulation/circuit-construction-kit-dc

Class Activity:

  • Students prior knowledge will be assessed informally through a class discussion. What di students know about circuits; can they give any examples.  How do circuits behave.
  • Have students create circuits using phet.
  • Have students do the same process using the actual materials given to them.
  • What happens when the switch is open? Closed?
  • Try creating circuits with multiple switches and light bulbs.
  • Have students create various circuits given varying numbers of switches and light bulbs.
  • Extension: Explain to students the difference between a series circuit and a parallel circuit, have students create both and explain the difference to each other.


Grow Plants Grow Inquiry with T-GEM

For my TELE final project I chose to do an inquiry on plants with my grade 3’s integrating the T-GEM theory. I posted a link to my project in the Student Café and received some awesome feedback from some classmates (thank you!). If you would like to take a look at my project, here is the link: https://etec533.wixsite.com/growplantsgrow

I chose to create a graphic outlining my steps using the T-GEM learning theory.

The virtual lab I would integrate into the generate phase would be this virtual lab on Light and Plant Growth to encourage students to think about possible hypotheses and questions for their own projects.

My fifth and final step is to incorporate a sharing aspect to showcase student learning. With this project the sharing would be in the form of a science fair with information on the project, a display of the plant(s) used, and a food connection sample for visitors to try.

As another technology connection, as Catherine suggested to me, I may also incorporate the creation of a digital story for students to showcase their observations made throughout the project in a creative way. Technology integration is a great way to enhance learning and offers additional ways for students to share and document their learning.


Khan, S. (2007). Model-based inquiries in chemistry. Science Education, 91(6), 877-905.

Khan, S. (2010). New pedagogies for teaching with computer simulations. Journal of Science Education and Technology, 20(3), 215-232.

Sketching Transformations

I have come to recognize that many of my senior math students do not make a connection between transformations and algebraic processes.  They struggle to make the connection between physical movement and algebraic effect.  This activity is intended to assist these students in building connections in this area.

  1. Step 1 – Review Cartesian planes and coordinate systems
    1. Access prior knowledge
    2. Identify any misconceptions or gaps in learning that should be addressed in these areas before moving forward.
  2. Step 2 – Student Hypothesis
    1. Working in pairs, students will create rules for translations, reflections, and rotations while working with coordinates (e.g. when translating horizontally, the x-coordinate of each point is adjusted accordingly)
    2. While working on developing their hypotheses, students have access to a tabletop grid and shape cutouts to manipulate
  3. Step 3 – Test hypothesis
    1. Use Geometer’s Sketchpad to test hypothesis using prescribed “test” transformations
    2. Students access transformations from a list within the Geometer’s Sketchpad file
    3. Transformations will include confounding situations, such as a rotation in the opposite direction or a reflection in something other than an axis.
  4. Step 4 – Refine rules/hypothesis in consultation with a small group
    1. Students combine into groups of 3-5 students to discuss findings, inconsistencies, confirmations, etc
    2. Groups come to an agreed upon set of rules by discussing and justifying their perspectives.
  5. Step 5 – Use transformation rules to design a patterning activity for other groups in class
    1. Each group will use Geometer’s Sketchpad to design a problem scenario involving transformations that will require other groups to apply their transformation rules.
    2. Examples of problem scenarios could include designing a quilt pattern, wall or floor tiling, yard landscaping, etc. The scenario context will be an essential component of the framing of the application because “contexts allow the learner to reflect on and control for the meaning and reasonableness of their developing ideas” (Dixon, 1997, p. 140).

Dixon, J. K. (1997). Computer use and visualization in students’ construction of reflection and rotation concepts.School Science and Mathematics, 97(7), 352-358.