To understand plate tectonics, first we need to identify the plates. Typically along plate boundaries we can see certain geological features, such as mountain ranges or deep-ocean trenches. There is also many earthquakes and volcanoes. Today you will use real data to try to plot the boundaries of the Earth’s plates!
- Plot the volcanoes using the given coordinates
2. USGS – United States Geological Survey data (EARTHQUAKES!)
Click on the link below and plot out the earthquakes!
Earthquakes – over 2.5 magnitude in the last 30 days
* Mark each earthquake as close as you can – there are a lot! You can go quickly, I suggest marking these with an ‘X’ 🙂
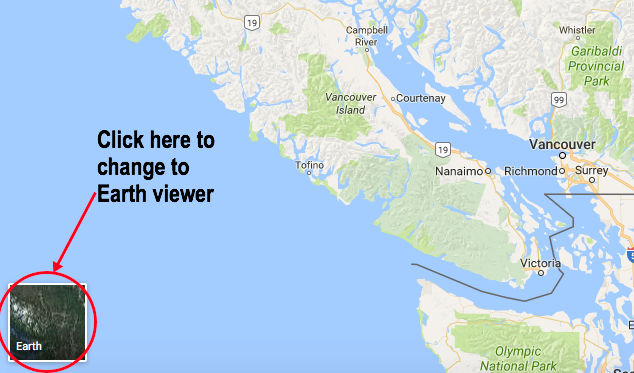
3. Google Maps
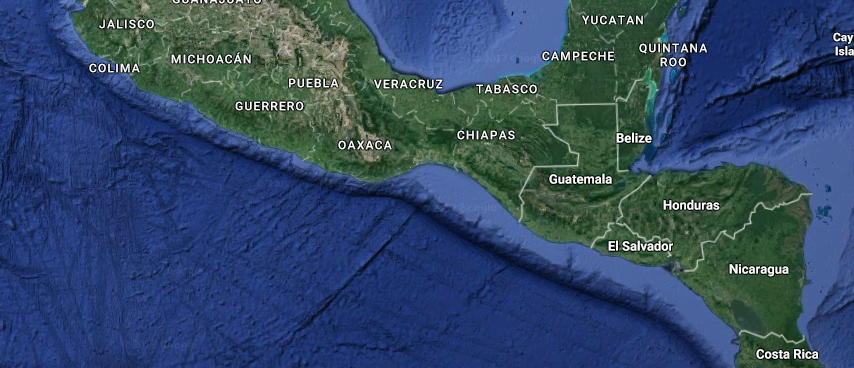
Go to google maps – look for deep-ocean trenches and continental mountain ranges to add to your map.
Look for noticeable differences such as large mountain ranges or dark blue lines in the ocean – these are trenches! You can also try searching the list provided below in google maps/earth – some will work, such as the Mid-Atlantic Ridge.
Some to get you started:
Trenches and Ridges: Mariana Trench, Japan Trench, Aleutian trench (Off of Alaska), Kuril-Kamchatka trench (Northwest Pacific near Russia/Japan), and the Mid-Atlantic ridge
Mountain ranges: Coast Mountains, Rocky mountains, Andes, Himalayas, and The Alps
Comments by shaun pletsch