Monthly Archives: March 2017

The Atoms Family in Grade 3

“Us primary [kids] are much brighter than grown ups think! We hear about atoms all the time on the Big Bang Theory and The Simpsons, so why have they decided to keep atoms a secret in primary school?”Atomic Kids  (2013)

Well, the secret is no more in BC! I must admit, that last year when I started to explore the new curriculum I was astounded to find “all matter is made of particles” and “atoms are building blocks of matter” in grade 3 science (“Building Student Success,” 2016). I was also intimidated. Through a lot of exploration with my class I was blown away to see how captivated and interested they were in the subject. I created this visual to showcase how I would integrate T-GEM into my approach with this topic:

Atoms & Molecules with T-GEM by Allison Kostiuk

I found a PhET simulation lab for “Build an Atom” that I would utilize. Funny I did not realize I had found a “simulation lab” last year until I revisited it again through my class blog. I found that this resource helps my students “visualize aspects of science that are…too large [and] too small…to view” (Khan, 2010, p. 216).


Atomic Kids. (2013). Retrieved March 03, 2017, from http://atomickids.org/

Building Student Success – BC’s New Curriculum. (2016). Retrieved March 03, 2017, from https://curriculum.gov.bc.ca/curriculum/science/3

Khan, S. (2010). New pedagogies for teaching with computer simulations. Journal of Science Education and Technology, 20(3), 215-232.


P.S. If you are looking for a cute song related to this topic, The Atoms Family is a great one!

Electrici-T-GEM

T-GEM is a pedagogical approach used to design technology-enhanced, inquiry-based learning activities.  It’s primarily goal, as defined by its name, is have students “G”enerate ideas about scientific relationships, “E”valuate their constructed knowledge, and “M”odify this knowledge as they apply their knowledge to more complex problems that help refine their understanding. (Khan, 2007)

An area that may benefit from the addition of T-GEM instruction would be the Science 9 electricity unit that I teach.  In it, one of the learning outcomes is for students to understand the relationship between voltage, current, and resistance in both series and parallel circuits.  Traditionally, this may have been taught didactically through notes and post-lecture activities simply to reaffirm the lesson topics.

However, in recent years I have approached this from an inquiry-based perspective that has students building various circuits, measuring the three properties, and drawing conclusions.  I feel that this can be extended even further with the T-GEM approach.

Below is a flow chart of how I envision an “Electrici-T-GEM” would progress, as well as key points to guide student focus.

Links to simulations:

Sim #1

Sim #2

Sim #3


References

Khan, S. (2007). Model-based inquiries in chemistry. Science Education, 91(6), 877-905.

Evaporation – Where does that water go?

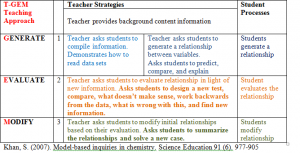
While the ideas behind Technology-enhanced Generate-Evaluate-Modify (T-GEM) were not new to me on their own, this particular model of thinking, leading to inquiry and ultimately a deeper understanding of concepts taught, was. I appreciated the step-by-step process by which GEM takes both educators and students through the learning process of generating, evaluating and modifying ideas; a model which I believe highlights a weakness in my own teaching of science and math. For me, one of the most important points to consider was the cyclical pattern in which GEM encourages students to create new hypotheses as they generate, examine, and evaluate new and existing data, and then re-examine and modify relationships between data and ideas/hypotheses generated (Khan 2007 & 2010). I believe I often struggle with time constraints (either real or perceived/self-imposed) which means that I miss important steps in this learning cycle. Going forward, I believe that having a model like T-GEM will help me focus my planning on creating a more inquiry-based environment in my own classroom. As highlighted by a survey item generated by Khan, students overwhelmingly felt that “having us generate, evaluate, and modify relationships in class is valuable for my understanding of the concepts” taught (in this case referring to chemistry) with 91% of students agreeing with the statement, 0% disagreeing, and 9% neutral (Khan, 2007, p.900 – included percentages; Khan, 2010, p. 227 – listed as a survey question only). While this particular survey question related to a university-based chemistry course, I believe it is true for any science-based concept that students are required to learn.

The simulations in Chemland were not applicable to my current students as I work in a grade 4/5 split class, but I enjoyed exploring the program and I recognize the incredible possibilities the simulations would provide for an appropriate age/grade group. Having said that, I could see the “Specific Heat Capacity” simulation (http://employees.oneonta.edu/viningwj/sims/specific_heat_s.html) and even “Heat Transfer Between Substances” (http://employees.oneonta.edu/viningwj/sims/heat_transfer_s.html) having the potential to be used by at least some students in a higher-level intermediate grade within an elementary school (i.e., grade 6/7).

T-GEM Model with assignment (aimed at grade 4 Science):

For this activity, I chose to focus on evaporation due to the fact that students often have a variety of misconceptions related to “phase changes of water” (p. 4), as is identified by Laura Henriques (2000) in “Children’s misconceptions about weather: A review of the literature.” Henriques identifies that rather than understanding “water left in an open container evaporates changing from liquid to gas,” children may believe the water “is absorbed by the container” or simply “disappears (Bar, 1989; Osborne & Cosgrove, 1983);” that it “changes into air or disappears and turns into air ((Bar, 1989; Brody, 1993; Lee, et al., 1993; Osborne & Cosgrove, 1983);” or that “the water dries up – it is not steam, it just dries up and goes into the air (Bar, 1989)” (p. 5). Henriques points out that “all the misconceptions here (except water being absorbed by the container) are basically true since water vapor is a legitimate component of air,” however, students generally “were not viewing the evaporated water as a component of air because air to them is nothingness” (p. 5).

G – Generate:
To access prior knowledge, check for misconceptions, and generate ideas about the topic, evaporation, I would begin with a few different activities to activate thinking and knowledge from different angles.

1) First, students would complete a “What-So-What?” activity. Students would be given a handout with a t-chart on it. The left column of the chart says “What?” and the right column says “So What?” Students would be shown two pictures and would be expected to respond on “What” they see and why each thing they see might be of importance (“So What?”). The pictures will be projected through a projector/proxima to a screen for them. The first picture would be of a bowl/container filled with water, perhaps sitting near a window or outside on a sunny day. The students would be given a set amount of time (I usually allow only one minute) to list as many things as possible that they see in the picture. They are then given additional time (I usually give about two minutes) to respond to why each thing they saw might be important in the “So What?” column. Next, students would be presented with a picture of the same container, except this time it would be empty (time and weather could change, but container and its location would remain the same). They would repeat the “What-So-What?” process. I would then do a “Whip Around” to have each student share one idea they came up with from the pictures – students are allowed to expand on an idea already shared by a peer, but must make it “their own.”

2) Originally, I had thought that I would have students generate ideas they had about the term “evaporation” by doing an idea web on paper. However, having read Khan’s (2012), “A Hidden GEM: A pedagogical approach to using technology to teach global warming” I decided I would borrow an idea from Khan’s generate strategies and use the Cmap program discussed in the article. Cmap software was developed through research by the Florida Institute for Human & Machine Cognition (IHMC) and “empowers users to construct, navigate, share and criticize knowledge models represented as concept maps” (IHMC, 2014). It is marketed as a software that can be used by all age groups, as individuals, as well as within schools and institutions (http://cmap.ihmc.us/). I had never used Cmap before, but found it very easy to download and to use at basic level. I feel that my grades 4/5 students would be comfortable using this application.

Using Cmap, I would ask students to create an initial map of ideas they can generate about their beliefs related to evaporation. This would likely include ideas they generated through the “What-So-What” activity, from the “Whip Around” activity, as well as from their own prior knowledge. I would allow students to work in partners to encourage discussion about evaporation and ideas generated. Students would create a basic Cmap at this point.
For example:

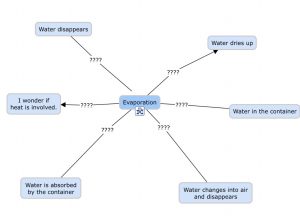
At this point, students would be asked (with their partner) to create a hypothesis based on the question: “What happens to water when it is left in an open container?”

(N.B. “What-So-What?” is a strategy I use quite often with my students, especially in Science and Social Studies lessons. I do not have an exact reference for this strategy, but it was shared by Faye Brownlie during a presentation she gave when visiting the district where I work a couple of years ago. The following is a link to her website: http://fayebrownlie.ca/)

E – Evaluate:
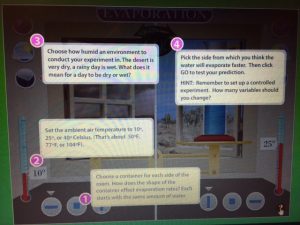
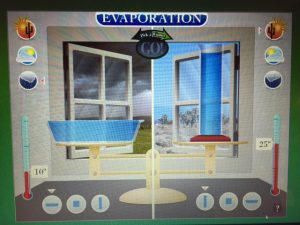
When I began searching for interactive simulations online, I found an interactive evaporation simulation that seemed to fit well with both the grade level I am aiming at (primarily grade 4) and the curriculum content that students will be expected to know “Solids, liquids and gases as matter” (B.C. Ministry of Education, 2016). Working in pairs to allow for discussion, students would use the online evaporation simulation to evaluate the ideas they generated in their Cmap. Students will be able to experiment with the following variables: how humid their environment will be (full sun, sun with clouds, clouds with rain), air temperature (between 10 and 40 degrees Celsius), and container shape (flatter and wider versus taller and thinner).
As students progress through the simulation, they will record/graph their findings taking into account the changes in variables.

Interactive evaporation simulation link:
http://archive.fossweb.com/modules3-6/Water/activities/evaporation.html

M – Modify:
Once they have completed the interactive evaporation simulation and recorded their findings, students will return to their original Cmap webs to modify their original webs. New ideas/findings/knowledge can be added to the existing Cmap, and new concepts can be added. In addition to this, new connections can be made, connecting existing ideas together, and causal relationships can be identified, all within the Cmap.
If I am looking for a more in-depth assessment or for further evidence of learning, I could ask students to explain orally (conference-style) what they observed happening during the simulation and to explain the concepts and connections shown on their Cmap. I could also ask students to write a paragraph to explain what they have learned and/or to draw a picture showing their understanding. Once modifications to their Cmap are complete, students would be asked to modify their original hypothesis, based on the data they have collected (based again on the question: “What happens to water when it is left in an open container?”).

References:

British Columbia Ministry of Education (2016). Area of learning: Science, grade 4. Retrieved from https://curriculum.gov.bc.ca/sites/curriculum.gov.bc.ca/files/pdf/s_learning_standards.pdf

Henriques, L. (2000, April). Children’s misconceptions about weather: A review of the literature. Paper presented at the annual meeting of the National Association of Research in Science Teaching, New Orleans, LA. Retrieved 7 January, 2017, from: http://web.csulb.edu/~lhenriqu/NARST2000.htm

IHMC. (2014). Cmap. Retrieved from http://cmap.ihmc.us/

Interactive evaporation simulation (n.d.). Retrieved 27 February, 2017, from http://archive.fossweb.com/modules3-6/Water/activities/evaporation.html

Khan, S. (2012). A Hidden GEM: A pedagogical approach to using technology to teach global warming. The Science Teacher, 79(8), 59-62.

Khan, S. (2010). New pedagogies for teaching with computer simulations. Journal of Science Education and Technology, 20(3), 215-232.

Khan, S. (2007). Model-based inquiries in chemistry. Science Education, 91(6), 877-890

T-GEM – Heating Curve of Water

GEM is an acronym for a pedagogical approach to teaching science that involves students taking an active part in constructing their own understanding of relationships and concepts, as well as learning how the scientific inquiry process works (Khan, 2007).

G in GEM stands for students Generating ideas about relationships,
E represents students Evaluating the relationships they have constructed,
M is the stage where students Modify those relationships to account for any discrepancies discovered during the modification stage, or to rectify any misconceptions held.
T-GEM is an adaption of the strategy to incorporate the integration of Technology into its implementation in the form of simulations or interactive models.


In her case study, Khan highlighted an important piece to the GEM cycle. Background content knowledge provided by the teacher at the beginning of the lesson is an important step to help students make some sense of the data they will be seeing in the experiments and simulations. This is essentially activating their schema or their prior knowledge in order for the students to build on their conceptual knowledge.  If the students don’t know what they are looking at, seeing relationships in the data becomes difficult (Khan, 2007).

Computer simulations that assist students’ visualization of scientific phenomena have been associated with gains in conceptual understanding among science students (Khan, 2010).  This corresponds directly with the TPCK pedagogy allowing teachers to integrate interactive science simulations for students enabling them to grasp somewhat “invisible” concepts.

Over many years of teaching the science of Heat Energy, every year the students have misconceptions around the process of boiling liquids, and in particular the boiling of water. These misconceptions appear to have their basis in the way students observe their world around them (Johnson, 1998; Collins & Gentner, 1987). Andersson  (as cited in Driver, Guesne & Tiberghien, 1985, pg 82) found that 40 percent of twelve year old students expect water to continue to heat up even after it has reached its boiling point. The students also thought that the amount of time that heat was applied would affect the temperature would continue to affect the boiling point. This is true for my own experience with this age group doing a heating curve of water experiment. As the students got older, the percentage of students with this misconception decreased but there was still a large percentage who continued to misunderstand the nature of boiling. Driver, Guesne & Tiberghien (1985, p.82) state the “children’s logic had led them to think that the time of boiling and energy supply could influence the boiling point of a pure liquid.” They argue that “much of the confusion arises from the child’s view that heat and temperature are the same” (p.82). Since children have this preconceived notion they associate the increase in temperature with a corresponding increase in heat.

In order to combat this misconception in my science classroom I would use the T-GEM method to provide some computer simulations that complement the physical experiment of boiling water in the classroom.

Heating Curve of Water Lesson Plan

  1. Provide an Anticipation Guide on Heat and Temperature for students to complete and to generate a class discussion. This should elicit misconceptions, if any, to be aware of as we progress through the lesson.
  2. Generate – Students are asked to present a hypothesis on what they predict will happen when they heat an ice cube in a beaker over a period of time. They should use their knowledge and understanding of particle movement in matter, and heat energy to explain their hypothesis.
  3. Students will then conduct the physical experiment using hot plates, beakers, ice cubes, thermometers, and timing devices. They will work in partners, one to observe the beaker and read the thermometer at 60 second intervals, and the other to record the data and time the intervals. This could also be recorded by video using a device for students to replay.
  4. At the completion of the experiment, the students will graph their data to show the heating curve and provide an explanation to fit their observations, and prove or disprove their hypothesis. This is generally where most of the students have difficulty understanding why the temperature plateaus as the water changes states from solid to liquid, and again from liquid to gas. They are usually surprised that the temperature does not continue to rise at a steady pace throughout the whole process. It is here that I feel the computer simulations will benefit the students as they will be able to see the particles moving in one, and they can rerun the computer simulation showing the boiling point to determine the cause of the plateau.
    https://simbucket.com/meltingandboiling/

    http://www.physics-chemistry-interactive-flash-animation.com/matter_change_state_measurement_mass_volume/boiling_pure_substance_water_from_liquid_to_gas_vaporization.htm
  5. Evaluate – Students will be introduced to the two computer simulations showing the heating curve of water. One simulation allows them to view the particle movement as they are heated up demonstrating the changes in state, and the other allows them to complete the boiling water experiment in a virtual situation where they can observe the changes as the time increases. This also generates a heating curve graph for the students to compare to their own graph. If the students videoed the experiment, they can generate comparisons between the computer simulation and their video observations.
  6. Modify – Given the new information from the computer simulations, students can compare their data with the computer generated data and come up with new hypotheses for the plateaus in temperature. Small group discussions would be held for students to compare data, understanding and hypotheses. Discussions will help determine if there is a need to repeat the experiment for better observations, or to design a different experiment to explain the data and scientific phenomena.
  7. After discussion and evaluation, students will write a conclusion for their experiment that allows for all the information generated through the physical experiment, as well as the computer simulations.
  8. Students can now take their observations and hypotheses and apply them to other pure liquids.

Hopefully this will allow the students to understand the concepts of heat energy and changing states of matter.

References

Driver, Guesne & Tiberghien. (1985). Children’s Ideas in Science. Open University Press.

Johnson, P. (1998). Children’s understanding of changes of state involving the gas state, Part 1: Boiling water and the particle theory. The International Journal of Science Education, 20(5), 567-583.

Khan, S. (2007). Model-based inquiries in chemistry. Science Education, 91(6), 877-905.

Khan, S. (2012). A Hidden GEM: A pedagogical approach to using technology to teach global warming. The Science Teacher, 79(8). This article was written about T-GEM with middle-schoolers.

Fournat, J. (n.d.). PCCL | INTERACTIVE PHYSICS SIMULATIONS |Physics and Chemistry by a Clear Learning : free interactive physics animations | online learning for sciences | School support with interactive flash animations for lessons and corrected exercises. Electricity, Mechanics, Waves, Optics, Chemistry, Nuclear Physics. For Upper School, Secondary School, High school, Middle School and Academy. Retrieved March 02, 2017, from http://www.physics-chemistry-interactive-flash-animation.com/

Conquering Mt. Gravitation

It had been over a month since I created a Prezi so off I went…

Physics teachers are invited to “Make a Copy” of my Google Doc for this endeavor. I have been doing this activity for many years, however, it was not exactly following the GEM format.  Consequently, I added a level of complexity that involved “discrepant information” which created an opportunity for students to test a new hypothesis relating Force to Separation Distance.  I also added a question at the end of this activity that provided a “new case” for students to contemplate.

Overall, I think the new version of my project is significantly more complex.  My concern is that Grade 11 students will fold like cheap tents, as the original version already caused many a headache for many a student. However, this new GEM-ized version, allows students to be uncomfortable and creative.  Finishing this activity will undoubtedly make them feel like they have conquered a mountain!

Should anyone have any additional scaffolding ideas, please shoot them my way. (I appreciate that you may need a physics background in order to do this, however.)

Free Falling with T-GEM

Free fall is discussed in the Projectile Motion unit in the Manitoba Grade 12 Physics Curriculum.  Rane (2015) states,”researchers have proved that free fall misconceptions are very common among the students” (p. 1).  Upon a literature review, Rane (2015) has also found that, “most of the students believe that…heavier objects fall faster than lighter ones” (p. 2).  Upon conducting analysis using a 15 item free fall diagnostic test, it was found that “…students [believed] heaver objects…take half the time [while others believed] lighter [objects]…move faster” (p. 6).  It is clear that the concept of free fall is challenging.  I have designed the following T-GEM lesson to assist students in understanding free fall and associated ideas like mass, acceleration, velocity, and velocity-time graphs.

Khan (2007) describes the GEM process as a “…cyclical pattern in which students [generate], [evaluate], and [modify] hypotheses…” (p. 877).

  1. Generate – students use a set of data or computer simulations to hypothesize relationships in the analyzed data.
  2. Evaluate – students use the identified relationships and test them out on a new case or example.
  3. Modify – students modify their original hypotheses and apply them to new cases.

Khan (2007) highlighted an important prerequisite to the GEM cycle.   It is important to have a small but important didactic lesson on introductory and background information that helps students make sense of the data in the first place.  If the students don’t know what they are looking at, seeing relationships in the data becomes difficult.


Free Fall Lesson

  1. Prerequisite Information – students are introduced to the Free Fall Tower gizmo by Explore Learning.  Students are given instruction on how to manipulate the gizmo and the data that can be collected from the gizmo.  They are given a brief review of the concepts of acceleration, velocity, and mass.  Graphs of velocity versus time are also reviewed for cases of acceleration and constant velocity.
  2. Generate – students are asked to determine if there are any relationships as they observe different objects free falling.  They are asked to manipulate their gizmo with air as the atmosphere in this part of the activity.  They are also asked to observe the graph section for trials.  Some objects appear to have constant velocity as they near the end of their fall. – The goal here is to generate a hypothesis that larger objects fall to the ground faster and to generate explanations for this observance.
  3. Evaluate – once students establish the relationship that larger objects fall to the ground faster – the students are asked to conduct similar manipulations, instead now with no air (vacuum) as the atmosphere.  They quickly ought to realize no matter which object combination they choose, all objects appear to fall at the same time, regardless of shape, size, or mass.  This is the discrepant event that will challenge their original hypotheses and force students to come up an adjustment to their original hypothesis.
  4. Modification – Students discuss the discrepant event and attempt to come up with new explanations for why all objects appear to fall at the same time.  Through discussion with the teacher’s guidance – students are helped to the conclusion that mass, size, shape have no impact on free fall as acceleration due to gravity affects all objects equally.  The issue of different objects falling at different times is because of their shape and air resistance when air is the atmosphere chosen.  Students apply their new explanations to in class experiments with real objects to further solidify the concept of free fall.

References

Khan, S. (2007). Model-based inquiries in chemistry. Science Education, 91(6), 877-905.

Rane, L. V. (2015). Investigating Student’s Conceptual Understanding of Free Fall Motion and Acceleration Due to Gravity. International Journal of Allied Practice, Research and Review, II(VI), 01-08.

Around the World with…the Learning for Use Pedagogy

Around the World with…the Learning for Use Pedagogy

I enjoyed reading your great subject headers for this forum-they are a way to entice your audience to read your post. Thank you also to GIS newcomers who have taken on the challenge of learning new software over the last ten days! As several of your posts hypothesized, GIS software has technological capacities to assist us in the construction, visualization, and analysis of geographic information. I have read each of your posts and responses. The research on student alternative conceptions, constructivism, learning with the LfU pedagogy, and other pedagogical frameworks we have studied in Module B such as WISE were reported well in your posts to support your ideas about teaching. There were also incorporation of quotations directly from the research by that enriched our discussions of how we might teach math or science as an integrated experience.

LfU as a pedagogical framework was applied across many different subjects and topic areas in your examples of how to teach. For example, what the LfU framework does, is it packages these principles up in a clear, understandable way. (Similar to Newton’s Three Laws! At least for me…) So, the topic that I would like to touch on is one that I have taught for my entire career of 18 years—linear equations. Your posts on LfU were applied to teaching: math, earth science topics such as plate tectonics, social justice, science, teaching with literature, scientific inquiry, biology, engineering, environmental education, forestry, iconic building structures, and mapping the town in which you live. The variety of k-12 topics collectively illustrate how such a transfer of principles, concepts, and technologies can begin to occur across age levels and teaching and learning contexts.

We were treated in this forum to several examples also of how we might use LfU in combination with other digital technologies, such as interactive LfU lessons that used a SMART board, or LfU lessons with Gizmos through the Explore Learning website (https://www.explorelearning.com/) and its math and science topics which would allow students to explore such concepts as Weather and Climate, Tidal Effects, Seasons, and Topographic Maps rather than GIS. An additional example in the same vein as the drawings by Camilla, using LfU and iMovie and an online game, “[students] could create an evolution video on how their world was formed using iMovie or other similar software applications; Activity 2 is a teacher-led discussion on the concepts of red blood cells, antigens, and antibodies using analogies like donuts and sprinkles, animations and videos for visualization purposes, as well as manipulative models using tools like Play-Doh so that different learning styles are touched upon during the activity….Students are then taken to the computer lab where they all have access to the Blood Typing game (2017) presented by https://www.nobelprize.org that helps students practice blood transfusions on fictitious patients in attempt to save their lives.  Another example, to name a few: Desmos Faces were integrated in an LfU framework for a math lesson: Through an inquiry process, students eventually construct a simple face using horizontal and vertical lines. There is a collaborative component to the pre-made, online activity, as well. As reflected by authors in philosophy and science studies, scientific and mathematical thinking is mediated by interactions among people, and the various models, tools, and artifacts they work and think with (Latour, 1990; Lemke, 1998, 2000). This capacity to envision how a pedagogical framework may be applied to different technologies permits us to release being tethered to one particular tool and shift to overarching designs of the entire learning experience (or TELE). Well done in stretching your designs for learning for use to include an array of digital technologies.

Several posts raised students’ alternative conceptions: “water is always colder than land”, “water is always warmer than land”, “can light can be felt or heat.” It was further noted in your posts that students are not likely to change their understandings in science until they notice contradictions to existing ones and that constructing relationships is a way to breach this divide (DeLaughter, Stein, Stein & Bain, 1998). This “noticing” can occur independently but is much more likely to happen with teacher guidance and the creative design of the learning environment. We hear from Radinsky about what teaching strategies look like in an LfU environment, for example, the teacher can “review shared assumptions, reference from other’s work, combine separate ideas, create multiple shared representations, leverage peers’ language and clarify ideas, and then develop new shared explanations” (Radinsky et al, 2010). There were additional teaching strategies developed to support noticing, dissonance, and enrichment from your posts, for example: we could leverage forestry map overlay from arcGIS to examine how our local forest has changed over type…. My role would entail more the curation of generative data sets that the distribution of facts. Another example of teaching strategies: When working with measurement in math, and specifically with unit conversions in early high school, LfU-based activities can involve students exploring the actual space of the classroom, school, and school yard to look for patterns in relationships between measurements taken using different measurement devices… The teacher can help to build a common record of findings and patterns, working towards conversion rules.  Another example, to name a few, included assessments provided by the teacher where the teacher integrates LfU with varying levels of Bloom’s Taxonomy, from knowledge and comprehension, to application, analysis, synthesis and evaluation of the world around them (Moore, n.d.) and a rubric (see assessments fr. Dana).

Your posts also explored how GIS technology might be used to learn about the local environment, with attention to using math or science to do so. To name just a few: Here in the United Arab Emirates using GIS is a rather new phenomenon. This puts the information into context.  We can then expand and take a look at iconic building in the UAE such as Sheik Zayed Grand Mosque in Abu Dhabi and the man-made Pal Jumairah and compare their square footage to their homes. Combining place-based learning with GIS tools offers opportunity for indigenous and western learners to gain a deeper understanding of their local world, and intuitively of the world beyond them. Inquiries related to physical environmental changes, population increase or decline of species, migration patterns and weather patterns are all relevant areas of situated learning for both indigenous and western learners. I liked the Google Earth activity of adding paths and polygons and how it could relate to our “Frolicking Friday” adventures. Every Friday we take our learning outside to our local area. Often this is in the form of treks down in the gully beside our school, and walks to our neighbour.

It was important that students’ cognitive processes were evaluated in tandem with the LfU teaching strategies and the cognitive and social affordances of various technologies. Your posts exemplified this analysis of what is happening with the student in these TELE: application and reflection are both critically important to the development of useful knowledge. It was one of the aspects of the WISE projects that I appreciated, there was time for the students to go back and revisit some of the information and reflect on what they had learned. Students need to be able to bridge the gap between the real and digital worlds (Perkins et al, 2010).  It is valuable to teach students how to use GIS when it comes to place-based learning because it gives them a tangible experience that they can relate to. It is important that students establish spatial awareness. Introducing the book in an interdisciplinary science and social justice activity: The Boy Who Harnessed the Wind: William Kamkwamba. William used his knowledge of science, his imagination and found materials to create a windmill for his town. He harnessed the only natural resource available and used it to better the lives of the villagers. Students could use Google Earth technology to view the African landscape and look for other suitable locations to build wind turbines. They are able to manipulate variables and “see” the outcome. To aid student understanding of basic bridge structures (namely, trusses), a domain specific bridge building simulator can be used to allow students to test and verify their ideas: reading Edelson’s description of the LfU process, I realised that my unit plan could be separated into the three stages discussed above.

These excerpts are just a few of the many richly detailed examples of your thinking about the guided integration of a framework with technology in support of student learning. Way to go all around (the world and the scholarship, I might add).

Best regards, Samia

An interesting Tweet promoting Religious Literacy

Hi everyone,
I was just “cruising the cafe” (that sounds worse when taken out of context) and I saw Samia’s inspiring post from awhile back. On Twitter recently, J.K. Rowling posted this “free online course” that seemed like a really great way to help us and/or our students understand the differences and similarities between various world religions. The course is out of Harvard… and since Harvard has some “street cred”, it will likely be very good!
Cheers,
Dana