Monthly Archives: August 2017

T-GEM and Computer Simulation

A common misconception that students form when presented with the process of photosynthesis, is to think that plants obtain their energy from the soil through the roots instead of producing organic compounds through the process of photosynthesis. Several misconception studies revealed that elementary students tend to believe food comes from outside an organism. This may be common to animals but plants produce starches and sugars through the chemical process of photosynthesis. Often students form this type of misconception because they tend to imbue plants with human characteristics.

The following 5-step T-GEM activities prompt students to generate ideas about plant needs, share those ideas, go through a photosynthesis simulation, and then revisit their ideas in light of new knowledge obtained via the simulation, and then work in groups to create diagrams based on the re-evaluated relationship between what plants need to grow and survive and how plants manufacture food.

  1. Use the following questions to generate ideas:
    • What do plants need to grow and survive?
    • Why do you think those needs are important for plants to grow and survive?
    • How do you think plants obtain nutrients?
  2. After the activity, have students come up with answers and compile those answers in a Google Doc to share with the rest of the class.
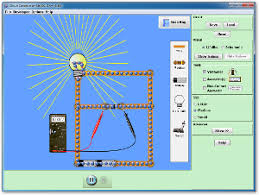
  3. Exploring the computer simulation – https://authoring.concord.org/activities/1008/single_page/4d989d7d-36c2-4ec4-9213-21bccc90b705
  4. Ask students to revisit their predictions in light of new information obtained during the photosynthesis simulation and to modify their predictions generated in step 1. Students can then reflect these prediction modifications in the Google Doc.
  5. Two parts:
    • Through group work, students re-evaluate the relationship between what plants need to grow and survive and how plants manufacture food
    • Following that students create a photosynthesis diagram with the help drawing software, like Cacoo, and share the diagram with the group.

Linn et al. (2004) have demonstrated that using the computer as a learning partner supports students’ mastery of concepts and ability to integrate knowledge. Computer simulations provide authentic learning experiences where students are afforded immediate feedback enabling them to refine and mature their evolving ideas, and take ownership of their learning (Lee et al., 2010). They promote active engagement in higher order thinking, and help students learn abstract concepts (Hargrave & Kenton, 2000).


References:

Hargrave, C. P., & Kenton, J. M. (2000). Preinstructional simulations: Implications for science classroom teaching. Journal of Computers in Mathematics and Science Teaching, 19(1), 47-58.

Khan, Samia (2011).  New pedagogies on teaching science with computer simulations. Journal of Science Education and Technology 20, 3 pp. 215-232.

Lee, H. S., Linn, M. C., Varma, K., & Liu, O. L. (2010). How do technology‐enhanced inquiry science units impact classroom learning? Journal of Research in Science Teaching, 47(1), 71-90.

Linn, M. C., Eylon, B. S., & Davis, E. A. (2004). The knowledge integration perspective on learning. Internet environments for science education, 29-46.

Using NetLogo for the States of Matter

Elementary Science

Topic: Chemistry – Gas

Misconception: Gases are not matter because most are invisible

Gas can be a difficult concept for children since those commonly experienced, like air, are invisible. Stavy (1988) suggests this invisibility prevents children from forming a concept of gas spontaneously. She explains that instruction is important for children to acquire knowledge about gas properties. Using a T-GEM Model and NetLogo, students will work through a variety of experiments to construct a solid understanding of the states of matter, specifically gas.

Materials:

iPad Book Creator App – to document KWL (Know, Wonder, Learn) about Gas knowledge

Computer – to access NetLogo (Students will use NetLogo to simulate and visualize the molecules inside a bicycle tire as it is being pumped up with air). Lesson can be found here: http://ccl.northwestern.edu/classroomresources/connectedchem/CC_GasLawsStudent.pdf

Using a T-GEM Model

Assess prior knowledge: Students will begin by using a Know, Wonder, Learn (KWL) model developed by Ogle (1986), where students will write down what they already know about matter – gas before the science unit begins (Collins, 2011). They will also write down any ‘wonders’ that they want to learn about matter. Students will share their chart with a partner to compare and contrast. Khan’s T-GEM model (2007) follows three steps: Generate, Evaluate, and Modify. Students will generate their own ideas by predicting results through hands-on experiments and the use of NetLogo to simulate the molecules inside a bicycle tire. The Evaluate portion occurs after students have tested their predictions. Students will reflect and evaluate experiments, inquiring into the why and how by documenting their learning through Book Creator app on the iPads. The last part of the model is Modify, where students will look back at their KWL chart and compare their original beliefs to what they’ve learned. This will help clear up any misconceptions students may have had surrounding matter. It also allows for the teacher to check-in and ensure students understand if their original ‘know’ included a misconception.

References:

Collins, J. W. (01/01/2011). The greenwood dictionary of education: KWL chartGreenwood.

Khan, S. (2007). Model-based inquiries in chemistryScience Education, 91(6), 877-905

Stavy, R. (1988) Children’s conception of gas International Journal of Science Education 10 (5) 553 – 560

Teaching the meaning of negative exponents

One of the common misconceptions by students when they first encounter the concept of a 0 exponent is to think that a number to the power of 0 is equal to 0. For example, many students believe that 20 = 0. The correct result is actually 1, in other words 20 = 1.

This misconception stems from their initial understanding of what exponents are. Students are taught that 23 = 2 x 2 x 2, and so when they encounter the situation of 20, it is natural to believe that it is equivalent to the number 2 multiplied by itself 0 times, which should give a result of 0. What students often fail to understand is that each time an exponent increases by 1, the value doubles. Taken in reverse, the value of 20 should be half of the value of 21, which would give the correct conclusion that 20 = 1.

To teach the concept of the 0 exponent, I have decided to take the TGEM approach as discussed by Khan (2010) , using an activity I created using the Desmos platform. The activity can be viewed here:

https://teacher.desmos.com/activitybuilder/custom/597642998fb671717b38af33

This activity encourages students to brainstorm, and share their thoughts as to what 20 is equal to, before diving into an exploration that will eventually lead students to the value of 1 using a visual approach. The activity builds on the idea to discuss the concept of negative exponents and their meaning. I would utilize the above activity using the following steps:

  1. Point students to the above link to allow them access to the activity. Ensure that a class code is created so that the class can join. Turn on teacher pacing for this activity to ensure students don’t work ahead, and to encourage discussion along the way.
  2. On the first screen, pause and allow the students to read. Allow students to brainstorm what their initial thoughts are about the meaning behind the concept of a 0 exponent. Using the teacher dashboard, display the students input to look for commonalities in thinking.
  3. On the second screen, ensure students understand that the numbers are doubling at each step. Students should be informed that they need to be precise, and that the “numbers are increasing” is will not adequately describe the pattern they see.
  4.  On the third screen, ensure students understand that the numbers are halving at each step. Students should be informed that they need to be precise, and that the “numbers are decreasing” will not adequately describe the pattern they see.
  5. On the forth screen, ensure students can now reach the conclusion as to what the value of 2^0 is. Spend some time explaining the idea that a power with an exponent of 0 is equal to 1, no matter what the base is.
  6. On the fifth screen, ensure students continue the pattern to reach a conclusion as to the meaning of a negative exponent.

Khan, S. (2010). New pedagogies for teaching with computer simulationsJournal of Science Education and Technology, 20(3), 215-232. Available in Course Readings.

Info-VIS and comparing decimals

The purpose of Information visualization tools or Info-Vis is to create TELE’s where students can explore more abstract concepts to help build conceptual understanding.  First I found it helpful how Clements (2014) uses Zimmermann and Cunningham (1991) definition of visualization in Math as “to describe the process of producing or using geometrical or graphical representations of mathematical concepts, principles or problems, whether hand drawn or computer generated. ” In this week’s readings I explored NetLogo and how it could be used to help students build understanding around decimals.  Often as we begin the exploration of decimals students apply the knowledge of numbers help previously.  For example 100 is bigger than 50 they can draw 100 things and then 50 and show that their thinking is correct.  When you change that to 0.101 and 0.0101 you often find they say they are the same, there is 101 in each and struggle to imagine/conceptualize what 1/10th and 1/100th of something looks like.  Finkelstein et al. (2005) looked at the effects of learning in a science classroom with students learning circuits and found that overall the long term understanding was greater for those students who used computer generated simulations versus those that used real circuits.  It is encouraging to hope that the same would apply in this scenario allowing for deeper and greater understanding of decimals.


Comparing Decimals

Goal: Students will be able to compare and order decimals from largest to smallest.

Materials Required:

Chrome Book

App – NetLogo – Colour Fractions

Lesson (using LfU model)

Motivation:

– students are presented with two decimal numbers on the board, they can choose how much additional recess time they will receive.  Their goal is to determine which will give them more recess time.

Knowledge Construction:

– students working on own write down the two numbers and what they know so far.

– Students working in partners compare what they know and complete the following statement that “I believe ________ will allow us more recess because (provide reasoning – using words, pictures.

– Students access Color Fractions Model on NetLogo site and start by using it to represent known decimals, such as 0.1 and 0.5 to build familiarity with program.

– Students create Color Fractions Model for two represented decimals

– Students use models to determine which decimal in indeed larger.


Knowledge Refinement:

– Students return to initial statement and refine as needed with a focus on expanding and using new knowledge of why one number is larger.


References:

Clements, M. K. A. (2014). Fifty years of thinking about visualization and visualizing in mathematics education: A historical overview. In Mathematics & Mathematics Education: Searching for Common Ground (pp. 177-192). Springer Netherlands. Available from UBC. https://lib-phds1.weizmann.ac.il/Dissertations/Mathematics_and_Mathematics_Education.pdf#page=175

Finkelstein, N.D., Perkins, K.K., Adams, W., Kohl, P., & Podolefsky, N. (2005). When learning about the real world is better done virtually: A study of substituting computer simulations for laboratory equipment. Physics Education Research,1(1), 1-8. Retrieved from https://journals-aps-org.ezproxy.library.ubc.ca/prper/abstract/10.1103/PhysRevSTPER.1.010103

Wilensky, U. (2005) NetLogo Color Fractions model. http://ccl,northestern.edu/netlogo/models/ColorFractions. Center for Connected Learning and Comptuer-Based Modeling, Northwestern University, Evanston, IL.

Wilensky, U. (1999) NetLogo. http://ccl,northestern.edu/netlogo/ . Center for Connected Learning and Comptuer-Based Modeling, Northwestern University, Evanston, IL.

Xiang, L., & Passmore, C. (2014). A framework for model-based inquiry through agent-based programming. Journal of Science Education and Technology, doi:10.1007/s10956-014-9534-4

WisWeb Minecraft

Dynamic visualization software has completely changed how students can view concepts in Science and Math. I explored the WisWeb site and looked at the two graphing applets which I decided to link to a lesson that I do in Minecraft based on the coordinate system.  The LfU framework can be seen throughout this lesson as the 3 elements of motivation, construction and reflection are apparent.  Students in grade 5 often have a hard time discerning when they will actually use a coordinate system that employs an x, y axis. Minecraft uses not only an x, y axis but employs a z axis which brings the 3rd dimension to the graphing process. Students are placed in the Minecraft environment and are introduced to the x,y, and z axis’s through a virtual orienteering exercise.  This incorporates social studies with math in an environment that has no physical limitations.  I can also control the environment by freezing students, giving rewards or warping them to a new lesson “Simulations provide the instructor considerably more freedom in designing and applying constraints” (Finkelstein, Perkins, Adams, Kohl,  & Podolefsky, 2005). By the end of the 2 day lesson students are quite involved in their environments, have a much better understanding of coordinates and graphing and are keen to start to develop their own coordinate quest platforms. “By presenting concepts at multiple levels using multiple representations and providing students the opportunity for guided exploration with instant feedback” (Stieff & Wilensky, 2003)


Goal: to help students understand the idea of an axis,  locating/plotting points on a 2D plane, Relationship between points, introduction of third dimension

Materials: MinecraftEdu, custom coordinates lesson maps (2 maps)

Lesson

  1. Introduce students to the “Coordinates test area” map where they will be confined to move about on a grid in a confined zone to record 9 seperate coordinates on a seperate piece of paper
  2. Once a basic understanding of how the x,y,z coordinate system works warp students to “Coordinates quest area” and form students into teams of 2
  3. Place 20 coordinates on projector and give students 40 minutes to locate as many as they can
  4. Each coordinate location contains a artifact that they must retrieve and that location must be recorded on their pen and paper coordinate hunt map
  5. When completed ask students to build their own coordinate quest on their private servers, must be complete with seperate recording map

References

Finkelstein, N.D., Perkins, K.K., Adams, W., Kohl, P., & Podolefsky, N. (2005). When learning about the real world is better done virtually: A study of substituting computer simulations for laboratory equipment. Physics Education Research,1(1), 1-8. Retrieved April 02, 2012, from:http://phet.colorado.edu/web-pages/research.html .

Stieff, M., & Wilensky, U. (2003). Connected chemistry – Incorporating interactive simulations into the chemistry classroom. Journal of Science Education and Technology, 12(3), 285-302.

Simulated & Paper Circuits

Information Visualization Tools allow students to engage and interact with technology to further their math or science knowledge and understanding. They also allow the invisible to become visible.  One common area where misconceptions occur in science is with simple and parallel circuits (Brna, 1988). Many students have difficulty taking their knowledge of circuits from linear worksheet diagrams into system and simultaneous projects. To address these misconceptions, I have combined the Info-Vis PhET for simple circuits along with a tangible paper circuit lesson plan. Finkelstein, Adams, Keller, Kohl, Perkins, Podolefsky and Reid (2005) found that students were very successful transferring simulated circuits to real-life situations.


Goals:

  • Students will be able to demonstrate basic knowledge of simple circuits and parallel circuits.
  • Students will have an opportunity to use their knowledge of simple and parallel circuits in the creation of a paper circuit card


Materials:


  • Paper Circuit Materials: Cardstock, 3mm or 5mm LED lights, 3v coin cell battery, paper clip, copper tape, other paper materials as needed (coloured paper, tissue paper, recyclables, etc.)


STEM Activity – 5 Steps


Step 1 – Access prior knowledge by reviewing simple and parallel circuits. Address any misconceptions that arise.

Step 2 – Generate – Students will generate a hypothesis about simple or parallel circuits and the flow of electrons through the circuit.

Step 3 – Evaluate – Students will evaluate their hypothesis using the PhET simulation and share out their findings. What did students notice using the simulation?

Step 4 – Modify – Based on their experiences with the PhET simulation, students will modify their thinking. They will begin to outline their construction of their paper circuit using the information gained from the simulation. Transferring the knowledge from the simulation to the real-world application (the paper circuit) card and go back through T-GEM cycle using real-world circuit.

Step 5 – Extend – Students will extend their knowledge by adding a switch to their circuit.


References

Brna, P. (1988). Confronting misconceptions in the domain of simple electrical circuits. Instructional Science, 17(1), 29-55.

Finkelstein, N.D., Perkins, K.K., Adams, W., Kohl, P., & Podolefsky, N. (2005). When learning about the real world is better done virtually: A study of substituting computer simulations for laboratory equipment. Physics Education Research,1(1), 1-8. Retrieved from https://journals-aps-org.ezproxy.library.ubc.ca/prper/abstract/10.1103/PhysRevSTPER.1.010103


Constructing Knowledge in Math and Science

How is knowledge relevant to math or science constructed? How is it possibly generated in these networked communities? Provide examples to illustrate your points.

Knowledge and concepts in science rarely manifest themselves in an obvious type of setting, and as such, students require opportunities to engage with physical, practical activities that allow for direct experience and manipulation with objects, both real and virtual. Teachers must provide experiential evidence while making the cultural tools and conventions of the science community available to students. The challenge is how to achieve this successfully within the round of normal classroom life.

According to Driver et al. (1994), scientific concepts are constructs that have been invented and imposed on phenomena in attempts to interpret and explain them, often as results of considerable intellectual struggles. Once scientific knowledge has been constructed and agreed on within the scientific community, it becomes part of the “taken for granted” way of seeing things within that community. These entities, concepts and practices are unlikely to be discovered by individuals through their own observations of the natural world (Driver et al., 1994). From this, scientific knowledge becomes public knowledge that is constructed and communicated through the culture and social institutions of science.

Through group interactions, students are exposed to the stimulus of differing perspectives on science and mathematical topics which then provides opportunities for individual reflection. In this learning environment, the teacher’s role is to provide the physical experiences and encourage student reflection while providing affordances for students to gain an exposure to the ideas and the practice of the scientific community in order to personalize and engage with scientific and mathematical ideas and practices at an individual level.

Referencing student opportunities at the Exploratorium, Hsi (2008) states that technology can be used to provide extended learning opportunities to link a museum learning experience to further learning activity taking place in other settings, and through this, some exhibits make use of feedback systems and video conferencing to enable visitors to discuss in real time with another visitor in a remotely located museum. Hsi (2008) notes the use of technology tools to track and record allow for creative connection between the real world and virtual environments. Within these contexts, technology can be leveraged to encourage inventiveness, creativity and ownership using tools as a medium for constructive activity and learning (Hsi, 2008). Individual learners can access and be apprenticed in authentic science practices through participating in truly global investigations. One example is the Great Backyard Bird Count, sponsored through the Cornell Lab of Ornithology, which permits distributed communities to contribute data and information to be discussed and compiled online.

Regarding off-site learning opportunities, it is important to recognize and acknowledge the perception that virtual reality and virtual field trips are important; however, these activities should not be utilized as a replacement for real field work and traditional field courses (Spicer & Stratford, 2001). Within environments where it is neither possible nor safe to take students, virtual field trips offer an opportunity to engage in activities at locations that would simply not be possible otherwise. As a component of student learning experiences, virtual field trips hold significant potential and value, bearing in mind that these experiences should not be implemented with the intention of discrediting the value of real field activities and opportunities.


References

Driver, R., Asoko, H., Leach, J., Scott, P., & Mortimer, E. (1994). Constructing scientific knowledge in the classroom. Educational researcher, 23(7), 5-12.

Hsi, S. (2008). Information technologies for informal learning in museums and out-of-school settings. International handbook of information technology in primary and secondary education, 20(9), 891-899.

Spicer, J. & Stratford J. (2001). Student perceptions of a virtual reality field trip to replace a real field trip. Journal of Computer Assisted Learning, 17, 345-354.

Students vs the World

Upon closer examination and re-reading certain articles, I do believe that Globe is an example of anchored instruction.  Anchored instruction, also known as instructional design, includes engaging and problem rich environments that allow learners to understand the how, why and when to use different concepts and strategies (Cognition and Technology Group at Vanderbilt, 1992). Although Globe doesn’t necessarily have an ‘anchor’ or ‘story’ such as in the Jasper series, what Globe does have are tools and learning activities to help solve an anchor in a student’s interest.

What I mean is, is that a student can have an interest in either of the Globes 4 spheres: Atmosphere, Biosphere, Hydrosphere, and Pedosphere (Soil), and thus in turn will produce its own story. For example, let’s take the Hydrosphere. A student could be concerned with the chemicals leaking into his/her nearby river and would like to find the toxins in it and learn how to solve this problem. The ‘anchor’ could be the polluted water and Globe will help with the data collection and necessary tools to use for the student. Another tool for the student to use is the professional help of a scientist. After all, Butler and MacGregor (2003) state that, “An important part of the program is the active participation of scientists as research collaborators with the students” (p. 9). The collection of data is an integral function for Globe to work and succeed and according to Ou and Zang (2006), many teachers complain about the lack of time and skills from integrating databases into their classroom instruction.

With Globe, everything is at your fingertips: learning activities, data collection sources and tools and the help of real life scientists. Does Globe have problem solving videos like Jasper? No. Does Globe foster collaborative inquiry and learning? Yes. The downfall I see with Globe is that its tools are not just tools online, but tools you need to purchase or find in your home. Math and science real-world problems apply here with Globe, and this is one of the characteristics in anchored instruction. Will Globe produce problem solving videos? Maybe, but I think this would stray away from its premise, and that is for students to contribute their own live data and help solve real-world problems.


Cognition and Technology Group at Vanderbilt. (1992). The Jasper experiment: An exploration of issues in learning and instructional design. Educational Technology Research and Development40, 65-80.

Butler, D. M., & MacGregor, I. D. (2003). GLOBE: Science and education. Journal of Geoscience Education51(1), 9-20.

Ou, C., & Zhang, K. (2006). Begin with the Internet. TechTrends50(5), 46-51.

Excel vs. Chemland

Similar to my final design project TELE for teaching Periodicity but relevant to this post, interactives through Module B: Chemland Suite visualize periodic trends as 3D bar graphs on periodic table outline:

http://employees.oneonta.edu/viningwj/sims/periodic_table.html

Pictorial representations are more approachable than raw numbers from the data booklet, intuitively comparing values between elements on different periods and groups. It however does nothing to explain fundamental concepts like why ionization energy increases across periods, resulting in similar traditional instruction problems to memorize trends without understanding. Based on my final project, Excel can be used to zoom in on specific trends, having students work through observations at their own pace, noting discrepant events through guided inquiry (Driver et al., 1994). Simulations embed just in time prompts, minimizing unnecessary details and pressing variables freely. Otherwise pure discovery can be frequently overwhelming where learners cannot reflect upon their own learning.

5 Steps

  • Define ionization energy, electron affinity, electronegativity and melting point, having students explore trends visually using Chemland.
  • Plot Excel graphs to examine patterns across periods and down groups. Does the data fit with expectations?
  • Have students modify conclusions posing anomalies and discrepant events. Learners can think-pair-share to explain personal ideas convincing others of reasoning.
  • Discuss rationales graphing IE, EA, EN and MP against radii directly to examine whether Coulomb’s Law theory applies.
  • Have group debrief getting students to justify periodic trends, focusing on reasons more than stating from memory.

Simulations can be used to supplement lectures and verify empirical data from lab work, reviewing concepts to fill in missing information. Inquiry through agency models scientific reasoning, actively constructing knowledge. Conceptual models communicate invisible ideas, developing explanations to make sense of the natural world. Although textual representations enable higher precision and control, concrete environments help students use knowledge rather than simply memorize. With flexible private theories, learners develop original hypotheses formalizing ideas towards knowledge, enabling self-directed study with sufficient freedom testing alternative iterations (Xiang and Passmore, 2014). Modelling involves analyzing, synthesizing, debugging and explaining, progressing through multiple cycles of construction, quantification, interpretation and revision.

References

Driver, R., Asoko, H., Leach, J., Mortimer, E., & Scott, P. (1994). Constructing scientific knowledge in the classroom. Educational Researcher, 23(7), 5-12.

Xiang, L., & Passmore, C. (2014). A framework for model-based inquiry through agent-based programming. Journal of Science Education and Technology, doi:10.1007/s10956-014-9534-4