A challenging Chemistry concept is explaining periodic trends, connecting related concepts of radii, ionization energy, electronegativity, electron affinity and melting point. Although data booklets provide empirical values, learners not only fail to appreciate how much work is done by the scientific community over lengthy periods for each point (Khan, 2010), they resort to memorizing trends with little understanding. For example, on practice tests students explain why Fluorine has the highest ionization energy because it is most electronegative (both of which are effects of underlying principles of effective nuclear charge and radii). On explaining radii, they state Fluorine is smallest because atoms get smaller towards the top right corner of the periodic table. Possible misconceptions arise given the order of magnitude in picometers, abstractly described at sizes too small to visualize. Similarities in definitions between ionization energy and electron affinity (and later electronegativity) make learning trends challenging as students attempt to understand key concepts while expected to compare different elements given periodic table arrangement.
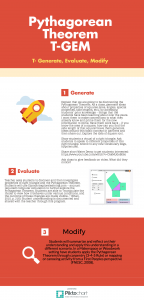
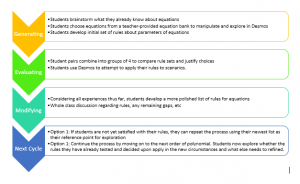
A possible T-GEM Cycle might be as follows:
Generate: Define atomic radii and ionization energy so learners have rough idea of what data represent
Evaluate: Present radii data for an individual row (ex. Li to Ne) asking students to find trend between radii and atomic number. A possible conclusions is that atomic radii decreases with more protons, graphing element radii versus atomic number.
Modify: Have students compare whether pattern works for other rows on the periodic table (ex. Na to Ar). Identify discrepancies like: Why is Na bigger than Ne (reviewing number of shells), and Why is Ne bigger than F (introducing electron repulsion).
Evaluate: Present ionization energies for individual periods, asking students to find trend between IE and atomic number. A possible conclusion is that ionization becomes harder with more protons, graphing IE versus atomic number.
Modify: Have students compare whether pattern works for other periods. Identify discrepancies like: Why does Na have lower ionization energy than Ne (reviewing number of shells), and Why is O’s electron harder to remove than N (introducing half filled p stability). Learners can extend trends comparing ionization against radii.
A possible technology contribution would be the ‘Periodic Table’ Chemland simulation: http://employees.oneonta.edu/viningwj/sims/periodic_table.html
Clicking ‘Relative Radius Covalent’, displays relative element radii as bar graphs arranged on the periodic table, using visuals to make sense of raw data. Learners can similarly click ‘Relative Energy First Ionization’ to test whether their discovered patterns are empirically consistent or whether theoretical models need to be reorganized.
*For my final TELE design, I am considering addressing similar concepts but primarily using Excel to graph data to make visual sense of patterns in the data booklet. Compiling information for atomic number, radii, first ionization, electron affinity, electronegativity and melting points, students can identify patterns across individual rows and columns, presenting discrepant events to have students iteratively refine models.
References
Khan, S. (2010). New pedagogies for teaching with computer simulations. Journal of Science Education and Technology, 20(3), 215-232.