Monthly Archives: March 2017

Information Visualization: Interactive Learning at its Best

This week, I had the opportunity to try a variety of simulation software, each of which has the potential to create a dynamic, inquiry-based environment for students in science and math classrooms. The two information visualization programs that I explored in most depth were PhET Interactive Simulations (found at: https://phet.colorado.edu/), developed by the University of Colorado, and Illuminations (found at: http://illuminations.nctm.org/), developed by the National Council of Teachers of Mathematics. I chose these two programs specifically because I currently teach in a grade 4/5 split class and wanted to explore programs with simulations or games targeted at intermediate elementary students, and because I wanted to explore both a science-based as well as a math-based program.

In “A Framework for Model-Based Inquiry Through Agent-Based Programming,” Xiang and Passmore (2015) discuss a shift in the focus of science education “…from typical classroom practice that emphasizes the acquisition of content to a classroom in which students are active participants in making sense of the science they are learning” (p. 311). Today’s students are no longer passive recipients, and are instead active participants in the acquisition of knowledge. To accommodate this shift, educators today must work to develop inquiry-based learning environments which allow students to construct knowledge through questioning, collaborating, hypothesizing, and challenging prior assumptions. In designing lessons that incorporate these features, many educators are turning to model-based inquiry which may be supported through digital simulations (Xiang & Passmore, 2015).

Despite the shift in the role of the student to active participant in modern classrooms, many students continue to struggle with math- and science-based concepts presented in current curriculums. Some students arrive with pre-conceived ideas and misconceptions, some with a significant lack of experience that hinders their understanding of concepts, some with the need for adaptations to support their learning, and so on. Srinivasan, Perez, Palmer, Brooks, Wilson, & Fowler (2006) address the fact that “a learner’s success with learning new material can be described in terms of the learner’s prior knowledge, ability, and motivation (Schraw et al., 2005)” (p. 138). In a simulated learning environment, students are given an opportunity to interact with materials and situations being taught, allowing them to learn through experience and by “doing” rather than simply by reading a textbook and listening to a teacher’s lecture. Along with this, a simulated environment provides the potential to target motivational variables such as novelty, interest, and importance or value of concepts taught (Srinivasan et al., 2006).

In the case of simulation software such as PhET, students have the opportunity to interact with materials and laboratory conditions in authentic learning environments that they may not otherwise be able to experience, due to factors such as economic feasibility or safety concerns. Sound educational principles aside, Srinivasan et al., (2006) highlight the fact that “generally speaking, it is less expensive to develop a simulation than to provide real experience” (p. 137). While Srinivasan et al. referred to their study around cockpit simulations, this same concept can easily be applied to public school and university settings today. For example, I explored a simulation titled “Energy Forms and Changes” on the PhET site in depth this week and created a lesson around it. The opportunity offered to students through the use of this simulation could not be replicated otherwise in my class. The simulation offers an “Intro” simulation that allows for the heating/cooling of iron, brick, and water (with visual tracking of energy input and output), and a second more in-depth “Energy Systems” simulation that provides students with the opportunity to actually construct their own energy systems using a variety of materials. The simulations not only provide engaging learning environments for students, but they provide materials I would often not have access to, and learning environments that can be used without the extensive laboratory preparation and clean-up that would have been required had the same activities been replicated in a traditional laboratory environment (the explorations/experiments would have taken days if not weeks to complete). Finkelstein, Perkins, Adams, Kohl, & Podolefsky (2005) note that PhET simulations “…are designed to be highly interactive, engaging, and open learning environments that provide animated feedback to the user…designed to build explicit bridges between students’ everyday understanding of the world and its underlying physical principles…” (p. 2). While this reference is to PhET university physics simulations, I would argue that the principles behind it apply to all PhET simulations that I explored. Based on their research findings, Finkelstein et al., (2005) propose that “…properly designed simulations used in the right contexts can be more effective educational tools than real laboratory equipment, both in developing student facility with real equipment and at fostering student conceptual understanding” (p. 1-2).

The Illuminations website provides similar benefits for students in the form of interactive games and learning tools to support math. Students are immersed in an engaging environment that allows for digital manipulatives or games to be used to reinforce mathematical concepts taught in the classroom. Rather than having students simply complete repetitive math questions or problems in an attempt to encourage the memorization of a concept through practice, students are engaged through constructing knowledge as they actively attempt various problems and are provided with immediate feedback to support and scaffold their learning. By implementing these and other similar learning tools and games into the classroom, students are provided with learning environments and opportunities they would not have been exposed to otherwise, and with an engaging environment that promotes learning.

Interestingly, in a study they conducted, Srinivasan et al., (2006) found that university students perceived simulations as “fake” and valued “’real’ experiences” over the simulated experiences they received; “with MATLAB the students don’t have a sense of partaking in what they perceive as authentic experience. They seem to need/want authenticity to be able to make the connections the experts make with the simulation” (p. 140). I found this interesting, but wonder if it has to do with the level of learning that students are engaging in. How well a simulation is accepted may also depend on what exactly is being simulated. In the case of an airline cockpit simulation, students might feel that they are missing out on the “real” experience of actually flying a plane which could tarnish their experience of that particular learning environment. In the case of a public school-aged student, I have generally had the impression that simulated learning environments were welcome additions to a classroom, as they often expose students to learning environments that would otherwise not have been available.

While I have not used either of these programs yet with my students, I would certainly hope to use them in my classroom in the future. Both provide interactive and engaging learning environments for students that I believe help students construct their own knowledge, rather than simply absorb what they are taught by a teacher or textbook. By interacting with materials and concepts in a simulated or game-based experience that provides information visualization, students are able to see the effects of their experiments, receive immediate feedback, and then re-evaluate their conceptions/hypotheses allowing them to more forward toward learning, rather than having a teacher or textbook attempt to re-explain a concept without the hands-on learning opportunity attached.

References:

Energy forms and changes. (n.d.). Phet Interactive Simulations, University of Colorado. Retrieved from https://phet.colorado.edu/en/simulation/legacy/energy-forms-and-changes

Finkelstein, N.D., Perkins, K.K., Adams, W., Kohl, P., & Podolefsky, N. (2005). When learning about the real world is better done virtually: A study of substituting computer simulations for laboratory equipment. Physics Education Research, 1(1), 1-8.

Srinivasan, S., Perez, L. C., Palmer, R., Brooks, D., Wilson, K., & Fowler. D. (2006). Reality versus simulation. Journal of Science Education and Technology, 15(2), 137-141.

Xiang, L., & Passmore, C. (2015). A framework for model-based inquiry through agent-based programming. Journal of Science Education and Technology, 24(2-3), 311-329.

Energy Forms and Transfer in Science 4

Grade level: Grade 4 Science

Topic: Energy Forms and Changes

Misconception: That energy is a “thing” in and of itself; it does not come in a variety of forms. That energy cannot be transferred from one object to another.

While students generally understand that adding heat warms a material and removing heat (“adding cold” i.e., ice) cools a material, the concepts of various forms of energy and energy transfer are much more abstract, and are likely to cause misconceptions and misunderstandings for students. The lesson I am outlining corresponds to the British Columbia fourth grade science curriculum (Big Idea: Energy can be transformed/Content: Energy has various forms; energy is conserved; devices that transform energy).

Objectives:
• Students will be able to demonstrate an understanding of different forms of energy.
• Students will be able to demonstrate how energy transfers from one object to another.
• Students will be able to explain the energy system they created in terms of energy input, energy output, and energy changes

Materials:
• Chart paper, Pens (x6)
• Computers to run PhET activity (requires Java Runtime Environment)

Step one: Generate ideas related to current concept(s)
Supporting inquiry: Students will be asked to respond to and develop hypotheses regarding the following questions:
• Question 1: What is energy input? What is energy output?
• Question 2: Does energy come in various forms?
• Question 3: Can energy be transferred from one object to another?

To complete this portion of the lesson, students will work in small groups (three to four students). Six stations will be set-up around the classroom with a piece of chart paper in the middle of the station (paper could also be hung on walls around classroom). Two stations will have question 1 written at the top of the chart paper, two stations will have question 2 written at the top of the chart paper, and two stations will have question 3 written at the top of the chart paper. Each group will have five minutes (time adjusted as necessary) at each station to brainstorm, discuss, and record ideas related to the question at the top of their chart paper. Groups will rotate three times so that each group will answer each of the three questions. At the end of the third rotation, each group will report out the ideas shared on the chart that they are currently at.

Step two: Hypothesize
Each group will be asked to create a hypothesis for each of the three questions. Their hypothesis can be based on their own ideas generated during the chart stations, or on the ideas of others. Students are welcome to walk around and look at the ideas generated at any of the chart paper stations to help them develop their hypotheses.

Step three (…to the computers!):
(Teachers may prefer students to work individually or in pairs at this point, depending on class composition, independence, and availability of computers)
Activity: PhET “Energy Forms and Changes” simulation  “Intro”
<found at: https://phet.colorado.edu/en/simulation/legacy/energy-forms-and-changes>
Students will begin by exploring energy input, output and conservation, as well as thermal energy, by interacting with the “Intro” simulation. In this simulation, students experiment with heating and cooling iron, brick, and water, and are able to add or remove energy by heating (visual: fire) or cooling (visual: ice) the materials given. By clicking the “Energy Symbols” box, students are able to watch the transfer of energy as the temperature of the materials increases or decreases.

Step four (still on computers):
Activity: PhET “Energy Forms and Changes” simulation  “Energy Systems”
Once students have completed the initial “Intro” to the “Energy Forms and Changes” simulation, students will click on the “Energy Systems” tab at the top left of the page to take them to the second simulation. This simulation allows students to see in more detail how energy is transferred and transformed as it moves between objects. Students build their own systems using a variety of energy sources, changers, and users, allowing students to opportunity to visually follow the transfer of energy throughout the system they have created.
Systems may be constructed using the following materials:
• wheel (turned by water, steam, bicycle), solar panel
• water tap, sunshine [with or without clouds], kettle, bicycle with rider
• container of water, regular light bulb, energy smart light bulb.

Step five: Re-evaluate ideas
Once students have completed both simulations, they will return to their hypothesis groups to re-evaluate their original hypotheses since gaining experience and knowledge while participating in the two simulations. The teacher will circulate to have each group explain how and why their original hypotheses changed after exploring “Energy Forms and Changes.”

A follow-up activity could be to have students complete a written response to answer the questions originally posed above (in step one), or to explain how their personal hypotheses changed throughout the course of the lesson. This would provide the teacher with individual feedback regarding understanding and possible continued misconceptions, as well as reconnect students to the original questions one more time.

Theory behind it:
Xiang and Passmore (2015) address the fact that the focus for science education has shifted “…from typical classroom practice that emphasizes the acquisition of content to a classroom in which students are active participants in making sense of the science they are learning” (p. 311). One of the leading principles discussed, behind this shift, is model-based inquiry, which can extend to include simulations. Through constructing, applying, and modifying models, students are given the opportunity to actively engage in the learning process, in addition to discussing, negotiating, and re-evaluating their conceptual models with peers (Xiang and Passmore, 2015). Finkelstein, Perkins, Adams, Kohl, & Podolefsky (2005) found that when the right learning environment was created, simulations could be equally effective, if not more effective, learning tools than traditional laboratory equipment “both in developing student facility with real equipment and at fostering student conceptual understanding” (p. 1-2). By integrating digital technology, not only can teachers access innovative and immersive learning environments for their students, but a number of factors can also be addressed, such as interest, motivation, and feasibility.

Srinivasan et al., (2006) highlight that “generally speaking, it is less expensive to develop a simulation than to provide real experience” (p. 137). While Srinivasan, et al. point out that this is especially clear in cases like cockpit simulators, this observation could be applied to many different science simulations, including the above PhET simulation used to teach fourth grade students about energy changes and transfer. While the PhET simulation is free (assuming school have access to computers and the internet), the time and cost associated with setting up a lab experience of the same depth would make the “real life” version of the simulations offered above unfeasible. In addition to providing an experience that would not be feasible without digital technology, novelty and interest, both addressed by Srinivasan et al. (2006) as motivational variables, are targeted in the simulations provided by PhET as well. Students are given the opportunity to explore science using a digital simulation which has the potential to increase interest and motivation as they actively engage with a simulated learning experience that would not have been possible in traditional elementary classroom settings.

References:

Energy forms and changes. (n.d.). Phet Interactive Simulations, University of Colorado. Retrieved from https://phet.colorado.edu/en/simulation/legacy/energy-forms-and-changes

Finkelstein, N.D., Perkins, K.K., Adams, W., Kohl, P., & Podolefsky, N. (2005). When learning about the real world is better done virtually: A study of substituting computer simulations for laboratory equipment. Physics Education Research, 1(1), 1-8.

Science 4: Big idea and content. (n.d.). British Columbia Ministry of Education. Retrieved from https://curriculum.gov.bc.ca/curriculum/science/4

Srinivasan, S., Perez, L. C., Palmer, R., Brooks, D., Wilson, K., & Fowler. D. (2006). Reality versus simulation. Journal of Science Education and Technology, 15(2), 137-141.

Xiang, L., & Passmore, C. (2015). A framework for model-based inquiry through agent-based programming. Journal of Science Education and Technology, 24(2-3), 311-329.

So many choices, so little time…

Over the course of the past week, I spent a lot of time investigating and trying each of the information visualization programs presented and deciding if, or how, I could incorporate them into my classroom lessons. Admittedly, I spent the most amount of time on Phet simulations, the molecular workbench, and Geometer’s Sketchpad but I will return to investigate wiseweb, illuminations applet, and netLogo in further detail. My first impression is that all of the programs seem to be worthwhile and would enhance/extend lessons in math and science.

http://dynamicgeometry.com           http://illuminations.ntcm.org    http://phet.colorado.edu

Information visualization programs enable the student to evolve from a passive learner being fed information and expected to regurgitate it on a paper and pencil assessment to an actively engaged learner who is involved in the construction of their own knowledge. As we discovered in the various program styles introduced in Module B (T-Gem, LfU, anchored instruction, SKI/WISE) students need to identify their misconceptions, find information and test hypotheses as well as modify their thinking- which can only be accomplished if they are questioning, constructing, testing, proving and defending their theories.

Software, simulations and interactive programs are excellent educational tools. Teaching using virtual tools means every child in every class can experiment with the knowledge they have acquired. The old adage seeing is believing can be taken one step further as students do not only see in more than 2 dimensions they can alter parameters and test their hypotheses and solve for solutions. If their hypotheses were correct they have reinforced what they know, if their hypotheses were incorrect they can identify their misconceptions, modify their thinking and run further tests until they are satisfied they correctly understand the concept.

The article by Finkelstein et al (2005) “When learning about the real world is better done virtually: A study of substituting computer simulations for laboratory equipment” demonstrated that learning virtually is often better than regular lab experiments.  In regular chemistry classes, students have use coloured Styrofoam balls and connectors to create molecules. As the students can create just about anything they have no idea if the molecules they are creating hold up to the laws of chemistry, a computer simulation would correct any misconceptions the students had. Finklestein et al (2005) reported that “results indicate that properly designed simulations used in the right contexts can be more effective educational tools than real laboratory equipment, both in developing student facility with real equipment and at fostering student conceptual understanding (p. 2).” They further state that in an inquiry-based laboratory, students using the simulations learned more content than did students using real equipment (p. 6).

Steiff and Wilensky (2003) reported that computer-based curriculum provides an opportunity for inquiry-based chemistry lessons. “The modeling environment, connected chemistry, uses a “glass box” approach (Wilensky, 1999a) that not only enables students to visualize the molecular world but also provides them with virtually unlimited opportunities to interact with and to manipulate a simulated molecular world to gain a deeper understanding of core chemistry concepts and phenomena (p. 285)”. They further report that simulations allow students to make predictions about a concept and justify their predictions with observable outcomes (p. 286).

Although I have not used any of the highlighted math or science simulations in my classroom yet I can compare their use to my implementation of programs code.org, tynker and scratch I have used several coding programs. The one I am most successful with is Code.org. What I have learned about using this on line is that it brings coding alive through the use of block coding. Block coding takes difficult abstract concepts and chunks it together in to information the students understand and can work with. The students learning is scaffolded from the most basic coding steps to more advanced. The program provides immediate feedback to the student so they know if they are correct or not. Most also provide the students with a “safety” key so that they do not become too frustrated and quit the program. Students who are shown the answer still must go through the steps of coding the information properly before they are able to move on.

The excellent thing about today’s coding programs is that they are also geared toward the student’s interests. Students can code with princesses, Minecraft or a whole host of other themes. For the more creative student they can create their own characters and storylines to code with.

When I was a student I was taught to code on paper (sorry I tried to code on paper) but because I never understood what I was writing, I never understood how the program would react. I thought I could never understand or write code. I wrote myself off as computer illiterate. Coding programs have helped me evolve from this scared computer person to someone confident enough to teach it to her students. My students love working with these programs (every student even my some of my special needs students are great at it, they see it as a cause-effect relationship they understand).  It is vital that we start coding with our students at an early age as it has been said that coding is the language of the future. The language all workers will need to understand.

With regards to Geometer’s Sketchpad and the other math programs we looked at this week I hope to incorporate these more in my classroom lessons. I have discovered the value simulations in math to be immediate feedback to the student. In previous years when I have had students work with paper and pencil or manipulatives they often assume they are correct and consistently make the same errors, in essence reinforcing an incorrect concept. With computer simulations students are immediately shown if they are correct or not. If they are not correct they must fix their errors before they are allowed to move on. Many of the newer software companies are installing subprograms that identify specific concepts students struggle with and provide more reinforcement with those concepts.

Srinivasan et al (2006) explain the importance of a simulation being in the students current range of development and understanding. “The task must present an optimal learning challenge (Deci and Ryan, 1985). When this type of task is presented, students will perceive themselves as competent enough to be successful and enticed enough by the learning task to sustain their attention. By using appropriate assessments, we can determine reasonably successfully the ‘optimal level’ of instruction (p. 139).” What was especially interesting to note in this study was that students (the example provided was a cockpit simulator) believed simulators to be a less valuable learning experience than being in an actual cockpit, while the expert pilots found the simulator to be a valuable learning experience (p. 140). One must wonder if the basis of the student’s beliefs lie in their kinesthetic awareness of a real cockpit that an expert pilot would already have?

The articles I read on mathematics included Edens and Potter (2008), Sinclair and Bruce (2015) and Sinclair and Jackiw (2010) pertaining to Geometer’s Sketchpad, primary geometry and graphic representations in solving word problems.

To begin with the article by Sinclair and Bruce (2015) “New opportunities in geometry education at the primary school” reinforced my thinking that geometry is integral to so much of our learning they state that “geometry should be of the highest priority because it too—as a vehicle for developing spatial reasoning (p. 321)”. Yet, it is often the most overlooked and under taught mathematical unit in our classrooms. Most of my colleagues believe geometry is the unit you squeeze in in a few lessons so you can report on it. Students are often provided with basic manipulatives to “flip, slide or turn” and then draw a picture of the result.

Research by Sinclair and Bruce (2015) has shown how “new digital technologies that promote visual and kinetic interactions can help support the teaching and learning of geometry and that new technologies are already challenging assumptions about what geometry can be learned at the early primary school level (p. 324).”

I have used Geometer’s Sketchpad with my students in the past and have found it to be quite successful. Through manipulation of data points students can see how their actions influence the polygon or three-dimensional object on the screen. As stated by Sinclair and Jackiw (2010) in their chapter Modeling Practices with The Geometer’s Sketchpad the softwaredistinguishes between (relatively) concrete and (relatively) abstract mathematical ideas (p. 533).” I will continue to work with and investigate Geometer’s Sketchpad with my students.

Finally, the article by Edens, K., & Potter, E. (2008) “How students “unpack” the structure of a word problem: Graphic representations and problem-solving” made me stop and really investigate the way my students use visuals to explain their thinking in every subject.

“Students who used schematic visual representations were more successful problem solvers than those pictorially representing problem elements. The more “schematic-like” the visual representation, the more successful students were at problem solution (p184).”

I realize that it would likely be beneficial for me to introduce to my students the concept of schematic visuals vs pictoral visuals. Are my students drawing a picture and not really saying anything or are they using schematics to demonstrate interactions and important concepts? This idea really made me stop and think about how I have taught using visuals and that I have work to do in this area with my students.


References:

Edens, K., & Potter, E. (2008). How students “unpack” the structure of a word problem: Graphic representations and problem-solving. School Science and Mathematics, 108(5), 184-196

Finkelstein, N.D., Perkins, K.K., Adams, W., Kohl, P., & Podolefsky, N. (2005). When learning about the real world is better done virtually: A study of substituting computer simulations for laboratory equipment. Physics Education Research,1(1), 1-8.

Sinclair, N., & Bruce, C. D. (2015). New opportunities in geometry education at the primary school. ZDM47(3), 319-329.

Sinclair, N., & Jackiw, N. (2010). Modeling Practices with The Geometer’s Sketchpad. In Modeling Students’ Mathematical Modeling Competencies (pp. 541-554). Springer US

Srinivasan, S., Perez, L. C., Palmer, R., Brooks, D., Wilson, K., & Fowler. D. (2006). Reality versus simulation. Journal of Science Education and Technology, 15(2), 137-141

Stieff, M., & Wilensky, U. (2003). Connected chemistry – Incorporating interactive simulations into the chemistry classroom. Journal of Science Education and Technology, 12(3),

Climate Change through WISE, PhET, and Climate Time Machine

Misconception: Climate Change cannot be stopped and that it has limited effects on people and society.

Targeted grade group: Grade 7

Premise: Given that climate change is a growing concern and a current global problem frequently discussed in the media, it is important students become educated and empowered citizens about this issue.

Step 1: Assess students’ prior knowledge about climate change

Research: Shepardson, Niyogi, Choi et al. (2011) conducted a study to discover the conceptions secondary students have about global warming and climate change. Their research corroborated with previous research; there were multiple misconceptions students had about these two topics. Students showed confusion about the greenhouse effect, such as the kind of radiation it involves (Shepardson et al., 2011). As well, students also believed global warming was caused by greenhouse gases and air pollution in general (Shepardson et al., 2011). More importantly, students indicated that the negative effects of global warming and climate change will not have a significant impact on them or society (Shepardson et al., 2011). Specifically, they have the belief that humans will create new technologies or find ways to overcome these negative environmental changes (Shepardson et al., 2011). Moreover, students solutions to minimizing the effects of climate change and global warming include: using the car less, limiting pollution and reducing factories (Shepardson et al., 2011).

Activity: Shepardson et al. (2011) utilized a global warming and climate change assessment instrument where students completed open ended questions and “draw-and-explain” items to allow assessors to analyze the content of responses. This is an effective method to implement because I can visualize my students’ understanding of climate change in terms of accuracy, depth and breadth. I would likely begin with asking them what they think climate change or global warming means and to draw a picture of how they believe it works. An open-ended question I would include from the article was based on the National Assessment of Educational Progress (NAEP) that asks students to explain how global warming might affect oceans, weather, plants, animals, people and society (Shepardson et al., 2011).

Step 2: Have students explore Climate Time Machine

The Climate Time Machine (hyperlink) was created by NASA to visualize the time lapse of the effects of climate change on sea ice, sea level, carbon dioxide and global temperature. It allows students to “see” the what climate change is. This supports the Scaffolded Knowledge Integration Framework principle of “making thinking visible” (Linn, Clark, & Slotta, 2003). Visualizations like the Climate Time Machine helps students develop connections to concepts (Linn, Clark, & Slotta, 2003). The effects of climate change are not easily visualized by students but using this digital visualization tool, students can better understand what climate change looks like over time.

Activity: I would have my students get into small groups of two or three and to “play around” with the dials of each climate indicator to see how the Earth has been impacted by climate change. They will then discuss aspects they have noticed and things they have learned.

Step 3: Have students explore PhET simulations on glaciers and the greenhouse effect

PhET offers two simulations related to climate change for students to explore. Finkelstein, Perkins, Adams, Kohl, and Podolefsky (2005) found that in inquiry-based units, students exploring simulations learned more content than students using actual lab equipment. That is, students who used computer simulations showed more understanding about circuits in terms of building and writing about them (Finkelstein et al., 2005).

Activity:  The first simulation is called Glaciers (https://phet.colorado.edu/en/simulation/legacy/glaciers) and students can adjust with mountain snowfall and temperature to see the change in size of glaciers. They will also have opportunities to measure different parameters of a glacier. Students will be asked to reflect in their journals of how this activity is connected to climate change and to develop linkages of how this can affect the oceans, and habitats of living organisms. The second simulation is The Greenhouse Effect (https://phet.colorado.edu/en/simulation/legacy/greenhouse) and students get to alter gas concentration, cloud presence, and explore the temperature of the atmosphere. Students will build an understanding of what the greenhouse effect is and why greenhouse gases affect temperature. In a class discussion, students will contribute ideas to create a class-wide conception of the greenhouse effect, with the teacher facilitating understanding.

Step 4: Redesign WISE project catered to students’ conceptions and misconceptions about climate change

A Web-based Inquiry Science Environment (WISE) project will be adapted and modified to address students’ understanding about climate change. WISE is founded on the scaffolded knowledge integration perspective that has four principles of making student thinking visible, making science accessible, creating opportunities for peer learning and encouraging continuous learning (Linn, Clark, & Slotta, 2003). The specific WISE project I would modify is “What Impacts Global Climate Change?”. It explores the greenhouse effect and has opportunities for empowering students in effective ways to alleviate climate change. However, there is a significant amount of time spent discussing solar radiation and I would like my students to explore other types of radiation and furthermore, the ways actions in everyday life that contribute to global warming.

Step 5: Assess students’ progress

Linn, Clark, & Slotta (2003) emphasize WISE through scaffolding knowledge integration framework as a tool to make student thinking visible. This relates to the assessment of student learning in the process of the unit about climate change. Through discussions, journals and the WISE platform (e.g. it tracks student responses), educators will have a range of assessment methods to explore how student thinking changes over time.


Finkelstein, N.D., Perkins, K.K., Adams, W., Kohl, P., & Podolefsky, N. (2005). When learning about the real world is better done virtually: A study of substituting computer simulations for laboratory equipment. Physics Education Research,1(1), 1-8.

Linn, M., Clark, D., & Slotta, J. (2003). Wise design for knowledge integration. Science Education, 87(4), 517-538.

Shepardson, D.P., Niyogi, D., Choi, S. et al. Climatic Change (2011) 104: 481. doi:10.1007/s10584-009-9786-9

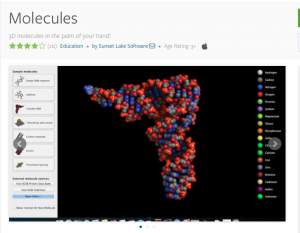
Learning about molecules using T-Gem, Phet and Leap Motion

Misconception: How molecules are created and how manipulating the atoms creates new and different molecules.

*I teach elementary and would perhaps introduce this to my grade 7-8 students. It may be more applicable to high school. I explored chemistry as it is my weakest link in science so if my terminology is off I apologize to those who are chemistry stars. I just wanted to challenge myself to learn something new.

Goals:

Students will be able to demonstrate basic knowledge of molecules and how they are created. Students will have an opportunity to manipulate molecules to form different compounds.

Students will recognize that molecules must be formed in a certain way with specific bonds.

Materials:

Computers on Wheels (COWS)

https://phet.colorado.edu/en/simulation/molecule-shapes-basics

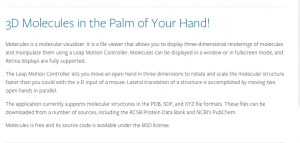
One station set up with leap motion controller and molecules activity.


For a final exploration of this module or as a means to extend the learning of those who are interested I would then tie in the Molecular Workbench website. This site, although more advanced, would allow students to investigate molecules in more depth on their own.

http://mw.concord.org/modeler/

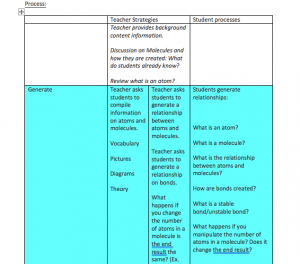
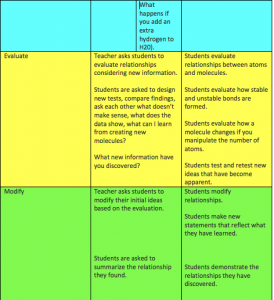
The foundation of this lesson is based on Finkelstein et al (2005) article “When learning about the real world is better done virtually: A study of substituting computer simulations for laboratory equipment “. In previous chemistry courses, students have used coloured Styrofoam and connectors to create molecules. As the students can create just about anything they have no idea if the molecules they are creating hold up to the laws of chemistry. A computer simulation would correct any misconceptions the students had. Finklestein et al (2005) reported that “results indicate that properly designed simulations used in the right contexts can be more effective educational tools than real laboratory equipment, both in developing student facility with real equipment and at fostering student conceptual understanding (p. 2).” They further state that in an inquiry-based laboratory, students using the simulations learned more content than did students using real equipment (p. 6).”

Steiff and Wilensky (2003) reported that computer-based curriculum provides an opportunity for inquiry-based chemistry lessons. (I highly suggest this article if you have not read it and teach chemistry).

“The modeling environment, connected chemistry, uses a “glass box” approach (Wilensky, 1999a) that not only enables students to visualize the molecular world but also provides them with virtually unlimited opportunities to interact with and to manipulate a simulated molecular world to gain a deeper under- standing of core chemistry concepts and phenomena (p. 285).”

Simulations allow students to make predictions about a concept and justify their predictions with observable outcomes (p. 286).

Finally, the article by Edens, K., & Potter, E. (2008) although pertaining to mathematics and word problems made me stop and really investigate the way my students use visuals to explain their thinking in every subject.

“Students who used schematic visual representations were more successful problem solvers than those pictorially representing problem elements. The more “schematic-like” the visual representation, the more successful students were at problem solution (p184).”

I realize that it would likely be beneficial for me to introduce to my students the concept of schematic visuals and pictoral visuals. Are my students drawing a picture and not really saying anything or are they using schematics to demonstrate interactions and important concepts? This idea really made me stop and think about how I have taught using visuals.

References:

Edens, K., & Potter, E. (2008). How students “unpack” the structure of a word problem: Graphic representations and problem solving. School Science and Mathematics, 108(5), 184-196

Finkelstein, N.D., Perkins, K.K., Adams, W., Kohl, P., & Podolefsky, N. (2005). When learning about the real world is better done virtually: A study of substituting computer simulations for laboratory equipment. Physics Education Research,1(1), 1-8.

Stieff, M., & Wilensky, U. (2003). Connected chemistry – Incorporating interactive simulations into the chemistry classroom. Journal of Science Education and Technology, 12(3), 285-302.


Double Dipping with “Conquering Mount Gravitation”

Hmmm… I’m not sure if this is a legitimate post for this week so I will likely address the second question later on. Anyway, it seems as though my post from the TGEM week fits nicely into our task requirements. I definitely put some hours into this lesson, so here goes… (the lesson is attached to the end of this post)

Having yet to finish reading the “related literature”, I think I will return with more thoughts to add to my PhET lesson!  To be continued!!!!

<insert dramatic yet Monty Python-esque interlude music>

I’m back! The two papers that I read today were “Reality versus Simulation” and “Fifty Years of Thinking About Visualization and Visualizing in Mathematics Education: A Historical Overview”. ( Srinivasan et al, 2006; Clements, 2014).  Relating these reading to my guided inquiry-based, simulation, T-GEM lesson…

  1. “Reality versus Simulation”
    • the authors conceded that there were no distinguishable quantitative differences between students’ learning outcomes via a simulation or an actual lab
    • the big takeaway was that the majority of students perceived that the simulation was not as valuable of an experience than actually setting up and testing with real equipment; the simulations seemed inauthentic to students; professors perceived no difference in modalities
    • the authors suggest there may be benefits to having open-ended discussions with students to help them appreciate the validity and worthiness of using a problem-free, time efficient simulation
    • adding this type of discussion to Mt. Gravitation would be relatively simple to do; I refer to the simulation throughout the unit already, however, a more directed discussion could help mitigate students’ negative perceptions
  2. “Fifty Years of Thinking About Visualization and Visualizing in Mathematics Education: A Historical Overview”
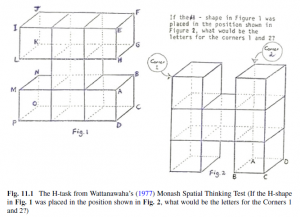
    • very engaging paper for mathematics educators; very readable and contains engaging problems throughout; I subjected my mathematically gifted, 10 year old to the H-Shape problem– he nailed it and when asked about the method he used, he used analytical approaches over visual approaches (very interesting!!!)

      Wattanawaha’s Monash Spatial Thinking Test, (Clements, 2014)

    • there are many interpretations of what mathematical visualization entails
    • one research process is to categorize students using the Mathematical Processing Instrument where subjects answer problems and solutions are categorized as visual, verbal-logical or neither in nature.
    • it turns out that students who utilize verbal-logical methodologies primarily, perform better on math tests
    • the author pushes the reader to think of ways to exploit a visual learner’s strengths to make them more successful in the mathematical classroom setting
    •  relating these ideas back to my lesson reminds me that some of students will be able to interpret the graphical relationships connecting force to separation distance, more easily than others; my students have inherent strengths– to be able to work with those strengths yet also assist them develop their “non-strengths”, will continue to be a goal of mine as I guide them through their learning
    • another interesting takeaway from this paper was that visual learners tend to apply visual strategies to problems that are optimally solved using verbal-logical strategies; also verbal-logical learners will tend to favour verbal-logical strategies when a visual approach is more efficient; as educators, we can introduce problem strategies that “go against the grain” of our students’ preferences, in order to maximize their overall experience and comprehension

Conquering Mt. Gravitation

References

Clements, M. K. A. (2014). Fifty years of thinking about visualization and visualizing in mathematics education: A historical overview. In Mathematics & Mathematics Education: Searching for Common Ground (pp. 177-192). Springer Netherlands.

Srinivasan, S., Perez, L. C., Palmer,R., Brooks,D., Wilson,K., & Fowler. D. (2006). Reality versus simulation. Journal of Science Education and Technology, 15(2), 137-141.